Races in Mounds View, Minnesota (MN) Detailed Stats
Data:
Races - White alone (%)
Races - White alone (% change since 2000)
Races - Black alone (%)
Races - Black alone (% change since 2000)
Races - American Indian alone (%)
Races - American Indian alone (% change since 2000)
Races - Asian alone (%)
Races - Asian alone (% change since 2000)
Races - Hispanic (%)
Races - Hispanic (% change since 2000)
Races - Native Hawaiian and Other Pacific Islander alone (%)
Races - Native Hawaiian and Other Pacific Islander alone (% change since 2000)
Races - Two or more races(%)
Races - Two or more races(% change since 2000)
Races - Other race alone (%)
Races - Other race alone (% change since 2000)
Racial diversity
Place of birth - Born in state of residence (%)
Place of birth - Born in state of residence (%) - White
Place of birth - Born in state of residence (%) - Black or African American
Place of birth - Born in state of residence (%) - Asian
Place of birth - Born in state of residence (%) - Hispanic or Latino
Place of birth - Born in state of residence (%) - American Indian and Alaska Native
Place of birth - Born in state of residence (%) - Multirace
Place of birth - Born in state of residence (%) - Other Race
Place of birth - Born in other state (%)
Place of birth - Born in other state (%) - White
Place of birth - Born in other state (%) - Black or African American
Place of birth - Born in other state (%) - Asian
Place of birth - Born in other state (%) - Hispanic or Latino
Place of birth - Born in other state (%) - American Indian and Alaska Native
Place of birth - Born in other state (%) - Multirace
Place of birth - Born in other state (%) - Other Race
Place of birth - Native, outside of US (%)
Place of birth - Native, outside of US (%) - White
Place of birth - Native, outside of US (%) - Black or African American
Place of birth - Native, outside of US (%) - Asian
Place of birth - Native, outside of US (%) - Hispanic or Latino
Place of birth - Native, outside of US (%) - American Indian and Alaska Native
Place of birth - Native, outside of US (%) - Multirace
Place of birth - Native, outside of US (%) - Other Race
Place of birth - Foreign born (%)
Place of birth - Foreign born (%) - White
Place of birth - Foreign born (%) - Black or African American
Place of birth - Foreign born (%) - Asian
Place of birth - Foreign born (%) - Hispanic or Latino
Place of birth - Foreign born (%) - American Indian and Alaska Native
Place of birth - Foreign born (%) - Multirace
Place of birth - Foreign born (%) - Other Race
Residents speaking English at home (%)
Residents speaking English at home - Born in the United States (%)
Residents speaking English at home - Native, born elsewhere (%)
Residents speaking English at home - Foreign born (%)
Residents speaking Spanish at home (%)
Residents speaking Spanish at home - Born in the United States (%)
Residents speaking Spanish at home - Native, born elsewhere (%)
Residents speaking Spanish at home - Foreign born (%)
Residents speaking other language at home (%)
Residents speaking other language at home - Born in the United States (%)
Residents speaking other language at home - Native, born elsewhere (%)
Residents speaking other language at home - Foreign born (%)
Marital status - Never married (%)
Marital status - Now married (%)
Marital status - Separated (%)
Marital status - Widowed (%)
Marital status - Divorced (%)
Ancestries Reported - Arab (%)
Ancestries Reported - Czech (%)
Ancestries Reported - Danish (%)
Ancestries Reported - Dutch (%)
Ancestries Reported - English (%)
Ancestries Reported - French (%)
Ancestries Reported - French Canadian (%)
Ancestries Reported - German (%)
Ancestries Reported - Greek (%)
Ancestries Reported - Hungarian (%)
Ancestries Reported - Irish (%)
Ancestries Reported - Italian (%)
Ancestries Reported - Lithuanian (%)
Ancestries Reported - Norwegian (%)
Ancestries Reported - Polish (%)
Ancestries Reported - Portuguese (%)
Ancestries Reported - Russian (%)
Ancestries Reported - Scotch-Irish (%)
Ancestries Reported - Scottish (%)
Ancestries Reported - Slovak (%)
Ancestries Reported - Subsaharan African (%)
Ancestries Reported - Swedish (%)
Ancestries Reported - Swiss (%)
Ancestries Reported - Ukrainian (%)
Ancestries Reported - United States (%)
Ancestries Reported - Welsh (%)
Ancestries Reported - West Indian (%)
Ancestries Reported - Other (%)
Geographical mobility - Same house 1 year ago (%)
Geographical mobility - Same house 1 year ago (%) - White
Geographical mobility - Same house 1 year ago (%) - Black or African American
Geographical mobility - Same house 1 year ago (%) - Asian
Geographical mobility - Same house 1 year ago (%) - Hispanic or Latino
Geographical mobility - Same house 1 year ago (%) - American Indian and Alaska Native
Geographical mobility - Same house 1 year ago (%) - Multirace
Geographical mobility - Same house 1 year ago (%) - Other Race
Geographical mobility - Moved within same county (%)
Geographical mobility - Moved within same county (%) - White
Geographical mobility - Moved within same county (%) - Black or African American
Geographical mobility - Moved within same county (%) - Asian
Geographical mobility - Moved within same county (%) - Hispanic or Latino
Geographical mobility - Moved within same county (%) - American Indian and Alaska Native
Geographical mobility - Moved within same county (%) - Multirace
Geographical mobility - Moved within same county (%) - Other Race
Geographical mobility - Moved from different county within same state (%)
Geographical mobility - Moved from different county within same state (%) - White
Geographical mobility - Moved from different county within same state (%) - Black or African American
Geographical mobility - Moved from different county within same state (%) - Asian
Geographical mobility - Moved from different county within same state (%) - Hispanic or Latino
Geographical mobility - Moved from different county within same state (%) - American Indian and Alaska Native
Geographical mobility - Moved from different county within same state (%) - Multirace
Geographical mobility - Moved from different county within same state (%) - Other Race
Geographical mobility - Moved from different state (%)
Geographical mobility - Moved from different state (%) - White
Geographical mobility - Moved from different state (%) - Black or African American
Geographical mobility - Moved from different state (%) - Asian
Geographical mobility - Moved from different state (%) - Hispanic or Latino
Geographical mobility - Moved from different state (%) - American Indian and Alaska Native
Geographical mobility - Moved from different state (%) - Multirace
Geographical mobility - Moved from different state (%) - Other Race
Geographical mobility - Moved from abroad (%)
Geographical mobility - Moved from abroad (%) - White
Geographical mobility - Moved from abroad (%) - Black or African American
Geographical mobility - Moved from abroad (%) - Asian
Geographical mobility - Moved from abroad (%) - Hispanic or Latino
Geographical mobility - Moved from abroad (%) - American Indian and Alaska Native
Geographical mobility - Moved from abroad (%) - Multirace
Geographical mobility - Moved from abroad (%) - Other Race
Place of birth for the foreign-born population - Ireland (%)
Place of birth for the foreign-born population - Denmark (%)
Place of birth for the foreign-born population - Norway (%)
Place of birth for the foreign-born population - Sweden (%)
Place of birth for the foreign-born population - United Kingdom (%)
Place of birth for the foreign-born population - England (%)
Place of birth for the foreign-born population - Scotland (%)
Place of birth for the foreign-born population - Other Northern Europe (%)
Place of birth for the foreign-born population - Austria (%)
Place of birth for the foreign-born population - Belgium (%)
Place of birth for the foreign-born population - France (%)
Place of birth for the foreign-born population - Germany (%)
Place of birth for the foreign-born population - Netherlands (%)
Place of birth for the foreign-born population - Switzerland (%)
Place of birth for the foreign-born population - Other Western Europe (%)
Place of birth for the foreign-born population - Greece (%)
Place of birth for the foreign-born population - Italy (%)
Place of birth for the foreign-born population - Portugal (%)
Place of birth for the foreign-born population - Spain (%)
Place of birth for the foreign-born population - Other Southern Europe (%)
Place of birth for the foreign-born population - Albania (%)
Place of birth for the foreign-born population - Belarus (%)
Place of birth for the foreign-born population - Bosnia and Herzegovina (%)
Place of birth for the foreign-born population - Bulgaria (%)
Place of birth for the foreign-born population - Croatia (%)
Place of birth for the foreign-born population - Czechoslovakia (%)
Place of birth for the foreign-born population - Hungary (%)
Place of birth for the foreign-born population - Latvia (%)
Place of birth for the foreign-born population - Lithuania (%)
Place of birth for the foreign-born population - North Macedonia (Macedonia) (%)
Place of birth for the foreign-born population - Moldova (%)
Place of birth for the foreign-born population - Poland (%)
Place of birth for the foreign-born population - Romania (%)
Place of birth for the foreign-born population - Russia (%)
Place of birth for the foreign-born population - Serbia (%)
Place of birth for the foreign-born population - Ukraine (%)
Place of birth for the foreign-born population - Other Eastern Europe (%)
Place of birth for the foreign-born population - China (%)
Place of birth for the foreign-born population - Hong Kong (%)
Place of birth for the foreign-born population - Taiwan (%)
Place of birth for the foreign-born population - Japan (%)
Place of birth for the foreign-born population - Korea (%)
Place of birth for the foreign-born population - Other Eastern Asia (%)
Place of birth for the foreign-born population - Afghanistan (%)
Place of birth for the foreign-born population - Bangladesh (%)
Place of birth for the foreign-born population - India (%)
Place of birth for the foreign-born population - Iran (%)
Place of birth for the foreign-born population - Kazakhstan (%)
Place of birth for the foreign-born population - Nepal (%)
Place of birth for the foreign-born population - Pakistan (%)
Place of birth for the foreign-born population - Sri Lanka (%)
Place of birth for the foreign-born population - Uzbekistan (%)
Place of birth for the foreign-born population - Other South Central Asia (%)
Place of birth for the foreign-born population - Burma (%)
Place of birth for the foreign-born population - Cambodia (%)
Place of birth for the foreign-born population - Indonesia (%)
Place of birth for the foreign-born population - Laos (%)
Place of birth for the foreign-born population - Malaysia (%)
Place of birth for the foreign-born population - Philippines (%)
Place of birth for the foreign-born population - Singapore (%)
Place of birth for the foreign-born population - Thailand (%)
Place of birth for the foreign-born population - Vietnam (%)
Place of birth for the foreign-born population - Other South Eastern Asia (%)
Place of birth for the foreign-born population - Armenia (%)
Place of birth for the foreign-born population - Iraq (%)
Place of birth for the foreign-born population - Israel (%)
Place of birth for the foreign-born population - Jordan (%)
Place of birth for the foreign-born population - Kuwait (%)
Place of birth for the foreign-born population - Lebanon (%)
Place of birth for the foreign-born population - Saudi Arabia (%)
Place of birth for the foreign-born population - Syria (%)
Place of birth for the foreign-born population - Turkey (%)
Place of birth for the foreign-born population - Yemen (%)
Place of birth for the foreign-born population - Other Western Asia (%)
Place of birth for the foreign-born population - Eritrea (%)
Place of birth for the foreign-born population - Ethiopia (%)
Place of birth for the foreign-born population - Kenya (%)
Place of birth for the foreign-born population - Somalia (%)
Place of birth for the foreign-born population - Uganda (%)
Place of birth for the foreign-born population - Zimbabwe (%)
Place of birth for the foreign-born population - Other Eastern Africa (%)
Place of birth for the foreign-born population - Cameroon (%)
Place of birth for the foreign-born population - Congo (%)
Place of birth for the foreign-born population - Democratic Republic of Congo (Zaire) (%)
Place of birth for the foreign-born population - Other Middle Africa (%)
Place of birth for the foreign-born population - Egypt (%)
Place of birth for the foreign-born population - Morocco (%)
Place of birth for the foreign-born population - Sudan (%)
Place of birth for the foreign-born population - Other Northern Africa (%)
Place of birth for the foreign-born population - South Africa (%)
Place of birth for the foreign-born population - Other Southern Africa (%)
Place of birth for the foreign-born population - Cabo Verde (%)
Place of birth for the foreign-born population - Ghana (%)
Place of birth for the foreign-born population - Liberia (%)
Place of birth for the foreign-born population - Nigeria (%)
Place of birth for the foreign-born population - Senegal (%)
Place of birth for the foreign-born population - Sierra Leone (%)
Place of birth for the foreign-born population - Other Western Africa (%)
Place of birth for the foreign-born population - Australia (%)
Place of birth for the foreign-born population - New Zealand (%)
Place of birth for the foreign-born population - Fiji (%)
Place of birth for the foreign-born population - Micronesia (%)
Place of birth for the foreign-born population - Bahamas (%)
Place of birth for the foreign-born population - Barbados (%)
Place of birth for the foreign-born population - Cuba (%)
Place of birth for the foreign-born population - Dominica (%)
Place of birth for the foreign-born population - Dominican Republic (%)
Place of birth for the foreign-born population - Grenada (%)
Place of birth for the foreign-born population - Haiti (%)
Place of birth for the foreign-born population - Jamaica (%)
Place of birth for the foreign-born population - St. Vincent and the Grenadines (%)
Place of birth for the foreign-born population - Trinidad and Tobago (%)
Place of birth for the foreign-born population - West Indies (%)
Place of birth for the foreign-born population - Other Caribbean (%)
Place of birth for the foreign-born population - Belize (%)
Place of birth for the foreign-born population - Costa Rica (%)
Place of birth for the foreign-born population - El Salvador (%)
Place of birth for the foreign-born population - Guatemala (%)
Place of birth for the foreign-born population - Honduras (%)
Place of birth for the foreign-born population - Mexico (%)
Place of birth for the foreign-born population - Nicaragua (%)
Place of birth for the foreign-born population - Panama (%)
Place of birth for the foreign-born population - Other Central America (%)
Place of birth for the foreign-born population - Argentina (%)
Place of birth for the foreign-born population - Bolivia (%)
Place of birth for the foreign-born population - Brazil (%)
Place of birth for the foreign-born population - Chile (%)
Place of birth for the foreign-born population - Colombia (%)
Place of birth for the foreign-born population - Ecuador (%)
Place of birth for the foreign-born population - Guyana (%)
Place of birth for the foreign-born population - Peru (%)
Place of birth for the foreign-born population - Uruguay (%)
Place of birth for the foreign-born population - Venezuela (%)
Place of birth for the foreign-born population - Other South America (%)
Place of birth for the foreign-born population - Canada (%)
Place of birth for the foreign-born population - Other Northern America (%)
Place of birth for the foreign-born population - Other (%)
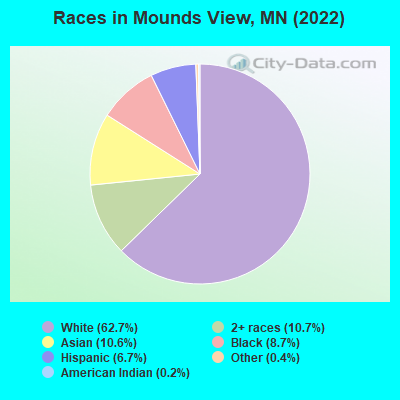
According to 2022 data, the most numerous races in Mounds View, MN are White alone (8,048 residents), Black alone (1,115 residents), and Hispanic (866 residents). 83.5% of Mounds View residents speak English at home. 12.3% of Mounds View, MN residents are foreign-born (5.0% born in Asia, 3.7% born in Africa, 2.3% born in Latin America), which is 35.0% greater than the foreign-born rate of 8.0% across the entire state of Minnesota.
Race distribution in Mounds View
2000 2022
4,337,143 88.2% White alone 168,813 3.4% Black alone 143,382 2.9% Hispanic 141,083 2.9% Asian alone 70,304 1.4% Two or more races 52,009 1.1% American Indian alone 5,031 0.1% Other race alone 1,714 0.03% Native Hawaiian and Other
4,356,347 76.2% White alone 395,179 6.9% Black alone 333,830 5.8% Hispanic 294,800 5.2% Asian alone 259,649 4.5% Two or more races 42,125 0.7% American Indian alone 32,976 0.6% Other race alone 2,278 0.04% Native Hawaiian and Other
Income and house value in Mounds View Median household income in 2022 $88,668 White non-Hispanic householders$44,957 Black householders$93,162 Asian householders$95,792 Two or more races householders$69,940 Hispanic or Latino race householdersMedian 2022 house value $315,727 White Non-Hispanic householders$228,011 Black or African American householders$264,891 American Indian or Alaska Native householders $323,452 Asian householders$280,341 Some other race householders$436,087 Two or more races householders$308,749 Hispanic or Latino householders
Median age by race in Mounds View
47.2 Median age for White residents45.0 48.1 28.4 Median age for Black or African American residents28.2 27.0 65.7 Median age for American Indian / Alaska Native residents-1,081,272,083.7 -696,340,256.5 29.6 Median age for Asian residents27.8 30.7 -744,336,568.8 Median age for Native Hawaiian / Pacific Islander residents-856,799,036.4 -534,959,349.1 20.8 Median age for Other race residents19.3 24.4 15.3 Median age for Two or more races residents19.2 13.5 47.0 Median age for White alone residents45.3 47.9 25.0 Median age for Hispanic or Latino residents25.1 23.3
Owner/renter occupied households by race in Mounds View
House owners and renters - White residents 2,903 75.6% Owner occupied937 24.4% Renter occupiedHouse owners and renters - Black or African American residents 94 21.3% Owner occupied349 78.7% Renter occupiedHouse owners and renters - American Indian / Alaska Native residents 33 100.0% Owner occupiedHouse owners and renters - Asian residents 224 49.2% Owner occupied232 50.8% Renter occupiedHouse owners and renters - Other race residents 110 47.7% Owner occupied121 52.3% Renter occupiedHouse owners and renters - Two or more races residents 145 58.7% Owner occupied102 41.3% Renter occupiedHouse owners and renters - White alone residents 2,902 75.2% Owner occupied956 24.8% Renter occupiedHouse owners and renters - Hispanic or Latino residents 194 65.8% Owner occupied101 34.2% Renter occupied
Language usage in Mounds View
English speakers - Total 83.5% of residents of Mounds View speak English at home.
4.8% of residents speak Spanish at home 354 63.1% Speak English very well207 36.9% Speak English less than very well11.8% of residents speak other language at home 777 56.0% Speak English very well611 44.0% Speak English less than very well
English speakers - Born in the United States 89.3% of residents of Mounds View speak English at home.
7.2% of residents speak Spanish at home 163 100.0% Speak English very well4.1% of residents speak other language at home 65 69.9% Speak English very well28 30.1% Speak English less than very well
English speakers - Native, born elsewhere 44.7% of residents of Mounds View speak English at home.
76.0% of residents speak other language at home 32 28.1% Speak English very well82 71.9% Speak English less than very well
English speakers - Foreign-born 18.3% of residents of Mounds View speak English at home.
18.5% of residents speak Spanish at home 69 24.8% Speak English very well209 75.2% Speak English less than very well62.7% of residents speak other language at home 509 54.1% Speak English very well431 45.9% Speak English less than very well
White (Caucasian) - Speak only English Native:
99.0% (7,400)Foreign-born:
22.0% (33)
White (Caucasian) - Speak another language Native:
1.5% (109)Foreign-born:
66.8% (100)
Black or African American - Speak only English Native:
100.0% (728)Foreign-born:
30.9% (110)
American Indian / Alaska Native - Speak only English Native:
85.8% (21)Foreign-born:
40.2% (18)
Asian - Speak only English Native:
33.1% (188)Foreign-born:
16.0% (105)
Asian - Speak another language Native:
66.6% (378)Foreign-born:
84.3% (555)
Other race - Speak another language Native:
81.2% (222)Foreign-born:
99.3% (252)
Two or more races - Speak another language Native:
4.7% (56)Foreign-born:
100.0% (30)
White alone - Speak only English Native:
98.8% (7,393)Foreign-born:
19.8% (37)
White alone - Speak another language Native:
1.3% (99)Foreign-born:
75.1% (139)
Hispanic or Latino - Speak another language Native:
52.8% (235)Foreign-born:
99.7% (271)
Foreign-born residents in Mounds View 1,581 residents are foreign born (5.0% Asia , 3.7% Africa , 2.3% Latin America ).
This city:
12.3%Minnesota:
8.5%
Marital status for residents in Mounds View Marital status - White (Caucasian) population 15 years and over
Males 30.2% Never married53.5% Now married1.1% Separated4.1% Widowed11.1% DivorcedFemales 24.0% Never married51.4% Now married0.3% Separated9.1% Widowed15.2% DivorcedWomen who gave birth in the past 12 months Now married:
87.7% (59)Unmarried:
12.3% (8)
Women who did not give birth in the past 12 months Now married:
45.7% (717)Unmarried:
54.3% (852)
Marital status - Black or African American population 15 years and over
Males 54.7% Never married25.7% Now married10.6% Separated0.0% Widowed9.0% DivorcedFemales 52.2% Never married21.8% Now married0.0% Separated0.0% Widowed26.0% DivorcedWomen who did not give birth in the past 12 months Now married:
24.1% (98)Unmarried:
75.9% (308)
Marital status - American Indian / Alaska Native population 15 years and over
Males 73.3% Never married26.7% Now married0.0% Separated0.0% Widowed0.0% DivorcedFemales 0.0% Never married100.0% Now married0.0% Separated0.0% Widowed0.0% DivorcedWomen who did not give birth in the past 12 months Now married:
100.0% (10)Unmarried:
0.0% (0)
Marital status - Asian population 15 years and over
Males 53.7% Never married39.3% Now married1.3% Separated0.0% Widowed5.6% DivorcedFemales 52.7% Never married37.5% Now married3.4% Separated4.6% Widowed1.9% DivorcedWomen who gave birth in the past 12 months Now married:
100.0% (14)Unmarried:
0.0% (0)
Women who did not give birth in the past 12 months Now married:
34.7% (162)Unmarried:
65.3% (305)
Marital status - Other race population 15 years and over
Males 42.3% Never married57.7% Now married0.0% Separated0.0% Widowed0.0% DivorcedFemales 30.9% Never married59.7% Now married0.0% Separated0.0% Widowed9.4% DivorcedWomen who did not give birth in the past 12 months Now married:
59.7% (141)Unmarried:
40.3% (95)
Marital status - Two or more races population 15 years and over
Males 73.5% Never married18.1% Now married0.0% Separated0.0% Widowed8.4% DivorcedFemales 20.6% Never married29.4% Now married0.0% Separated21.7% Widowed28.3% DivorcedWomen who gave birth in the past 12 months Now married:
100.0% (6)Unmarried:
0.0% (0)
Women who did not give birth in the past 12 months Now married:
23.5% (27)Unmarried:
76.5% (90)
Marital status - White alone, not Hispanic / Latino population 15 years and over
Males 30.5% Never married52.9% Now married1.1% Separated4.2% Widowed11.3% DivorcedFemales 23.9% Never married51.4% Now married0.2% Separated9.2% Widowed15.4% DivorcedWomen who gave birth in the past 12 months Now married:
87.7% (61)Unmarried:
12.3% (9)
Women who did not give birth in the past 12 months Now married:
45.2% (713)Unmarried:
54.8% (866)
Marital status - Hispanic or Latino population 15 years and over
Males 46.7% Never married50.2% Now married0.0% Separated0.0% Widowed3.1% DivorcedFemales 28.3% Never married64.1% Now married2.0% Separated0.4% Widowed5.2% DivorcedWomen who did not give birth in the past 12 months Now married:
66.4% (169)Unmarried:
33.6% (86)
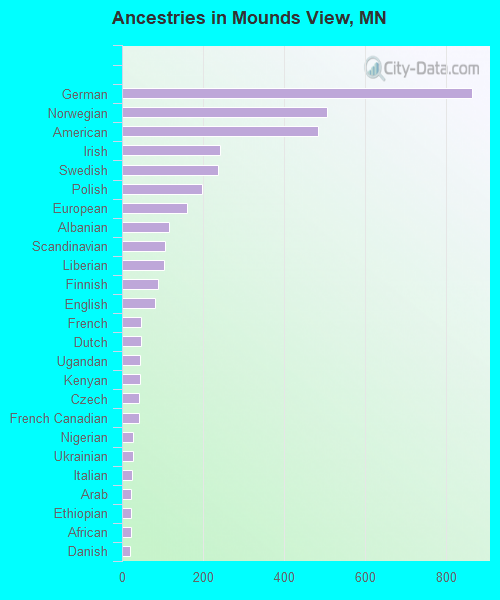
Ancestries in Mounds View
863 14.9% German505 8.7% Norwegian483 8.3% American241 4.2% Irish236 4.1% Swedish198 3.4% Polish161 2.8% European116 2.0% Albanian106 1.8% Scandinavian103 1.8% Liberian88 1.5% Finnish81 1.4% English48 0.8% French47 0.8% Dutch45 0.8% Ugandan44 0.8% Kenyan43 0.7% Czech41 0.7% French Canadian27 0.5% Nigerian26 0.4% Ukrainian25 0.4% Italian23 0.4% Arab23 0.4% Ethiopian22 0.4% African20 0.3% Danish19 0.3% Slovak18 0.3% Greek16 0.3% Northern European13 0.2% Egyptian10 0.2% Eastern European7 0.1% Austrian
Children Nativity (place of birth) in Mounds View
Children under 6 years - Living with two parents Both parents native 499 99.6% Native2 0.4% Foreign-bornBoth parents foreign-born 79 91.3% Native8 8.7% Foreign-bornOne native, one foreign-born parent 43 100.0% NativeChildren under 6 years - Living with one parent Native parent 484 100.0% NativeForeign-born parent 17 100.0% NativeChildren 6 to 17 years - Living with two parents Both parents native 666 100.0% NativeBoth parents foreign-born 96 52.3% Native87 47.7% Foreign-bornOne native, one foreign-born parent 161 100.0% NativeChildren 6 to 17 years - Living with one parent Native parent 598 100.0% NativeForeign-born parent 117 48.4% Native125 51.6% Foreign-born
Grandparents responsible for own grandchildren in Mounds View
Grandparents (30 to 59 years) White / Caucasian 13 100.0% Not responsible for grandchildrenAsian 10 100.0% Not responsible for grandchildrenTwo or more races 7 100.0% Responsible for grandchildrenWhite alone, not Hispanic / Latino 11 100.0% Not responsible for grandchildrenHispanic or Latino 7 100.0% Responsible for grandchildren
Grandparents (60 years and over) White / Caucasian 84 100.0% Not responsible for grandchildrenAsian 7 100.0% Not responsible for grandchildrenTwo or more races 45 100.0% Not responsible for grandchildrenWhite alone, not Hispanic / Latino 88 100.0% Not responsible for grandchildrenHispanic or Latino 1 75.9% Not responsible for grandchildren