Races in Moses Lake, Washington (WA) Detailed Stats
Data:
Races - White alone (%)
Races - White alone (% change since 2000)
Races - Black alone (%)
Races - Black alone (% change since 2000)
Races - American Indian alone (%)
Races - American Indian alone (% change since 2000)
Races - Asian alone (%)
Races - Asian alone (% change since 2000)
Races - Hispanic (%)
Races - Hispanic (% change since 2000)
Races - Native Hawaiian and Other Pacific Islander alone (%)
Races - Native Hawaiian and Other Pacific Islander alone (% change since 2000)
Races - Two or more races(%)
Races - Two or more races(% change since 2000)
Races - Other race alone (%)
Races - Other race alone (% change since 2000)
Racial diversity
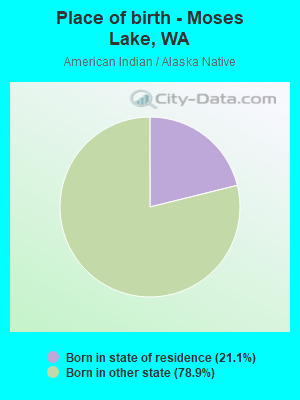
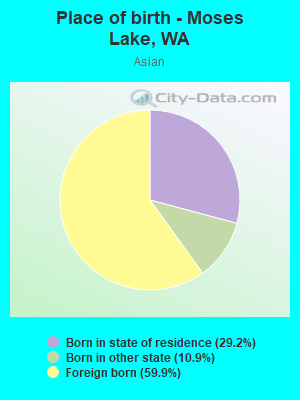
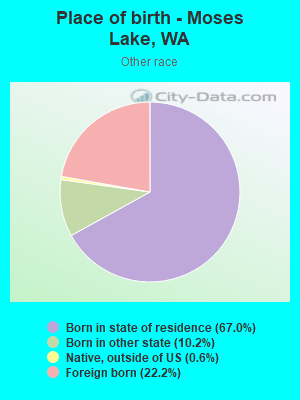
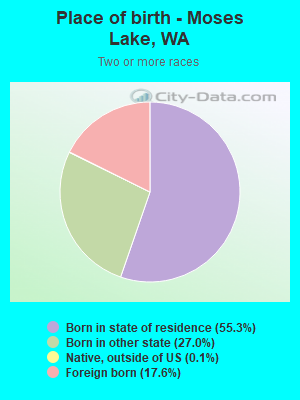
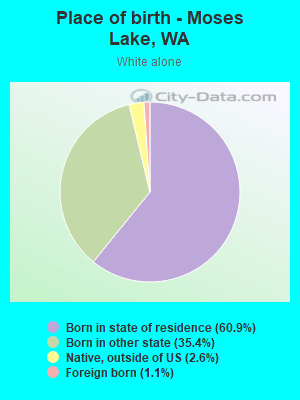
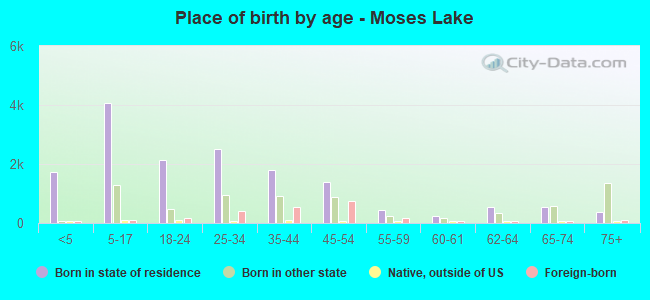
Place of birth - Born in state of residence (%)
Place of birth - Born in state of residence (%) - White
Place of birth - Born in state of residence (%) - Black or African American
Place of birth - Born in state of residence (%) - Asian
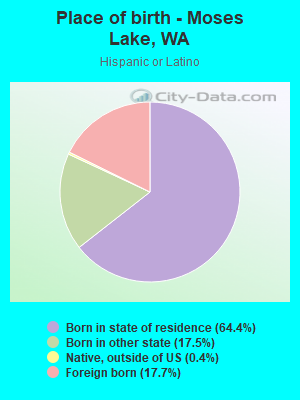
Place of birth - Born in state of residence (%) - Hispanic or Latino
Place of birth - Born in state of residence (%) - American Indian and Alaska Native
Place of birth - Born in state of residence (%) - Multirace
Place of birth - Born in state of residence (%) - Other Race
Place of birth - Born in other state (%)
Place of birth - Born in other state (%) - White
Place of birth - Born in other state (%) - Black or African American
Place of birth - Born in other state (%) - Asian
Place of birth - Born in other state (%) - Hispanic or Latino
Place of birth - Born in other state (%) - American Indian and Alaska Native
Place of birth - Born in other state (%) - Multirace
Place of birth - Born in other state (%) - Other Race
Place of birth - Native, outside of US (%)
Place of birth - Native, outside of US (%) - White
Place of birth - Native, outside of US (%) - Black or African American
Place of birth - Native, outside of US (%) - Asian
Place of birth - Native, outside of US (%) - Hispanic or Latino
Place of birth - Native, outside of US (%) - American Indian and Alaska Native
Place of birth - Native, outside of US (%) - Multirace
Place of birth - Native, outside of US (%) - Other Race
Place of birth - Foreign born (%)
Place of birth - Foreign born (%) - White
Place of birth - Foreign born (%) - Black or African American
Place of birth - Foreign born (%) - Asian
Place of birth - Foreign born (%) - Hispanic or Latino
Place of birth - Foreign born (%) - American Indian and Alaska Native
Place of birth - Foreign born (%) - Multirace
Place of birth - Foreign born (%) - Other Race
Residents speaking English at home (%)
Residents speaking English at home - Born in the United States (%)
Residents speaking English at home - Native, born elsewhere (%)
Residents speaking English at home - Foreign born (%)
Residents speaking Spanish at home (%)
Residents speaking Spanish at home - Born in the United States (%)
Residents speaking Spanish at home - Native, born elsewhere (%)
Residents speaking Spanish at home - Foreign born (%)
Residents speaking other language at home (%)
Residents speaking other language at home - Born in the United States (%)
Residents speaking other language at home - Native, born elsewhere (%)
Residents speaking other language at home - Foreign born (%)
Marital status - Never married (%)
Marital status - Now married (%)
Marital status - Separated (%)
Marital status - Widowed (%)
Marital status - Divorced (%)
Ancestries Reported - Arab (%)
Ancestries Reported - Czech (%)
Ancestries Reported - Danish (%)
Ancestries Reported - Dutch (%)
Ancestries Reported - English (%)
Ancestries Reported - French (%)
Ancestries Reported - French Canadian (%)
Ancestries Reported - German (%)
Ancestries Reported - Greek (%)
Ancestries Reported - Hungarian (%)
Ancestries Reported - Irish (%)
Ancestries Reported - Italian (%)
Ancestries Reported - Lithuanian (%)
Ancestries Reported - Norwegian (%)
Ancestries Reported - Polish (%)
Ancestries Reported - Portuguese (%)
Ancestries Reported - Russian (%)
Ancestries Reported - Scotch-Irish (%)
Ancestries Reported - Scottish (%)
Ancestries Reported - Slovak (%)
Ancestries Reported - Subsaharan African (%)
Ancestries Reported - Swedish (%)
Ancestries Reported - Swiss (%)
Ancestries Reported - Ukrainian (%)
Ancestries Reported - United States (%)
Ancestries Reported - Welsh (%)
Ancestries Reported - West Indian (%)
Ancestries Reported - Other (%)
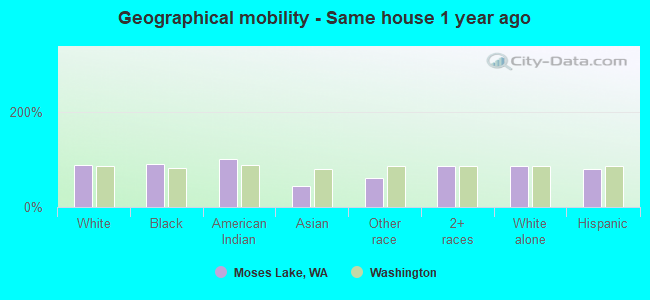
Geographical mobility - Same house 1 year ago (%)
Geographical mobility - Same house 1 year ago (%) - White
Geographical mobility - Same house 1 year ago (%) - Black or African American
Geographical mobility - Same house 1 year ago (%) - Asian
Geographical mobility - Same house 1 year ago (%) - Hispanic or Latino
Geographical mobility - Same house 1 year ago (%) - American Indian and Alaska Native
Geographical mobility - Same house 1 year ago (%) - Multirace
Geographical mobility - Same house 1 year ago (%) - Other Race
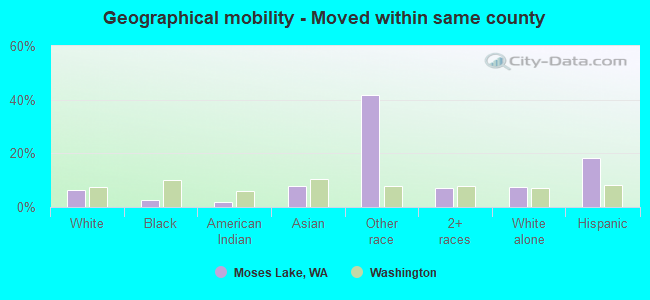
Geographical mobility - Moved within same county (%)
Geographical mobility - Moved within same county (%) - White
Geographical mobility - Moved within same county (%) - Black or African American
Geographical mobility - Moved within same county (%) - Asian
Geographical mobility - Moved within same county (%) - Hispanic or Latino
Geographical mobility - Moved within same county (%) - American Indian and Alaska Native
Geographical mobility - Moved within same county (%) - Multirace
Geographical mobility - Moved within same county (%) - Other Race
Geographical mobility - Moved from different county within same state (%)
Geographical mobility - Moved from different county within same state (%) - White
Geographical mobility - Moved from different county within same state (%) - Black or African American
Geographical mobility - Moved from different county within same state (%) - Asian
Geographical mobility - Moved from different county within same state (%) - Hispanic or Latino
Geographical mobility - Moved from different county within same state (%) - American Indian and Alaska Native
Geographical mobility - Moved from different county within same state (%) - Multirace
Geographical mobility - Moved from different county within same state (%) - Other Race
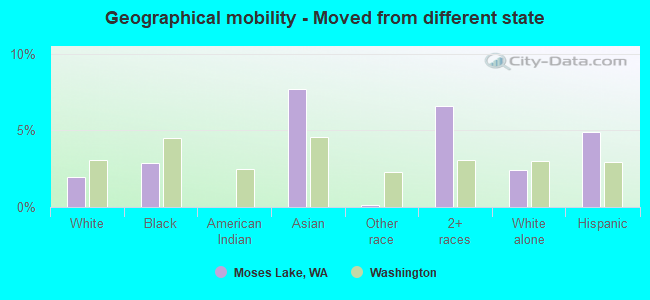
Geographical mobility - Moved from different state (%)
Geographical mobility - Moved from different state (%) - White
Geographical mobility - Moved from different state (%) - Black or African American
Geographical mobility - Moved from different state (%) - Asian
Geographical mobility - Moved from different state (%) - Hispanic or Latino
Geographical mobility - Moved from different state (%) - American Indian and Alaska Native
Geographical mobility - Moved from different state (%) - Multirace
Geographical mobility - Moved from different state (%) - Other Race
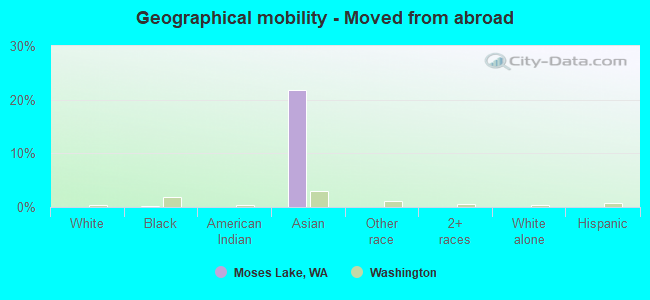
Geographical mobility - Moved from abroad (%)
Geographical mobility - Moved from abroad (%) - White
Geographical mobility - Moved from abroad (%) - Black or African American
Geographical mobility - Moved from abroad (%) - Asian
Geographical mobility - Moved from abroad (%) - Hispanic or Latino
Geographical mobility - Moved from abroad (%) - American Indian and Alaska Native
Geographical mobility - Moved from abroad (%) - Multirace
Geographical mobility - Moved from abroad (%) - Other Race
Place of birth for the foreign-born population - Ireland (%)
Place of birth for the foreign-born population - Denmark (%)
Place of birth for the foreign-born population - Norway (%)
Place of birth for the foreign-born population - Sweden (%)
Place of birth for the foreign-born population - United Kingdom (%)
Place of birth for the foreign-born population - England (%)
Place of birth for the foreign-born population - Scotland (%)
Place of birth for the foreign-born population - Other Northern Europe (%)
Place of birth for the foreign-born population - Austria (%)
Place of birth for the foreign-born population - Belgium (%)
Place of birth for the foreign-born population - France (%)
Place of birth for the foreign-born population - Germany (%)
Place of birth for the foreign-born population - Netherlands (%)
Place of birth for the foreign-born population - Switzerland (%)
Place of birth for the foreign-born population - Other Western Europe (%)
Place of birth for the foreign-born population - Greece (%)
Place of birth for the foreign-born population - Italy (%)
Place of birth for the foreign-born population - Portugal (%)
Place of birth for the foreign-born population - Spain (%)
Place of birth for the foreign-born population - Other Southern Europe (%)
Place of birth for the foreign-born population - Albania (%)
Place of birth for the foreign-born population - Belarus (%)
Place of birth for the foreign-born population - Bosnia and Herzegovina (%)
Place of birth for the foreign-born population - Bulgaria (%)
Place of birth for the foreign-born population - Croatia (%)
Place of birth for the foreign-born population - Czechoslovakia (%)
Place of birth for the foreign-born population - Hungary (%)
Place of birth for the foreign-born population - Latvia (%)
Place of birth for the foreign-born population - Lithuania (%)
Place of birth for the foreign-born population - North Macedonia (Macedonia) (%)
Place of birth for the foreign-born population - Moldova (%)
Place of birth for the foreign-born population - Poland (%)
Place of birth for the foreign-born population - Romania (%)
Place of birth for the foreign-born population - Russia (%)
Place of birth for the foreign-born population - Serbia (%)
Place of birth for the foreign-born population - Ukraine (%)
Place of birth for the foreign-born population - Other Eastern Europe (%)
Place of birth for the foreign-born population - China (%)
Place of birth for the foreign-born population - Hong Kong (%)
Place of birth for the foreign-born population - Taiwan (%)
Place of birth for the foreign-born population - Japan (%)
Place of birth for the foreign-born population - Korea (%)
Place of birth for the foreign-born population - Other Eastern Asia (%)
Place of birth for the foreign-born population - Afghanistan (%)
Place of birth for the foreign-born population - Bangladesh (%)
Place of birth for the foreign-born population - India (%)
Place of birth for the foreign-born population - Iran (%)
Place of birth for the foreign-born population - Kazakhstan (%)
Place of birth for the foreign-born population - Nepal (%)
Place of birth for the foreign-born population - Pakistan (%)
Place of birth for the foreign-born population - Sri Lanka (%)
Place of birth for the foreign-born population - Uzbekistan (%)
Place of birth for the foreign-born population - Other South Central Asia (%)
Place of birth for the foreign-born population - Burma (%)
Place of birth for the foreign-born population - Cambodia (%)
Place of birth for the foreign-born population - Indonesia (%)
Place of birth for the foreign-born population - Laos (%)
Place of birth for the foreign-born population - Malaysia (%)
Place of birth for the foreign-born population - Philippines (%)
Place of birth for the foreign-born population - Singapore (%)
Place of birth for the foreign-born population - Thailand (%)
Place of birth for the foreign-born population - Vietnam (%)
Place of birth for the foreign-born population - Other South Eastern Asia (%)
Place of birth for the foreign-born population - Armenia (%)
Place of birth for the foreign-born population - Iraq (%)
Place of birth for the foreign-born population - Israel (%)
Place of birth for the foreign-born population - Jordan (%)
Place of birth for the foreign-born population - Kuwait (%)
Place of birth for the foreign-born population - Lebanon (%)
Place of birth for the foreign-born population - Saudi Arabia (%)
Place of birth for the foreign-born population - Syria (%)
Place of birth for the foreign-born population - Turkey (%)
Place of birth for the foreign-born population - Yemen (%)
Place of birth for the foreign-born population - Other Western Asia (%)
Place of birth for the foreign-born population - Eritrea (%)
Place of birth for the foreign-born population - Ethiopia (%)
Place of birth for the foreign-born population - Kenya (%)
Place of birth for the foreign-born population - Somalia (%)
Place of birth for the foreign-born population - Uganda (%)
Place of birth for the foreign-born population - Zimbabwe (%)
Place of birth for the foreign-born population - Other Eastern Africa (%)
Place of birth for the foreign-born population - Cameroon (%)
Place of birth for the foreign-born population - Congo (%)
Place of birth for the foreign-born population - Democratic Republic of Congo (Zaire) (%)
Place of birth for the foreign-born population - Other Middle Africa (%)
Place of birth for the foreign-born population - Egypt (%)
Place of birth for the foreign-born population - Morocco (%)
Place of birth for the foreign-born population - Sudan (%)
Place of birth for the foreign-born population - Other Northern Africa (%)
Place of birth for the foreign-born population - South Africa (%)
Place of birth for the foreign-born population - Other Southern Africa (%)
Place of birth for the foreign-born population - Cabo Verde (%)
Place of birth for the foreign-born population - Ghana (%)
Place of birth for the foreign-born population - Liberia (%)
Place of birth for the foreign-born population - Nigeria (%)
Place of birth for the foreign-born population - Senegal (%)
Place of birth for the foreign-born population - Sierra Leone (%)
Place of birth for the foreign-born population - Other Western Africa (%)
Place of birth for the foreign-born population - Australia (%)
Place of birth for the foreign-born population - New Zealand (%)
Place of birth for the foreign-born population - Fiji (%)
Place of birth for the foreign-born population - Micronesia (%)
Place of birth for the foreign-born population - Bahamas (%)
Place of birth for the foreign-born population - Barbados (%)
Place of birth for the foreign-born population - Cuba (%)
Place of birth for the foreign-born population - Dominica (%)
Place of birth for the foreign-born population - Dominican Republic (%)
Place of birth for the foreign-born population - Grenada (%)
Place of birth for the foreign-born population - Haiti (%)
Place of birth for the foreign-born population - Jamaica (%)
Place of birth for the foreign-born population - St. Vincent and the Grenadines (%)
Place of birth for the foreign-born population - Trinidad and Tobago (%)
Place of birth for the foreign-born population - West Indies (%)
Place of birth for the foreign-born population - Other Caribbean (%)
Place of birth for the foreign-born population - Belize (%)
Place of birth for the foreign-born population - Costa Rica (%)
Place of birth for the foreign-born population - El Salvador (%)
Place of birth for the foreign-born population - Guatemala (%)
Place of birth for the foreign-born population - Honduras (%)
Place of birth for the foreign-born population - Mexico (%)
Place of birth for the foreign-born population - Nicaragua (%)
Place of birth for the foreign-born population - Panama (%)
Place of birth for the foreign-born population - Other Central America (%)
Place of birth for the foreign-born population - Argentina (%)
Place of birth for the foreign-born population - Bolivia (%)
Place of birth for the foreign-born population - Brazil (%)
Place of birth for the foreign-born population - Chile (%)
Place of birth for the foreign-born population - Colombia (%)
Place of birth for the foreign-born population - Ecuador (%)
Place of birth for the foreign-born population - Guyana (%)
Place of birth for the foreign-born population - Peru (%)
Place of birth for the foreign-born population - Uruguay (%)
Place of birth for the foreign-born population - Venezuela (%)
Place of birth for the foreign-born population - Other South America (%)
Place of birth for the foreign-born population - Canada (%)
Place of birth for the foreign-born population - Other Northern America (%)
Place of birth for the foreign-born population - Other (%)
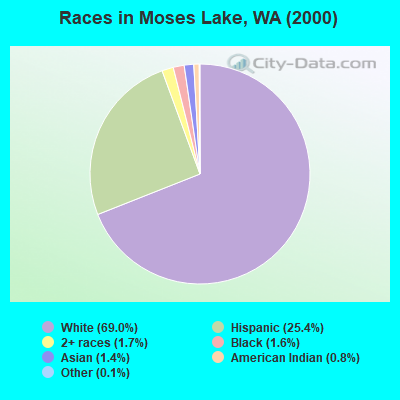
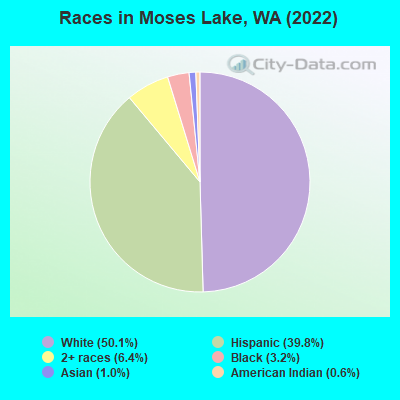
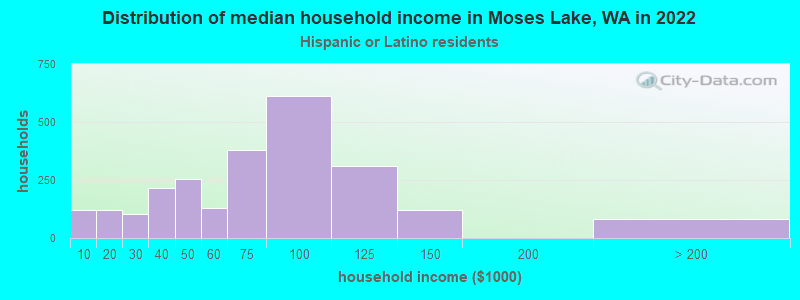
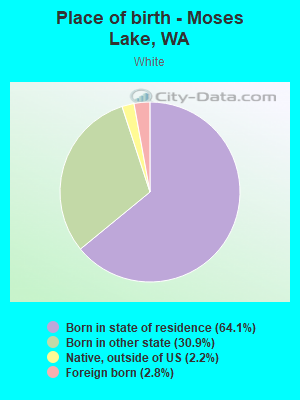
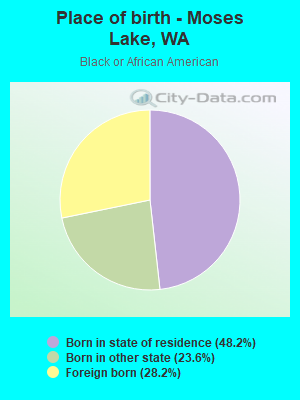
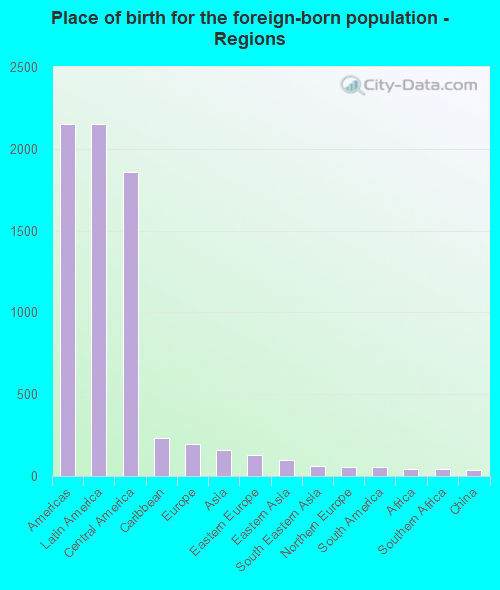
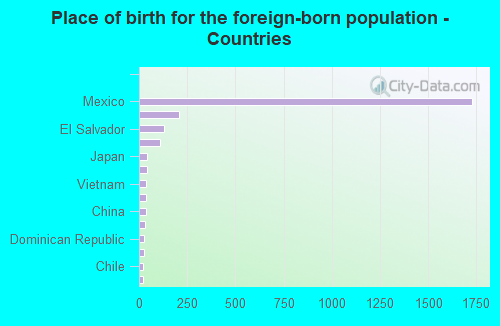
According to 2022 data, the most numerous races in Moses Lake, WA are White alone (12,873 residents), Hispanic (10,243 residents), and Asian alone (251 residents). 77.2% of Moses Lake residents speak English at home. 9.9% of Moses Lake, WA residents are foreign-born (8.2% born in Latin America), which is 51.3% less than the foreign-born rate of 15.0% across the entire state of Washington.
Race distribution in Moses Lake
2000 2022
4,652,490 78.9% White alone 441,509 7.5% Hispanic 319,401 5.4% Asian alone 184,631 3.1% Black alone 175,926 3.0% Two or more races 85,396 1.4% American Indian alone 22,779 0.4% Native Hawaiian and Other 11,989 0.2% Other race alone
4,941,456 63.5% White alone 1,093,313 14.0% Hispanic 755,832 9.7% Asian alone 523,448 6.7% Two or more races 299,537 3.8% Black alone 69,024 0.9% American Indian alone 52,231 0.7% Native Hawaiian and Other 50,945 0.7% Other race alone
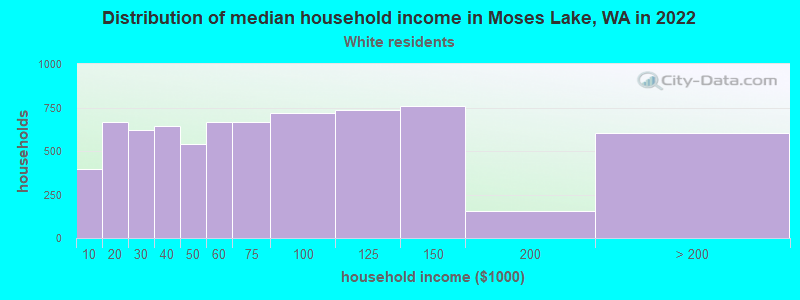
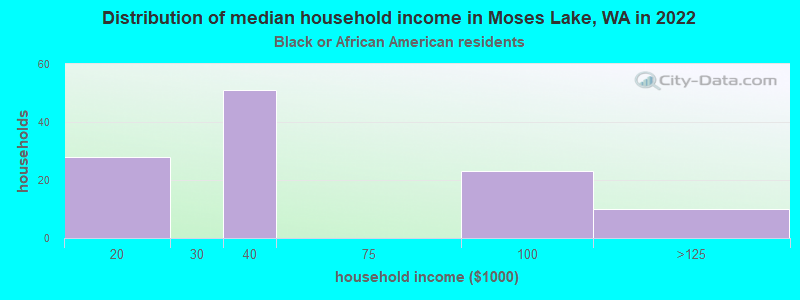
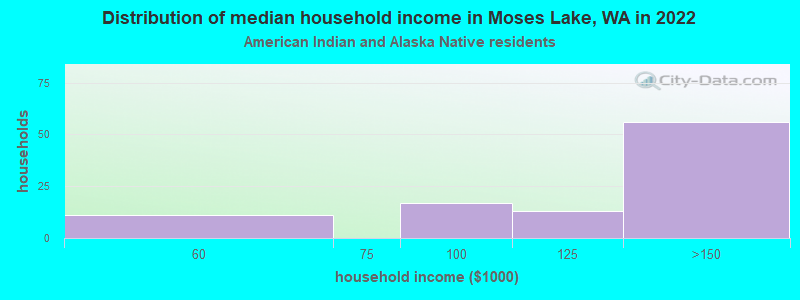
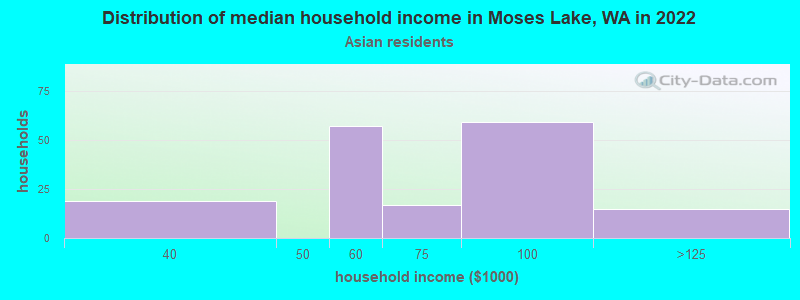
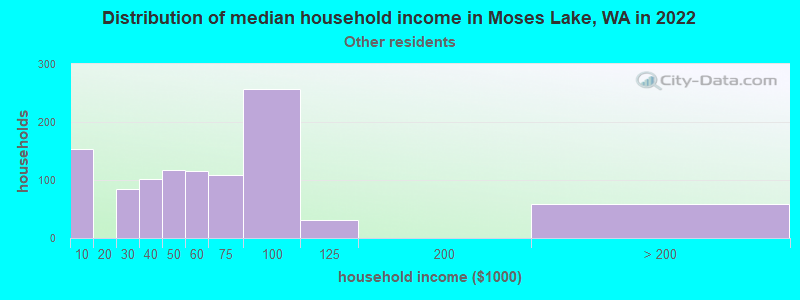
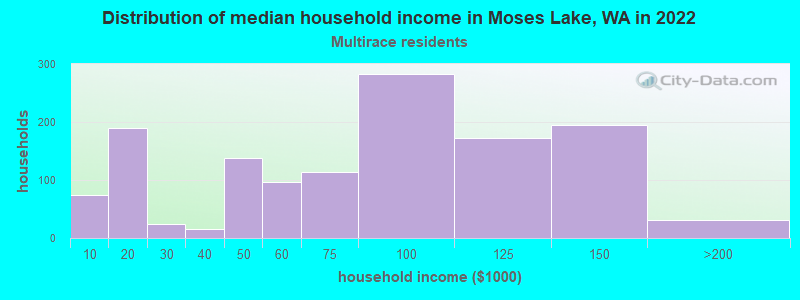
Income and house value in Moses Lake Median household income in 2022 $58,914 White non-Hispanic householders$33,818 Black householders$143,456 American Indian and Alaska Native householders$66,972 Asian householders$65,859 Some other race householders$79,021 Two or more races householders$72,643 Hispanic or Latino race householdersMedian 2022 house value $312,591 White Non-Hispanic householders$245,947 Black or African American householders$269,748 American Indian or Alaska Native householders $311,956 Asian householders$259,276 Some other race householders$248,168 Two or more races householders$265,623 Hispanic or Latino householders
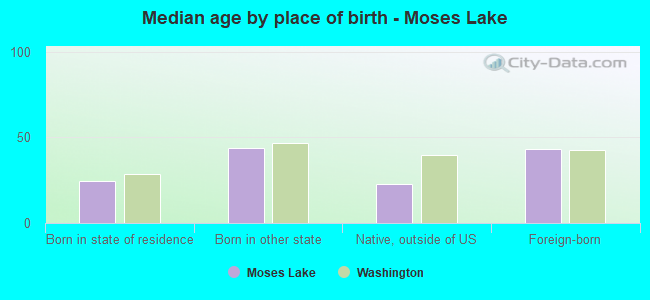
Median age by race in Moses Lake
33.7 Median age for White residents33.2 34.5 26.1 Median age for Black or African American residents22.5 58.7 37.5 Median age for American Indian / Alaska Native residents45.8 33.2 25.8 Median age for Asian residents30.5 23.0 -681,388,011.9 Median age for Native Hawaiian / Pacific Islander residents-666,666,666.0 -666,666,666.0 23.4 Median age for Other race residents22.6 26.0 32.1 Median age for Two or more races residents23.5 36.8 38.6 Median age for White alone residents39.1 38.0 23.8 Median age for Hispanic or Latino residents23.5 23.2
Owner/renter occupied households by race in Moses Lake
House owners and renters - White residents 4,326 60.9% Owner occupied2,777 39.1% Renter occupiedHouse owners and renters - Black or African American residents 11 7.4% Owner occupied133 92.6% Renter occupiedHouse owners and renters - American Indian / Alaska Native residents 23 27.8% Owner occupied59 72.2% Renter occupiedHouse owners and renters - Asian residents 98 59.9% Owner occupied65 40.1% Renter occupiedHouse owners and renters - Other race residents 579 73.5% Owner occupied209 26.5% Renter occupiedHouse owners and renters - Two or more races residents 1,092 68.1% Owner occupied512 31.9% Renter occupiedHouse owners and renters - White alone residents 3,976 60.1% Owner occupied2,636 39.9% Renter occupiedHouse owners and renters - Hispanic or Latino residents 1,501 63.1% Owner occupied877 36.9% Renter occupied
Language usage in Moses Lake
English speakers - Total 77.2% of residents of Moses Lake speak English at home.
23.0% of residents speak Spanish at home 3,765 68.4% Speak English very well1,743 31.6% Speak English less than very well1.8% of residents speak other language at home 280 64.4% Speak English very well155 35.6% Speak English less than very well
English speakers - Born in the United States 79.0% of residents of Moses Lake speak English at home.
20.1% of residents speak Spanish at home 1,193 82.6% Speak English very well251 17.4% Speak English less than very well0.3% of residents speak other language at home 22 100.0% Speak English very well
English speakers - Native, born elsewhere 40.9% of residents of Moses Lake speak English at home.
7.0% of residents speak Spanish at home 26 100.0% Speak English less than very well52.1% of residents speak other language at home 195 100.0% Speak English very well
English speakers - Foreign-born 18.7% of residents of Moses Lake speak English at home.
72.1% of residents speak Spanish at home 793 47.3% Speak English very well882 52.7% Speak English less than very well8.1% of residents speak other language at home 21 11.1% Speak English very well168 88.9% Speak English less than very well
White (Caucasian) - Speak only English Native:
93.6% (13,459)Foreign-born:
36.9% (168)
White (Caucasian) - Speak another language Native:
5.4% (782)Foreign-born:
62.9% (287)
Black or African American - Speak only English Native:
100.0% (569)Foreign-born:
98.2% (233)
Asian - Speak only English Native:
98.3% (110)Foreign-born:
20.6% (33)
Other race - Speak only English Native:
28.0% (689)Foreign-born:
4.4% (34)
Other race - Speak another language Native:
66.0% (1,624)Foreign-born:
95.9% (739)
Two or more races - Speak another language Native:
29.8% (1,390)Foreign-born:
98.4% (1,042)
White alone - Speak only English Native:
99.3% (12,104)Foreign-born:
85.8% (120)
White alone - Speak another language Native:
2.4% (288)Foreign-born:
74.9% (104)
Hispanic or Latino - Speak only English Native:
54.0% (4,032)Foreign-born:
5.1% (93)
Hispanic or Latino - Speak another language Native:
50.1% (3,737)Foreign-born:
94.7% (1,736)
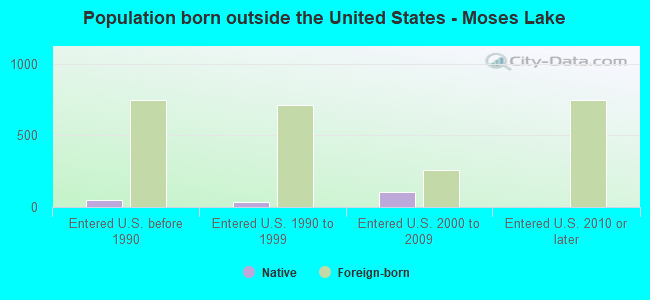
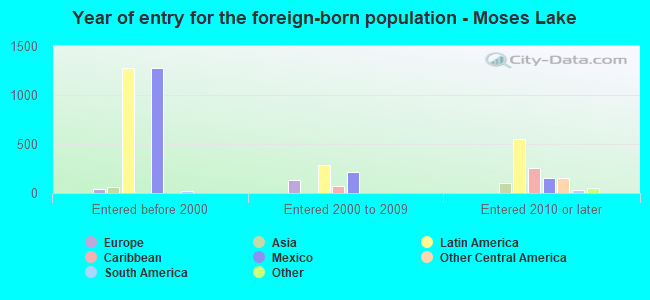
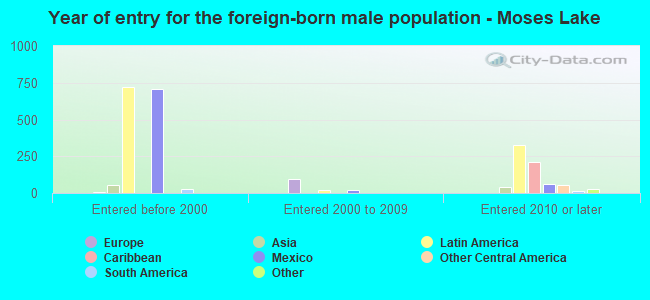
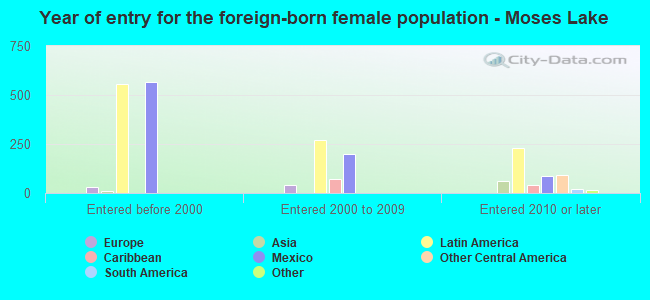
Foreign-born residents in Moses Lake 2,548 residents are foreign born (8.2% Latin America ).
This city:
9.9%Washington:
14.9%
Marital status for residents in Moses Lake Marital status - White (Caucasian) population 15 years and over
Males 33.7% Never married47.0% Now married0.0% Separated3.6% Widowed15.6% DivorcedFemales 32.6% Never married38.0% Now married2.0% Separated14.5% Widowed13.0% DivorcedWomen who gave birth in the past 12 months Now married:
28.9% (81)Unmarried:
71.1% (200)
Women who did not give birth in the past 12 months Now married:
40.3% (1,582)Unmarried:
59.7% (2,340)
Marital status - Black or African American population 15 years and over
Males 60.2% Never married39.8% Now married0.0% Separated0.0% Widowed0.0% DivorcedFemales 31.9% Never married26.6% Now married32.5% Separated0.0% Widowed9.0% DivorcedWomen who did not give birth in the past 12 months Now married:
9.6% (11)Unmarried:
90.4% (103)
Marital status - American Indian / Alaska Native population 15 years and over
Males 56.3% Never married27.2% Now married0.0% Separated5.8% Widowed10.7% DivorcedFemales 62.5% Never married25.0% Now married0.0% Separated12.5% Widowed0.0% DivorcedWomen who did not give birth in the past 12 months Now married:
17.8% (15)Unmarried:
82.2% (71)
Marital status - Asian population 15 years and over
Males 35.7% Never married64.3% Now married0.0% Separated0.0% Widowed0.0% DivorcedFemales 50.5% Never married24.2% Now married0.0% Separated25.3% Widowed0.0% DivorcedWomen who did not give birth in the past 12 months Now married:
32.4% (26)Unmarried:
67.6% (55)
Marital status - Other race population 15 years and over
Males 58.4% Never married39.4% Now married0.0% Separated2.2% Widowed0.0% DivorcedFemales 43.3% Never married32.2% Now married2.9% Separated10.7% Widowed10.9% DivorcedWomen who gave birth in the past 12 months Now married:
52.8% (18)Unmarried:
47.2% (16)
Women who did not give birth in the past 12 months Now married:
35.2% (310)Unmarried:
64.8% (570)
Marital status - Two or more races population 15 years and over
Males 48.5% Never married39.8% Now married2.7% Separated0.0% Widowed8.9% DivorcedFemales 53.2% Never married27.6% Now married0.7% Separated0.0% Widowed18.4% DivorcedWomen who gave birth in the past 12 months Now married:
29.5% (27)Unmarried:
70.5% (64)
Women who did not give birth in the past 12 months Now married:
25.3% (501)Unmarried:
74.7% (1,477)
Marital status - White alone, not Hispanic / Latino population 15 years and over
Males 34.1% Never married44.6% Now married0.0% Separated4.1% Widowed17.2% DivorcedFemales 29.6% Never married37.3% Now married2.4% Separated16.5% Widowed14.3% DivorcedWomen who gave birth in the past 12 months Now married:
68.3% (88)Unmarried:
31.7% (41)
Women who did not give birth in the past 12 months Now married:
36.8% (1,230)Unmarried:
63.2% (2,113)
Marital status - Hispanic or Latino population 15 years and over
Males 45.8% Never married49.3% Now married0.9% Separated1.3% Widowed2.7% DivorcedFemales 46.5% Never married35.2% Now married1.0% Separated4.7% Widowed12.5% DivorcedWomen who gave birth in the past 12 months Now married:
7.7% (20)Unmarried:
92.3% (241)
Women who did not give birth in the past 12 months Now married:
37.1% (1,073)Unmarried:
62.9% (1,822)
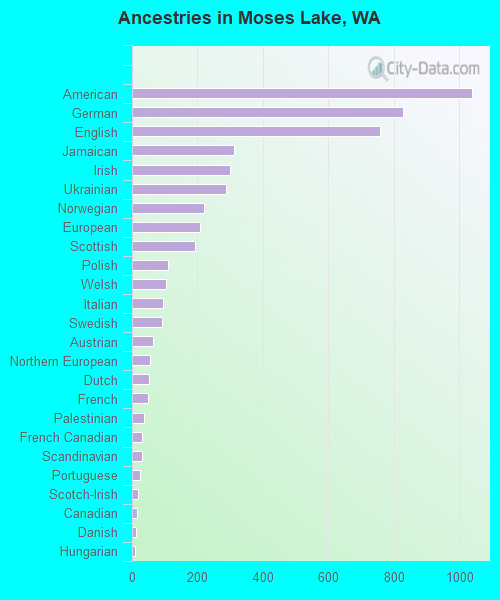
Ancestries in Moses Lake
1,039 7.2% American829 5.8% German758 5.3% English313 2.2% Jamaican300 2.1% Irish288 2.0% Ukrainian219 1.5% Norwegian207 1.4% European194 1.3% Scottish109 0.8% Polish105 0.7% Welsh94 0.7% Italian93 0.6% Swedish64 0.4% Austrian56 0.4% Northern European52 0.4% Dutch48 0.3% French37 0.3% Palestinian32 0.2% French Canadian31 0.2% Scandinavian23 0.2% Portuguese18 0.1% Scotch-Irish15 0.1% Canadian13 0.09% Danish10 0.07% Hungarian7 0.05% Eastern European
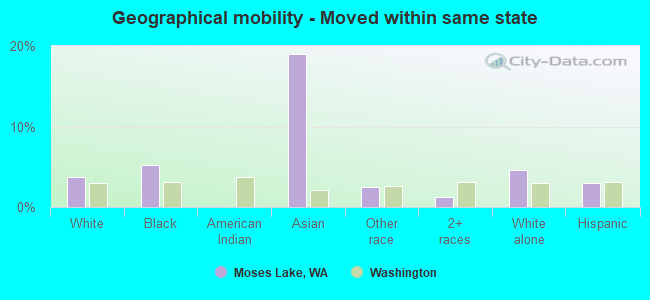
Geographical mobility in Moses Lake Same house 1 year ago 13,824 87.2% White (Caucasian)751 90.3% Black or African American327 100.0% American Indian / Alaska Native123 44.4% Asian2,101 61.4% Other race4,035 85.2% Two or more races10,920 84.9% White alone, not Hispanic / Latino8,025 80.2% Hispanic or LatinoMoved within same county 1,031 6.5% White / Caucasian23 2.8% Black or African American4 1.8% American Indian / Alaska Native22 8.0% Asian1,429 41.8% Other race329 7.0% Two or more races948 7.4% White alone, not Hispanic / Latino1,839 18.4% Hispanic or LatinoMoved within same state 586 3.7% White / Caucasian43 5.2% Black or African American52 19.0% Asian84 2.5% Other race59 1.2% Two or more races589 4.6% White alone, not Hispanic / Latino302 3.0% Hispanic or LatinoMoved from different state 312 2.0% White / Caucasian24 2.8% Black or African American21 7.7% Asian5 0.1% Other race313 6.6% Two or more races312 2.4% White alone, not Hispanic / Latino489 4.9% Hispanic or LatinoMoved from abroad 2 0.2% Black or African American60 21.8% Asian
Children Nativity (place of birth) in Moses Lake
Children under 6 years - Living with two parents Both parents native 1,003 100.0% NativeBoth parents foreign-born 7 100.0% Foreign-bornOne native, one foreign-born parent 251 100.0% NativeChildren under 6 years - Living with one parent Native parent 400 100.0% NativeForeign-born parent 72 100.0% NativeChildren 6 to 17 years - Living with two parents Both parents native 2,938 100.0% NativeBoth parents foreign-born 385 96.0% Native16 4.0% Foreign-bornOne native, one foreign-born parent 722 92.7% Native57 7.3% Foreign-bornChildren 6 to 17 years - Living with one parent Native parent 984 100.0% NativeForeign-born parent 240 52.7% Native215 47.3% Foreign-born
Grandparents responsible for own grandchildren in Moses Lake
Grandparents (30 to 59 years) White / Caucasian 29 18.1% Responsible for grandchildren129 81.9% Not responsible for grandchildrenOther race 166 62.6% Responsible for grandchildren99 37.4% Not responsible for grandchildrenTwo or more races 85 100.0% Not responsible for grandchildrenWhite alone, not Hispanic / Latino 28 16.5% Responsible for grandchildren143 83.5% Not responsible for grandchildrenHispanic or Latino 229 67.2% Responsible for grandchildren112 32.8% Not responsible for grandchildrenGrandparents (60 years and over) White / Caucasian 64 38.5% Responsible for grandchildren102 61.5% Not responsible for grandchildrenTwo or more races 81 100.0% Not responsible for grandchildrenWhite alone, not Hispanic / Latino 65 38.1% Responsible for grandchildren105 61.9% Not responsible for grandchildrenHispanic or Latino 57 100.0% Not responsible for grandchildren