Races in Miramar, Florida (FL) Detailed Stats
Data:
Races - White alone (%)
Races - White alone (% change since 2000)
Races - Black alone (%)
Races - Black alone (% change since 2000)
Races - American Indian alone (%)
Races - American Indian alone (% change since 2000)
Races - Asian alone (%)
Races - Asian alone (% change since 2000)
Races - Hispanic (%)
Races - Hispanic (% change since 2000)
Races - Native Hawaiian and Other Pacific Islander alone (%)
Races - Native Hawaiian and Other Pacific Islander alone (% change since 2000)
Races - Two or more races(%)
Races - Two or more races(% change since 2000)
Races - Other race alone (%)
Races - Other race alone (% change since 2000)
Racial diversity
Place of birth - Born in state of residence (%)
Place of birth - Born in state of residence (%) - White
Place of birth - Born in state of residence (%) - Black or African American
Place of birth - Born in state of residence (%) - Asian
Place of birth - Born in state of residence (%) - Hispanic or Latino
Place of birth - Born in state of residence (%) - American Indian and Alaska Native
Place of birth - Born in state of residence (%) - Multirace
Place of birth - Born in state of residence (%) - Other Race
Place of birth - Born in other state (%)
Place of birth - Born in other state (%) - White
Place of birth - Born in other state (%) - Black or African American
Place of birth - Born in other state (%) - Asian
Place of birth - Born in other state (%) - Hispanic or Latino
Place of birth - Born in other state (%) - American Indian and Alaska Native
Place of birth - Born in other state (%) - Multirace
Place of birth - Born in other state (%) - Other Race
Place of birth - Native, outside of US (%)
Place of birth - Native, outside of US (%) - White
Place of birth - Native, outside of US (%) - Black or African American
Place of birth - Native, outside of US (%) - Asian
Place of birth - Native, outside of US (%) - Hispanic or Latino
Place of birth - Native, outside of US (%) - American Indian and Alaska Native
Place of birth - Native, outside of US (%) - Multirace
Place of birth - Native, outside of US (%) - Other Race
Place of birth - Foreign born (%)
Place of birth - Foreign born (%) - White
Place of birth - Foreign born (%) - Black or African American
Place of birth - Foreign born (%) - Asian
Place of birth - Foreign born (%) - Hispanic or Latino
Place of birth - Foreign born (%) - American Indian and Alaska Native
Place of birth - Foreign born (%) - Multirace
Place of birth - Foreign born (%) - Other Race
Residents speaking English at home (%)
Residents speaking English at home - Born in the United States (%)
Residents speaking English at home - Native, born elsewhere (%)
Residents speaking English at home - Foreign born (%)
Residents speaking Spanish at home (%)
Residents speaking Spanish at home - Born in the United States (%)
Residents speaking Spanish at home - Native, born elsewhere (%)
Residents speaking Spanish at home - Foreign born (%)
Residents speaking other language at home (%)
Residents speaking other language at home - Born in the United States (%)
Residents speaking other language at home - Native, born elsewhere (%)
Residents speaking other language at home - Foreign born (%)
Marital status - Never married (%)
Marital status - Now married (%)
Marital status - Separated (%)
Marital status - Widowed (%)
Marital status - Divorced (%)
Ancestries Reported - Arab (%)
Ancestries Reported - Czech (%)
Ancestries Reported - Danish (%)
Ancestries Reported - Dutch (%)
Ancestries Reported - English (%)
Ancestries Reported - French (%)
Ancestries Reported - French Canadian (%)
Ancestries Reported - German (%)
Ancestries Reported - Greek (%)
Ancestries Reported - Hungarian (%)
Ancestries Reported - Irish (%)
Ancestries Reported - Italian (%)
Ancestries Reported - Lithuanian (%)
Ancestries Reported - Norwegian (%)
Ancestries Reported - Polish (%)
Ancestries Reported - Portuguese (%)
Ancestries Reported - Russian (%)
Ancestries Reported - Scotch-Irish (%)
Ancestries Reported - Scottish (%)
Ancestries Reported - Slovak (%)
Ancestries Reported - Subsaharan African (%)
Ancestries Reported - Swedish (%)
Ancestries Reported - Swiss (%)
Ancestries Reported - Ukrainian (%)
Ancestries Reported - United States (%)
Ancestries Reported - Welsh (%)
Ancestries Reported - West Indian (%)
Ancestries Reported - Other (%)
Geographical mobility - Same house 1 year ago (%)
Geographical mobility - Same house 1 year ago (%) - White
Geographical mobility - Same house 1 year ago (%) - Black or African American
Geographical mobility - Same house 1 year ago (%) - Asian
Geographical mobility - Same house 1 year ago (%) - Hispanic or Latino
Geographical mobility - Same house 1 year ago (%) - American Indian and Alaska Native
Geographical mobility - Same house 1 year ago (%) - Multirace
Geographical mobility - Same house 1 year ago (%) - Other Race
Geographical mobility - Moved within same county (%)
Geographical mobility - Moved within same county (%) - White
Geographical mobility - Moved within same county (%) - Black or African American
Geographical mobility - Moved within same county (%) - Asian
Geographical mobility - Moved within same county (%) - Hispanic or Latino
Geographical mobility - Moved within same county (%) - American Indian and Alaska Native
Geographical mobility - Moved within same county (%) - Multirace
Geographical mobility - Moved within same county (%) - Other Race
Geographical mobility - Moved from different county within same state (%)
Geographical mobility - Moved from different county within same state (%) - White
Geographical mobility - Moved from different county within same state (%) - Black or African American
Geographical mobility - Moved from different county within same state (%) - Asian
Geographical mobility - Moved from different county within same state (%) - Hispanic or Latino
Geographical mobility - Moved from different county within same state (%) - American Indian and Alaska Native
Geographical mobility - Moved from different county within same state (%) - Multirace
Geographical mobility - Moved from different county within same state (%) - Other Race
Geographical mobility - Moved from different state (%)
Geographical mobility - Moved from different state (%) - White
Geographical mobility - Moved from different state (%) - Black or African American
Geographical mobility - Moved from different state (%) - Asian
Geographical mobility - Moved from different state (%) - Hispanic or Latino
Geographical mobility - Moved from different state (%) - American Indian and Alaska Native
Geographical mobility - Moved from different state (%) - Multirace
Geographical mobility - Moved from different state (%) - Other Race
Geographical mobility - Moved from abroad (%)
Geographical mobility - Moved from abroad (%) - White
Geographical mobility - Moved from abroad (%) - Black or African American
Geographical mobility - Moved from abroad (%) - Asian
Geographical mobility - Moved from abroad (%) - Hispanic or Latino
Geographical mobility - Moved from abroad (%) - American Indian and Alaska Native
Geographical mobility - Moved from abroad (%) - Multirace
Geographical mobility - Moved from abroad (%) - Other Race
Place of birth for the foreign-born population - Ireland (%)
Place of birth for the foreign-born population - Denmark (%)
Place of birth for the foreign-born population - Norway (%)
Place of birth for the foreign-born population - Sweden (%)
Place of birth for the foreign-born population - United Kingdom (%)
Place of birth for the foreign-born population - England (%)
Place of birth for the foreign-born population - Scotland (%)
Place of birth for the foreign-born population - Other Northern Europe (%)
Place of birth for the foreign-born population - Austria (%)
Place of birth for the foreign-born population - Belgium (%)
Place of birth for the foreign-born population - France (%)
Place of birth for the foreign-born population - Germany (%)
Place of birth for the foreign-born population - Netherlands (%)
Place of birth for the foreign-born population - Switzerland (%)
Place of birth for the foreign-born population - Other Western Europe (%)
Place of birth for the foreign-born population - Greece (%)
Place of birth for the foreign-born population - Italy (%)
Place of birth for the foreign-born population - Portugal (%)
Place of birth for the foreign-born population - Spain (%)
Place of birth for the foreign-born population - Other Southern Europe (%)
Place of birth for the foreign-born population - Albania (%)
Place of birth for the foreign-born population - Belarus (%)
Place of birth for the foreign-born population - Bosnia and Herzegovina (%)
Place of birth for the foreign-born population - Bulgaria (%)
Place of birth for the foreign-born population - Croatia (%)
Place of birth for the foreign-born population - Czechoslovakia (%)
Place of birth for the foreign-born population - Hungary (%)
Place of birth for the foreign-born population - Latvia (%)
Place of birth for the foreign-born population - Lithuania (%)
Place of birth for the foreign-born population - North Macedonia (Macedonia) (%)
Place of birth for the foreign-born population - Moldova (%)
Place of birth for the foreign-born population - Poland (%)
Place of birth for the foreign-born population - Romania (%)
Place of birth for the foreign-born population - Russia (%)
Place of birth for the foreign-born population - Serbia (%)
Place of birth for the foreign-born population - Ukraine (%)
Place of birth for the foreign-born population - Other Eastern Europe (%)
Place of birth for the foreign-born population - China (%)
Place of birth for the foreign-born population - Hong Kong (%)
Place of birth for the foreign-born population - Taiwan (%)
Place of birth for the foreign-born population - Japan (%)
Place of birth for the foreign-born population - Korea (%)
Place of birth for the foreign-born population - Other Eastern Asia (%)
Place of birth for the foreign-born population - Afghanistan (%)
Place of birth for the foreign-born population - Bangladesh (%)
Place of birth for the foreign-born population - India (%)
Place of birth for the foreign-born population - Iran (%)
Place of birth for the foreign-born population - Kazakhstan (%)
Place of birth for the foreign-born population - Nepal (%)
Place of birth for the foreign-born population - Pakistan (%)
Place of birth for the foreign-born population - Sri Lanka (%)
Place of birth for the foreign-born population - Uzbekistan (%)
Place of birth for the foreign-born population - Other South Central Asia (%)
Place of birth for the foreign-born population - Burma (%)
Place of birth for the foreign-born population - Cambodia (%)
Place of birth for the foreign-born population - Indonesia (%)
Place of birth for the foreign-born population - Laos (%)
Place of birth for the foreign-born population - Malaysia (%)
Place of birth for the foreign-born population - Philippines (%)
Place of birth for the foreign-born population - Singapore (%)
Place of birth for the foreign-born population - Thailand (%)
Place of birth for the foreign-born population - Vietnam (%)
Place of birth for the foreign-born population - Other South Eastern Asia (%)
Place of birth for the foreign-born population - Armenia (%)
Place of birth for the foreign-born population - Iraq (%)
Place of birth for the foreign-born population - Israel (%)
Place of birth for the foreign-born population - Jordan (%)
Place of birth for the foreign-born population - Kuwait (%)
Place of birth for the foreign-born population - Lebanon (%)
Place of birth for the foreign-born population - Saudi Arabia (%)
Place of birth for the foreign-born population - Syria (%)
Place of birth for the foreign-born population - Turkey (%)
Place of birth for the foreign-born population - Yemen (%)
Place of birth for the foreign-born population - Other Western Asia (%)
Place of birth for the foreign-born population - Eritrea (%)
Place of birth for the foreign-born population - Ethiopia (%)
Place of birth for the foreign-born population - Kenya (%)
Place of birth for the foreign-born population - Somalia (%)
Place of birth for the foreign-born population - Uganda (%)
Place of birth for the foreign-born population - Zimbabwe (%)
Place of birth for the foreign-born population - Other Eastern Africa (%)
Place of birth for the foreign-born population - Cameroon (%)
Place of birth for the foreign-born population - Congo (%)
Place of birth for the foreign-born population - Democratic Republic of Congo (Zaire) (%)
Place of birth for the foreign-born population - Other Middle Africa (%)
Place of birth for the foreign-born population - Egypt (%)
Place of birth for the foreign-born population - Morocco (%)
Place of birth for the foreign-born population - Sudan (%)
Place of birth for the foreign-born population - Other Northern Africa (%)
Place of birth for the foreign-born population - South Africa (%)
Place of birth for the foreign-born population - Other Southern Africa (%)
Place of birth for the foreign-born population - Cabo Verde (%)
Place of birth for the foreign-born population - Ghana (%)
Place of birth for the foreign-born population - Liberia (%)
Place of birth for the foreign-born population - Nigeria (%)
Place of birth for the foreign-born population - Senegal (%)
Place of birth for the foreign-born population - Sierra Leone (%)
Place of birth for the foreign-born population - Other Western Africa (%)
Place of birth for the foreign-born population - Australia (%)
Place of birth for the foreign-born population - New Zealand (%)
Place of birth for the foreign-born population - Fiji (%)
Place of birth for the foreign-born population - Micronesia (%)
Place of birth for the foreign-born population - Bahamas (%)
Place of birth for the foreign-born population - Barbados (%)
Place of birth for the foreign-born population - Cuba (%)
Place of birth for the foreign-born population - Dominica (%)
Place of birth for the foreign-born population - Dominican Republic (%)
Place of birth for the foreign-born population - Grenada (%)
Place of birth for the foreign-born population - Haiti (%)
Place of birth for the foreign-born population - Jamaica (%)
Place of birth for the foreign-born population - St. Vincent and the Grenadines (%)
Place of birth for the foreign-born population - Trinidad and Tobago (%)
Place of birth for the foreign-born population - West Indies (%)
Place of birth for the foreign-born population - Other Caribbean (%)
Place of birth for the foreign-born population - Belize (%)
Place of birth for the foreign-born population - Costa Rica (%)
Place of birth for the foreign-born population - El Salvador (%)
Place of birth for the foreign-born population - Guatemala (%)
Place of birth for the foreign-born population - Honduras (%)
Place of birth for the foreign-born population - Mexico (%)
Place of birth for the foreign-born population - Nicaragua (%)
Place of birth for the foreign-born population - Panama (%)
Place of birth for the foreign-born population - Other Central America (%)
Place of birth for the foreign-born population - Argentina (%)
Place of birth for the foreign-born population - Bolivia (%)
Place of birth for the foreign-born population - Brazil (%)
Place of birth for the foreign-born population - Chile (%)
Place of birth for the foreign-born population - Colombia (%)
Place of birth for the foreign-born population - Ecuador (%)
Place of birth for the foreign-born population - Guyana (%)
Place of birth for the foreign-born population - Peru (%)
Place of birth for the foreign-born population - Uruguay (%)
Place of birth for the foreign-born population - Venezuela (%)
Place of birth for the foreign-born population - Other South America (%)
Place of birth for the foreign-born population - Canada (%)
Place of birth for the foreign-born population - Other Northern America (%)
Place of birth for the foreign-born population - Other (%)
Latest news about races in Miramar, FL collected exclusively by city-data.com from local newspapers, TV, and radio stations
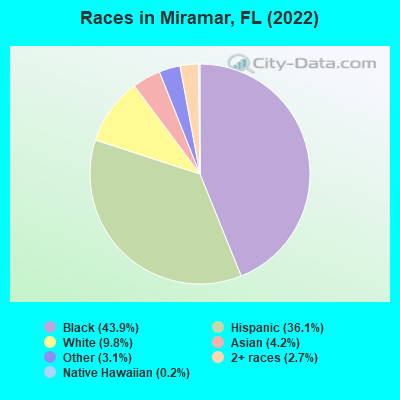
According to 2022 data, the most numerous races in Miramar, FL are White alone (13,458 residents), Hispanic (49,474 residents), and Black alone (60,241 residents). 50.2% of Miramar residents speak English at home. 41.0% of Miramar, FL residents are foreign-born (34.0% born in Latin America), which is 48.8% greater than the foreign-born rate of 21.0% across the entire state of Florida.
Race distribution in Miramar
2000 2022
30,561 42.0% Black alone 21,374 29.4% Hispanic 15,716 21.6% White alone 2,312 3.2% Two or more races 2,171 3.0% Asian alone 452 0.6% Other race alone 84 0.1% American Indian alone 69 0.09% Native Hawaiian and Other
60,241 43.9% Black alone 49,474 36.1% Hispanic 13,458 9.8% White alone 5,763 4.2% Asian alone 4,268 3.1% Other race alone 3,668 2.7% Two or more races 235 0.2% Native Hawaiian and Other 101 0.07% American Indian alone
2000 2022
10,458,509 65.4% White alone 2,682,715 16.8% Hispanic 2,264,268 14.2% Black alone 261,693 1.6% Asian alone 236,954 1.5% Two or more races 42,358 0.3% American Indian alone 28,994 0.2% Other race alone 6,887 0.04% Native Hawaiian and Other
11,309,403 50.8% White alone 6,025,039 27.1% Hispanic 3,241,015 14.6% Black alone 861,630 3.9% Two or more races 623,692 2.8% Asian alone 152,054 0.7% Other race alone 22,504 0.1% American Indian alone 9,486 0.04% Native Hawaiian and Other
Income and house value in Miramar Median household income in 2022 $90,508 White non-Hispanic householders$74,917 Black householders$86,329 Asian householders$83,602 Some other race householders$84,079 Two or more races householders$86,118 Hispanic or Latino race householdersMedian 2022 house value $425,960 White Non-Hispanic householders$425,576 Black or African American householders$602,100 American Indian or Alaska Native householders $505,012 Asian householders$143,905 Native Hawaiian and other Pacific Islander householders$442,844 Some other race householders$435,937 Two or more races householders$518,443 Hispanic or Latino householders
Median age by race in Miramar
38.5 Median age for White residents41.3 37.7 37.8 Median age for Black or African American residents37.6 39.0 -666,666,666.0 Median age for American Indian / Alaska Native residents-666,666,666.0 -666,666,666.0 49.4 Median age for Asian residents43.4 49.9 18.9 Median age for Native Hawaiian / Pacific Islander residents-666,666,666.0 -666,666,666.0 33.9 Median age for Other race residents34.7 33.6 47.2 Median age for Two or more races residents46.4 48.8 33.4 Median age for White alone residents40.2 33.3 44.1 Median age for Hispanic or Latino residents44.5 42.9
Owner/renter occupied households by race in Miramar
House owners and renters - White residents 6,246 66.7% Owner occupied3,115 33.3% Renter occupiedHouse owners and renters - Black or African American residents 10,456 55.5% Owner occupied8,387 44.5% Renter occupiedHouse owners and renters - American Indian / Alaska Native residents 106 57.2% Owner occupied79 42.8% Renter occupiedHouse owners and renters - Asian residents 1,517 67.0% Owner occupied746 33.0% Renter occupiedHouse owners and renters - Native Hawaiian / Pacific Islander residents 26 100.0% Owner occupiedHouse owners and renters - Other race residents 2,303 71.7% Owner occupied909 28.3% Renter occupiedHouse owners and renters - Two or more races residents 7,435 66.5% Owner occupied3,747 33.5% Renter occupiedHouse owners and renters - White alone residents 3,337 81.6% Owner occupied751 18.4% Renter occupiedHouse owners and renters - Hispanic or Latino residents 10,809 64.1% Owner occupied6,046 35.9% Renter occupied
Language usage in Miramar
English speakers - Total 50.2% of residents of Miramar speak English at home.
34.6% of residents speak Spanish at home 28,422 63.4% Speak English very well16,425 36.6% Speak English less than very well15.1% of residents speak other language at home 13,442 68.7% Speak English very well6,138 31.3% Speak English less than very well
English speakers - Born in the United States 78.2% of residents of Miramar speak English at home.
11.6% of residents speak Spanish at home 1,347 71.7% Speak English very well532 28.3% Speak English less than very well10.2% of residents speak other language at home 1,664 100.0% Speak English very well
English speakers - Native, born elsewhere 14.8% of residents of Miramar speak English at home.
79.1% of residents speak Spanish at home 2,517 85.6% Speak English very well423 14.4% Speak English less than very well6.1% of residents speak other language at home 226 100.0% Speak English less than very well
English speakers - Foreign-born 26.1% of residents of Miramar speak English at home.
48.4% of residents speak Spanish at home 13,962 49.2% Speak English very well14,436 50.8% Speak English less than very well25.5% of residents speak other language at home 9,819 65.6% Speak English very well5,150 34.4% Speak English less than very well
White (Caucasian) - Speak only English Native:
52.2% (9,029)Foreign-born:
3.3% (290)
White (Caucasian) - Speak another language Native:
47.8% (8,254)Foreign-born:
96.7% (8,402)
Black or African American - Speak only English Native:
89.1% (33,915)Foreign-born:
52.1% (10,107)
Black or African American - Speak another language Native:
10.9% (4,166)Foreign-born:
47.9% (9,274)
American Indian / Alaska Native - Speak only English Native:
60.3% (167)Foreign-born:
63.1% (102)
American Indian / Alaska Native - Speak another language Native:
42.4% (117)Foreign-born:
42.9% (69)
Asian - Speak only English Native:
41.9% (283)Foreign-born:
21.1% (1,100)
Asian - Speak another language Native:
58.1% (393)Foreign-born:
78.9% (4,113)
Native Hawaiian / Pacific Islander - Speak another language Native:
100.0% (10)Foreign-born:
35.2% (4)
Other race - Speak only English Native:
61.7% (2,721)Foreign-born:
31.9% (1,629)
Other race - Speak another language Native:
38.3% (1,692)Foreign-born:
68.1% (3,475)
Two or more races - Speak only English Native:
36.8% (3,678)Foreign-born:
10.9% (2,212)
Two or more races - Speak another language Native:
63.2% (6,304)Foreign-born:
89.1% (18,049)
White alone - Speak only English Native:
75.9% (8,176)Foreign-born:
3.0% (49)
White alone - Speak another language Native:
24.1% (2,594)Foreign-born:
97.0% (1,575)
Hispanic or Latino - Speak only English Native:
26.5% (4,852)Foreign-born:
6.2% (1,787)
Hispanic or Latino - Speak another language Native:
73.5% (13,427)Foreign-born:
93.8% (26,913)
Foreign-born residents in Miramar 55,563 residents are foreign born (34.0% Latin America ).
This city:
41.0%Florida:
21.1%
Marital status for residents in Miramar Marital status - White (Caucasian) population 15 years and over
Males 53.8% Never married39.2% Now married0.2% Separated1.8% Widowed5.0% DivorcedFemales 58.6% Never married26.4% Now married4.9% Separated4.6% Widowed5.5% DivorcedWomen who gave birth in the past 12 months Now married:
85.3% (121)Unmarried:
14.7% (21)
Women who did not give birth in the past 12 months Now married:
41.7% (3,167)Unmarried:
58.3% (4,421)
Marital status - Black or African American population 15 years and over
Males 47.4% Never married42.3% Now married2.0% Separated1.0% Widowed7.3% DivorcedFemales 45.9% Never married34.0% Now married4.6% Separated2.7% Widowed12.7% DivorcedWomen who gave birth in the past 12 months Now married:
77.9% (293)Unmarried:
22.1% (83)
Women who did not give birth in the past 12 months Now married:
31.0% (4,637)Unmarried:
69.0% (10,330)
Marital status - American Indian / Alaska Native population 15 years and over
Males 34.7% Never married46.5% Now married3.3% Separated0.0% Widowed15.5% DivorcedFemales 27.3% Never married55.5% Now married0.0% Separated6.4% Widowed10.9% DivorcedWomen who did not give birth in the past 12 months Now married:
78.2% (100)Unmarried:
21.8% (28)
Marital status - Asian population 15 years and over
Males 42.3% Never married57.7% Now married0.0% Separated0.0% Widowed0.0% DivorcedFemales 32.3% Never married41.3% Now married4.6% Separated5.6% Widowed16.1% DivorcedWomen who gave birth in the past 12 months Now married:
100.0% (115)Unmarried:
0.0% (0)
Women who did not give birth in the past 12 months Now married:
49.7% (1,047)Unmarried:
50.3% (1,058)
Marital status - Native Hawaiian / Pacific Islander population 15 years and over
Males 100.0% Never married0.0% Now married0.0% Separated0.0% Widowed0.0% DivorcedFemales 72.7% Never married0.0% Now married0.0% Separated0.0% Widowed27.3% DivorcedWomen who did not give birth in the past 12 months Now married:
0.0% (0)Unmarried:
100.0% (17)
Marital status - Other race population 15 years and over
Males 37.9% Never married59.0% Now married0.0% Separated2.3% Widowed0.9% DivorcedFemales 41.4% Never married41.2% Now married4.1% Separated4.3% Widowed9.0% DivorcedWomen who gave birth in the past 12 months Now married:
79.5% (311)Unmarried:
20.5% (80)
Women who did not give birth in the past 12 months Now married:
29.0% (852)Unmarried:
71.0% (2,083)
Marital status - Two or more races population 15 years and over
Males 25.3% Never married63.9% Now married1.2% Separated2.2% Widowed7.4% DivorcedFemales 18.7% Never married52.6% Now married5.4% Separated9.0% Widowed14.3% DivorcedWomen who gave birth in the past 12 months Now married:
100.0% (462)Unmarried:
0.0% (0)
Women who did not give birth in the past 12 months Now married:
57.0% (3,541)Unmarried:
43.0% (2,670)
Marital status - White alone, not Hispanic / Latino population 15 years and over
Males 61.7% Never married31.7% Now married0.4% Separated3.5% Widowed2.8% DivorcedFemales 51.3% Never married29.2% Now married11.2% Separated4.9% Widowed3.4% DivorcedWomen who gave birth in the past 12 months Now married:
79.6% (98)Unmarried:
20.4% (25)
Women who did not give birth in the past 12 months Now married:
36.6% (1,079)Unmarried:
63.4% (1,870)
Marital status - Hispanic or Latino population 15 years and over
Males 30.9% Never married60.0% Now married0.5% Separated1.5% Widowed7.1% DivorcedFemales 36.8% Never married42.4% Now married3.5% Separated5.6% Widowed11.7% DivorcedWomen who gave birth in the past 12 months Now married:
91.4% (853)Unmarried:
8.6% (80)
Women who did not give birth in the past 12 months Now married:
37.3% (5,131)Unmarried:
62.7% (8,635)
Ancestries in Miramar
12,805 13.5% Jamaican12,644 13.4% Haitian9,463 10.0% American877 0.9% Italian686 0.7% Trinidadian and Tobagonian630 0.7% English545 0.6% German426 0.5% Belizean310 0.3% Nigerian308 0.3% Guyanese305 0.3% Israeli299 0.3% African286 0.3% Bahamian265 0.3% Irish263 0.3% British West Indian255 0.3% Polish237 0.3% Brazilian235 0.2% Dutch215 0.2% U.S. Virgin Islander199 0.2% Croatian164 0.2% West Indian159 0.2% Portuguese149 0.2% Canadian135 0.1% Romanian133 0.1% Russian130 0.1% Belgian128 0.1% Ethiopian120 0.1% Barbadian101 0.1% European90 0.10% Sierra Leonean80 0.08% Turkish57 0.06% Czech56 0.06% Jordanian55 0.06% Iranian53 0.06% Eastern European48 0.05% Swedish45 0.05% Scotch-Irish43 0.05% Lebanese41 0.04% Norwegian37 0.04% Palestinian35 0.04% Greek26 0.03% French22 0.02% Northern European17 0.02% French Canadian11 0.01% Danish11 0.01% British11 0.01% Swiss
Geographical mobility in Miramar Same house 1 year ago 26,105 94.4% White (Caucasian)56,560 93.5% Black or African American645 100.0% American Indian / Alaska Native6,852 90.1% Asian30 100.0% Native Hawaiian / Pacific Islander6,854 89.0% Other race27,590 86.8% Two or more races12,149 96.0% White alone, not Hispanic / Latino43,170 87.9% Hispanic or LatinoMoved within same county 698 2.5% White / Caucasian2,555 4.2% Black or African American513 6.7% Asian189 2.5% Other race1,439 4.5% Two or more races83 0.7% White alone, not Hispanic / Latino2,261 4.6% Hispanic or LatinoMoved within same state 133 0.5% White / Caucasian1,169 1.9% Black or African American125 1.6% Asian686 8.9% Other race1,409 4.4% Two or more races162 1.3% White alone, not Hispanic / Latino2,177 4.4% Hispanic or LatinoMoved from different state 193 0.3% Black or African American28 0.4% Other race500 1.6% Two or more races202 1.6% White alone, not Hispanic / Latino190 0.4% Hispanic or LatinoMoved from abroad 724 2.6% White97 1.3% Asian93 1.2% Other race866 2.7% Two or more races186 1.5% White alone, not Hispanic / Latino1,292 2.6% Hispanic or Latino
Children Nativity (place of birth) in Miramar
Children under 6 years - Living with two parents Both parents native 859 100.0% NativeBoth parents foreign-born 2,781 100.0% NativeOne native, one foreign-born parent 974 100.0% NativeChildren under 6 years - Living with one parent Native parent 2,702 100.0% NativeForeign-born parent 917 100.0% NativeChildren 6 to 17 years - Living with two parents Both parents native 1,526 100.0% NativeBoth parents foreign-born 4,325 81.5% Native985 18.5% Foreign-bornOne native, one foreign-born parent 2,263 100.0% NativeChildren 6 to 17 years - Living with one parent Native parent 3,259 100.0% NativeForeign-born parent 5,356 53.4% Native4,675 46.6% Foreign-born
Place of birth for residents in Miramar 49,022 Americas48,795 Latin America33,809 Caribbean10,951 South America4,523 Asia4,033 Central America1,865 South Central Asia1,674 South Eastern Asia1,241 Europe775 Africa591 Eastern Asia517 Western Africa443 China379 Western Asia352 Eastern Europe314 Western Europe289 Southern Europe284 Northern Europe239 Eastern Africa227 Northern America18 Southern Africa11,414 Jamaica9,297 Haiti8,300 Cuba4,226 Colombia2,924 Venezuela1,873 Dominican Republic1,267 Trinidad and Tobago1,120 Nicaragua1,100 Honduras1,045 Philippines989 India866 Peru720 Ecuador718 Mexico610 Vietnam607 Brazil562 Argentina539 Pakistan510 Guyana455 Nigeria412 Barbados391 Bahamas354 Bolivia350 Guatemala322 China271 Panama227 Canada206 El Salvador182 Costa Rica171 Israel169 Spain161 Bangladesh160 Germany147 Japan147 St. Lucia145 United Kingdom143 Iran138 Ethiopia131 England131 Dominica126 Russia96 Tanzania91 Chile88 St. Vincent and the Grenadines85 Hong Kong82 Belize79 Poland73 Grenada72 France70 Kuwait65 Italy64 Belgium62 Sierra Leone55 Hungary54 Georgia52 Turkey52 Serbia36 Taiwan31 Yemen30 Portugal28 Romania23 Greece20 Kazakhstan19 Thailand19 Uruguay18 South Africa17 Switzerland11 Uzbekistan10 Moldova7 Norway4 Kenya
Grandparents responsible for own grandchildren in Miramar
Grandparents (30 to 59 years) White / Caucasian 9 6.6% Responsible for grandchildren126 93.4% Not responsible for grandchildrenBlack or African American 222 51.1% Responsible for grandchildren213 48.9% Not responsible for grandchildrenAsian 29 37.8% Responsible for grandchildren48 62.2% Not responsible for grandchildrenOther race 174 92.8% Responsible for grandchildren13 7.2% Not responsible for grandchildrenTwo or more races 334 34.6% Responsible for grandchildren631 65.4% Not responsible for grandchildrenWhite alone, not Hispanic / Latino 57 100.0% Not responsible for grandchildrenHispanic or Latino 218 29.4% Responsible for grandchildren524 70.6% Not responsible for grandchildrenGrandparents (60 years and over) White / Caucasian 64 10.0% Responsible for grandchildren578 90.0% Not responsible for grandchildrenBlack or African American 285 23.0% Responsible for grandchildren952 77.0% Not responsible for grandchildrenAsian 79 47.9% Responsible for grandchildren85 52.1% Not responsible for grandchildrenOther race 65 24.2% Responsible for grandchildren203 75.8% Not responsible for grandchildrenTwo or more races 98 17.8% Responsible for grandchildren452 82.2% Not responsible for grandchildrenWhite alone, not Hispanic / Latino 34 9.9% Responsible for grandchildren306 90.1% Not responsible for grandchildrenHispanic or Latino 88 9.0% Responsible for grandchildren891 91.0% Not responsible for grandchildren