Races in Mint Hill, North Carolina (NC) Detailed Stats
Data:
Races - White alone (%)
Races - White alone (% change since 2000)
Races - Black alone (%)
Races - Black alone (% change since 2000)
Races - American Indian alone (%)
Races - American Indian alone (% change since 2000)
Races - Asian alone (%)
Races - Asian alone (% change since 2000)
Races - Hispanic (%)
Races - Hispanic (% change since 2000)
Races - Native Hawaiian and Other Pacific Islander alone (%)
Races - Native Hawaiian and Other Pacific Islander alone (% change since 2000)
Races - Two or more races(%)
Races - Two or more races(% change since 2000)
Races - Other race alone (%)
Races - Other race alone (% change since 2000)
Racial diversity
Place of birth - Born in state of residence (%)
Place of birth - Born in state of residence (%) - White
Place of birth - Born in state of residence (%) - Black or African American
Place of birth - Born in state of residence (%) - Asian
Place of birth - Born in state of residence (%) - Hispanic or Latino
Place of birth - Born in state of residence (%) - American Indian and Alaska Native
Place of birth - Born in state of residence (%) - Multirace
Place of birth - Born in state of residence (%) - Other Race
Place of birth - Born in other state (%)
Place of birth - Born in other state (%) - White
Place of birth - Born in other state (%) - Black or African American
Place of birth - Born in other state (%) - Asian
Place of birth - Born in other state (%) - Hispanic or Latino
Place of birth - Born in other state (%) - American Indian and Alaska Native
Place of birth - Born in other state (%) - Multirace
Place of birth - Born in other state (%) - Other Race
Place of birth - Native, outside of US (%)
Place of birth - Native, outside of US (%) - White
Place of birth - Native, outside of US (%) - Black or African American
Place of birth - Native, outside of US (%) - Asian
Place of birth - Native, outside of US (%) - Hispanic or Latino
Place of birth - Native, outside of US (%) - American Indian and Alaska Native
Place of birth - Native, outside of US (%) - Multirace
Place of birth - Native, outside of US (%) - Other Race
Place of birth - Foreign born (%)
Place of birth - Foreign born (%) - White
Place of birth - Foreign born (%) - Black or African American
Place of birth - Foreign born (%) - Asian
Place of birth - Foreign born (%) - Hispanic or Latino
Place of birth - Foreign born (%) - American Indian and Alaska Native
Place of birth - Foreign born (%) - Multirace
Place of birth - Foreign born (%) - Other Race
Residents speaking English at home (%)
Residents speaking English at home - Born in the United States (%)
Residents speaking English at home - Native, born elsewhere (%)
Residents speaking English at home - Foreign born (%)
Residents speaking Spanish at home (%)
Residents speaking Spanish at home - Born in the United States (%)
Residents speaking Spanish at home - Native, born elsewhere (%)
Residents speaking Spanish at home - Foreign born (%)
Residents speaking other language at home (%)
Residents speaking other language at home - Born in the United States (%)
Residents speaking other language at home - Native, born elsewhere (%)
Residents speaking other language at home - Foreign born (%)
Marital status - Never married (%)
Marital status - Now married (%)
Marital status - Separated (%)
Marital status - Widowed (%)
Marital status - Divorced (%)
Ancestries Reported - Arab (%)
Ancestries Reported - Czech (%)
Ancestries Reported - Danish (%)
Ancestries Reported - Dutch (%)
Ancestries Reported - English (%)
Ancestries Reported - French (%)
Ancestries Reported - French Canadian (%)
Ancestries Reported - German (%)
Ancestries Reported - Greek (%)
Ancestries Reported - Hungarian (%)
Ancestries Reported - Irish (%)
Ancestries Reported - Italian (%)
Ancestries Reported - Lithuanian (%)
Ancestries Reported - Norwegian (%)
Ancestries Reported - Polish (%)
Ancestries Reported - Portuguese (%)
Ancestries Reported - Russian (%)
Ancestries Reported - Scotch-Irish (%)
Ancestries Reported - Scottish (%)
Ancestries Reported - Slovak (%)
Ancestries Reported - Subsaharan African (%)
Ancestries Reported - Swedish (%)
Ancestries Reported - Swiss (%)
Ancestries Reported - Ukrainian (%)
Ancestries Reported - United States (%)
Ancestries Reported - Welsh (%)
Ancestries Reported - West Indian (%)
Ancestries Reported - Other (%)
Geographical mobility - Same house 1 year ago (%)
Geographical mobility - Same house 1 year ago (%) - White
Geographical mobility - Same house 1 year ago (%) - Black or African American
Geographical mobility - Same house 1 year ago (%) - Asian
Geographical mobility - Same house 1 year ago (%) - Hispanic or Latino
Geographical mobility - Same house 1 year ago (%) - American Indian and Alaska Native
Geographical mobility - Same house 1 year ago (%) - Multirace
Geographical mobility - Same house 1 year ago (%) - Other Race
Geographical mobility - Moved within same county (%)
Geographical mobility - Moved within same county (%) - White
Geographical mobility - Moved within same county (%) - Black or African American
Geographical mobility - Moved within same county (%) - Asian
Geographical mobility - Moved within same county (%) - Hispanic or Latino
Geographical mobility - Moved within same county (%) - American Indian and Alaska Native
Geographical mobility - Moved within same county (%) - Multirace
Geographical mobility - Moved within same county (%) - Other Race
Geographical mobility - Moved from different county within same state (%)
Geographical mobility - Moved from different county within same state (%) - White
Geographical mobility - Moved from different county within same state (%) - Black or African American
Geographical mobility - Moved from different county within same state (%) - Asian
Geographical mobility - Moved from different county within same state (%) - Hispanic or Latino
Geographical mobility - Moved from different county within same state (%) - American Indian and Alaska Native
Geographical mobility - Moved from different county within same state (%) - Multirace
Geographical mobility - Moved from different county within same state (%) - Other Race
Geographical mobility - Moved from different state (%)
Geographical mobility - Moved from different state (%) - White
Geographical mobility - Moved from different state (%) - Black or African American
Geographical mobility - Moved from different state (%) - Asian
Geographical mobility - Moved from different state (%) - Hispanic or Latino
Geographical mobility - Moved from different state (%) - American Indian and Alaska Native
Geographical mobility - Moved from different state (%) - Multirace
Geographical mobility - Moved from different state (%) - Other Race
Geographical mobility - Moved from abroad (%)
Geographical mobility - Moved from abroad (%) - White
Geographical mobility - Moved from abroad (%) - Black or African American
Geographical mobility - Moved from abroad (%) - Asian
Geographical mobility - Moved from abroad (%) - Hispanic or Latino
Geographical mobility - Moved from abroad (%) - American Indian and Alaska Native
Geographical mobility - Moved from abroad (%) - Multirace
Geographical mobility - Moved from abroad (%) - Other Race
Place of birth for the foreign-born population - Ireland (%)
Place of birth for the foreign-born population - Denmark (%)
Place of birth for the foreign-born population - Norway (%)
Place of birth for the foreign-born population - Sweden (%)
Place of birth for the foreign-born population - United Kingdom (%)
Place of birth for the foreign-born population - England (%)
Place of birth for the foreign-born population - Scotland (%)
Place of birth for the foreign-born population - Other Northern Europe (%)
Place of birth for the foreign-born population - Austria (%)
Place of birth for the foreign-born population - Belgium (%)
Place of birth for the foreign-born population - France (%)
Place of birth for the foreign-born population - Germany (%)
Place of birth for the foreign-born population - Netherlands (%)
Place of birth for the foreign-born population - Switzerland (%)
Place of birth for the foreign-born population - Other Western Europe (%)
Place of birth for the foreign-born population - Greece (%)
Place of birth for the foreign-born population - Italy (%)
Place of birth for the foreign-born population - Portugal (%)
Place of birth for the foreign-born population - Spain (%)
Place of birth for the foreign-born population - Other Southern Europe (%)
Place of birth for the foreign-born population - Albania (%)
Place of birth for the foreign-born population - Belarus (%)
Place of birth for the foreign-born population - Bosnia and Herzegovina (%)
Place of birth for the foreign-born population - Bulgaria (%)
Place of birth for the foreign-born population - Croatia (%)
Place of birth for the foreign-born population - Czechoslovakia (%)
Place of birth for the foreign-born population - Hungary (%)
Place of birth for the foreign-born population - Latvia (%)
Place of birth for the foreign-born population - Lithuania (%)
Place of birth for the foreign-born population - North Macedonia (Macedonia) (%)
Place of birth for the foreign-born population - Moldova (%)
Place of birth for the foreign-born population - Poland (%)
Place of birth for the foreign-born population - Romania (%)
Place of birth for the foreign-born population - Russia (%)
Place of birth for the foreign-born population - Serbia (%)
Place of birth for the foreign-born population - Ukraine (%)
Place of birth for the foreign-born population - Other Eastern Europe (%)
Place of birth for the foreign-born population - China (%)
Place of birth for the foreign-born population - Hong Kong (%)
Place of birth for the foreign-born population - Taiwan (%)
Place of birth for the foreign-born population - Japan (%)
Place of birth for the foreign-born population - Korea (%)
Place of birth for the foreign-born population - Other Eastern Asia (%)
Place of birth for the foreign-born population - Afghanistan (%)
Place of birth for the foreign-born population - Bangladesh (%)
Place of birth for the foreign-born population - India (%)
Place of birth for the foreign-born population - Iran (%)
Place of birth for the foreign-born population - Kazakhstan (%)
Place of birth for the foreign-born population - Nepal (%)
Place of birth for the foreign-born population - Pakistan (%)
Place of birth for the foreign-born population - Sri Lanka (%)
Place of birth for the foreign-born population - Uzbekistan (%)
Place of birth for the foreign-born population - Other South Central Asia (%)
Place of birth for the foreign-born population - Burma (%)
Place of birth for the foreign-born population - Cambodia (%)
Place of birth for the foreign-born population - Indonesia (%)
Place of birth for the foreign-born population - Laos (%)
Place of birth for the foreign-born population - Malaysia (%)
Place of birth for the foreign-born population - Philippines (%)
Place of birth for the foreign-born population - Singapore (%)
Place of birth for the foreign-born population - Thailand (%)
Place of birth for the foreign-born population - Vietnam (%)
Place of birth for the foreign-born population - Other South Eastern Asia (%)
Place of birth for the foreign-born population - Armenia (%)
Place of birth for the foreign-born population - Iraq (%)
Place of birth for the foreign-born population - Israel (%)
Place of birth for the foreign-born population - Jordan (%)
Place of birth for the foreign-born population - Kuwait (%)
Place of birth for the foreign-born population - Lebanon (%)
Place of birth for the foreign-born population - Saudi Arabia (%)
Place of birth for the foreign-born population - Syria (%)
Place of birth for the foreign-born population - Turkey (%)
Place of birth for the foreign-born population - Yemen (%)
Place of birth for the foreign-born population - Other Western Asia (%)
Place of birth for the foreign-born population - Eritrea (%)
Place of birth for the foreign-born population - Ethiopia (%)
Place of birth for the foreign-born population - Kenya (%)
Place of birth for the foreign-born population - Somalia (%)
Place of birth for the foreign-born population - Uganda (%)
Place of birth for the foreign-born population - Zimbabwe (%)
Place of birth for the foreign-born population - Other Eastern Africa (%)
Place of birth for the foreign-born population - Cameroon (%)
Place of birth for the foreign-born population - Congo (%)
Place of birth for the foreign-born population - Democratic Republic of Congo (Zaire) (%)
Place of birth for the foreign-born population - Other Middle Africa (%)
Place of birth for the foreign-born population - Egypt (%)
Place of birth for the foreign-born population - Morocco (%)
Place of birth for the foreign-born population - Sudan (%)
Place of birth for the foreign-born population - Other Northern Africa (%)
Place of birth for the foreign-born population - South Africa (%)
Place of birth for the foreign-born population - Other Southern Africa (%)
Place of birth for the foreign-born population - Cabo Verde (%)
Place of birth for the foreign-born population - Ghana (%)
Place of birth for the foreign-born population - Liberia (%)
Place of birth for the foreign-born population - Nigeria (%)
Place of birth for the foreign-born population - Senegal (%)
Place of birth for the foreign-born population - Sierra Leone (%)
Place of birth for the foreign-born population - Other Western Africa (%)
Place of birth for the foreign-born population - Australia (%)
Place of birth for the foreign-born population - New Zealand (%)
Place of birth for the foreign-born population - Fiji (%)
Place of birth for the foreign-born population - Micronesia (%)
Place of birth for the foreign-born population - Bahamas (%)
Place of birth for the foreign-born population - Barbados (%)
Place of birth for the foreign-born population - Cuba (%)
Place of birth for the foreign-born population - Dominica (%)
Place of birth for the foreign-born population - Dominican Republic (%)
Place of birth for the foreign-born population - Grenada (%)
Place of birth for the foreign-born population - Haiti (%)
Place of birth for the foreign-born population - Jamaica (%)
Place of birth for the foreign-born population - St. Vincent and the Grenadines (%)
Place of birth for the foreign-born population - Trinidad and Tobago (%)
Place of birth for the foreign-born population - West Indies (%)
Place of birth for the foreign-born population - Other Caribbean (%)
Place of birth for the foreign-born population - Belize (%)
Place of birth for the foreign-born population - Costa Rica (%)
Place of birth for the foreign-born population - El Salvador (%)
Place of birth for the foreign-born population - Guatemala (%)
Place of birth for the foreign-born population - Honduras (%)
Place of birth for the foreign-born population - Mexico (%)
Place of birth for the foreign-born population - Nicaragua (%)
Place of birth for the foreign-born population - Panama (%)
Place of birth for the foreign-born population - Other Central America (%)
Place of birth for the foreign-born population - Argentina (%)
Place of birth for the foreign-born population - Bolivia (%)
Place of birth for the foreign-born population - Brazil (%)
Place of birth for the foreign-born population - Chile (%)
Place of birth for the foreign-born population - Colombia (%)
Place of birth for the foreign-born population - Ecuador (%)
Place of birth for the foreign-born population - Guyana (%)
Place of birth for the foreign-born population - Peru (%)
Place of birth for the foreign-born population - Uruguay (%)
Place of birth for the foreign-born population - Venezuela (%)
Place of birth for the foreign-born population - Other South America (%)
Place of birth for the foreign-born population - Canada (%)
Place of birth for the foreign-born population - Other Northern America (%)
Place of birth for the foreign-born population - Other (%)
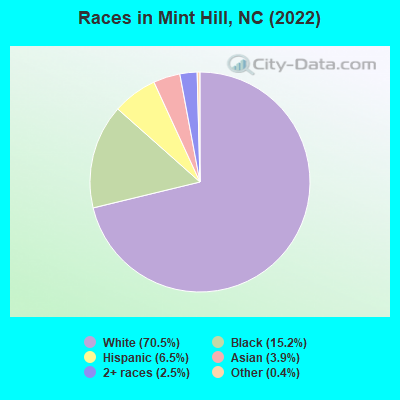
According to 2022 data, the most numerous races in Mint Hill, NC are White alone (19,198 residents), Black alone (4,130 residents), and Hispanic (1,766 residents). 87.7% of Mint Hill residents speak English at home. 10.9% of Mint Hill, NC residents are foreign-born (3.5% born in Latin America, 3.5% born in Asia, 2.5% born in Europe), which is 26.6% greater than the foreign-born rate of 8.0% across the entire state of North Carolina.
Race distribution in Mint Hill
2000 2022
5,647,155 70.2% White alone 1,723,301 21.4% Black alone 378,963 4.7% Hispanic 112,416 1.4% Asian alone 95,333 1.2% American Indian alone 79,965 1.0% Two or more races 9,015 0.1% Other race alone 3,165 0.04% Native Hawaiian and Other
6,497,519 60.7% White alone 2,155,650 20.1% Black alone 1,114,799 10.4% Hispanic 438,061 4.1% Two or more races 341,052 3.2% Asian alone 91,758 0.9% American Indian alone 50,180 0.5% Other race alone 9,954 0.09% Native Hawaiian and Other
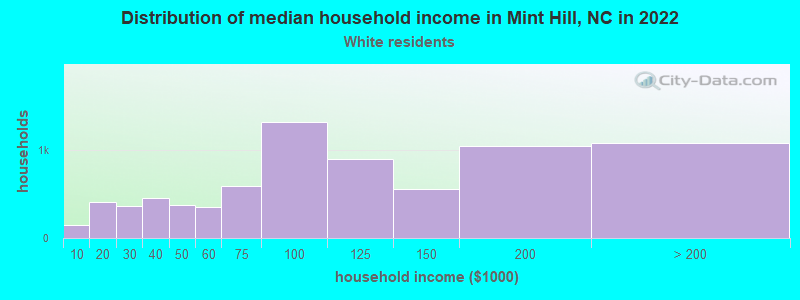
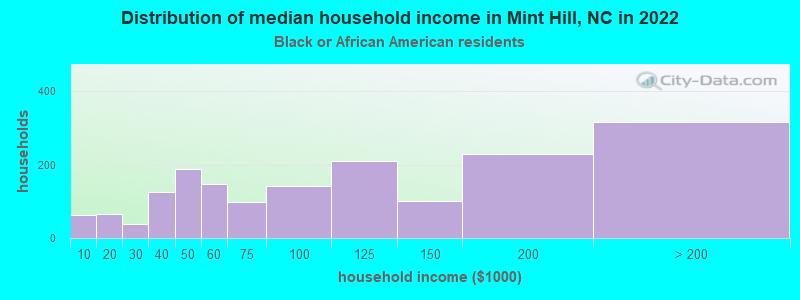
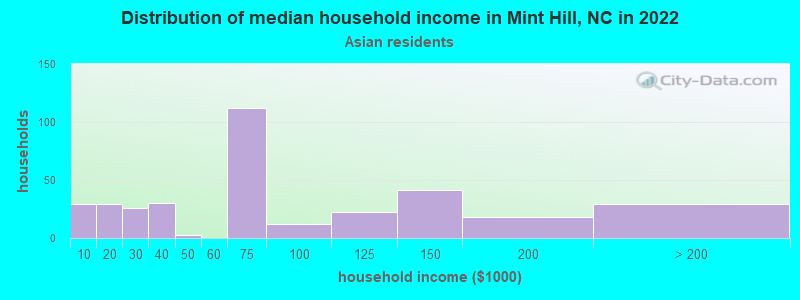
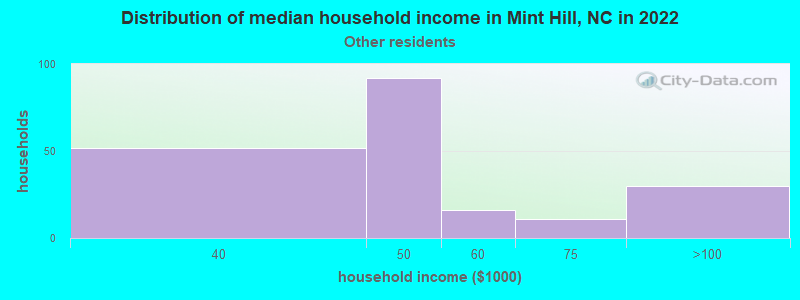
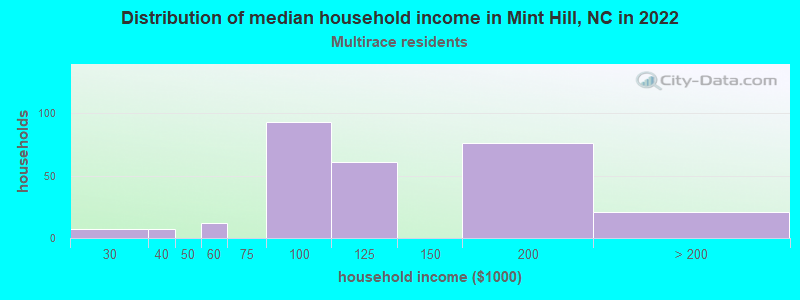
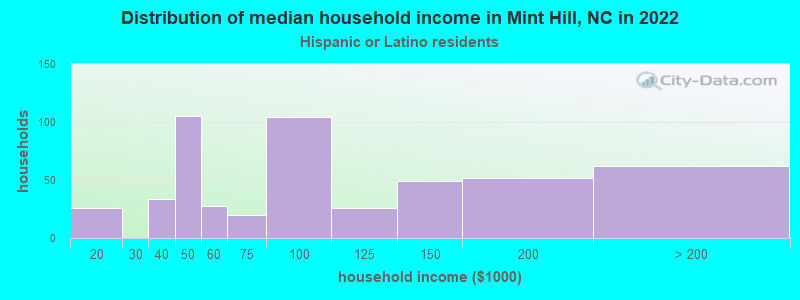
Income and house value in Mint Hill Median household income in 2022 $93,436 White non-Hispanic householders$91,818 Black householders$69,911 Asian householders$40,134 Some other race householders$109,893 Two or more races householders$77,431 Hispanic or Latino race householdersMedian 2022 house value $428,558 White Non-Hispanic householders$536,447 Black or African American householders$599,383 American Indian or Alaska Native householders $624,257 Asian householders$266,126 Some other race householders$299,691 Two or more races householders$369,519 Hispanic or Latino householders
Median age by race in Mint Hill
49.9 Median age for White residents46.9 51.8 39.7 Median age for Black or African American residents41.2 39.1 -623,853,210.4 Median age for American Indian / Alaska Native residents-596,273,291.3 -775,147,928.2 47.8 Median age for Asian residents49.8 47.8 -865,497,075.2 Median age for Native Hawaiian / Pacific Islander residents-706,616,728.4 -668,458,780.7 33.2 Median age for Other race residents24.6 39.3 28.5 Median age for Two or more races residents19.8 35.0 49.0 Median age for White alone residents46.0 51.6 36.5 Median age for Hispanic or Latino residents36.5 35.0
Owner/renter occupied households by race in Mint Hill
House owners and renters - White residents 6,595 85.3% Owner occupied1,140 14.7% Renter occupiedHouse owners and renters - Black or African American residents 907 55.0% Owner occupied742 45.0% Renter occupiedHouse owners and renters - American Indian / Alaska Native residents 15 100.0% Owner occupiedHouse owners and renters - Asian residents 306 88.0% Owner occupied42 12.0% Renter occupiedHouse owners and renters - Other race residents 46 21.1% Owner occupied171 78.9% Renter occupiedHouse owners and renters - Two or more races residents 268 89.7% Owner occupied31 10.3% Renter occupiedHouse owners and renters - White alone residents 6,577 84.8% Owner occupied1,177 15.2% Renter occupiedHouse owners and renters - Hispanic or Latino residents 294 58.5% Owner occupied209 41.5% Renter occupied
Language usage in Mint Hill
English speakers - Total 87.7% of residents of Mint Hill speak English at home.
4.9% of residents speak Spanish at home 911 72.2% Speak English very well350 27.8% Speak English less than very well7.4% of residents speak other language at home 1,035 54.2% Speak English very well874 45.8% Speak English less than very well
English speakers - Born in the United States 96.9% of residents of Mint Hill speak English at home.
2.4% of residents speak Spanish at home 200 74.1% Speak English very well70 25.9% Speak English less than very well0.7% of residents speak other language at home 67 87.0% Speak English very well10 13.0% Speak English less than very well
English speakers - Native, born elsewhere 78.3% of residents of Mint Hill speak English at home.
18.9% of residents speak Spanish at home 92 97.9% Speak English very well2 2.1% Speak English less than very well2.6% of residents speak other language at home 6 46.2% Speak English very well7 53.8% Speak English less than very well
English speakers - Foreign-born 21.0% of residents of Mint Hill speak English at home.
23.5% of residents speak Spanish at home 389 58.9% Speak English very well272 41.1% Speak English less than very well54.5% of residents speak other language at home 674 44.0% Speak English very well858 56.0% Speak English less than very well
White (Caucasian) - Speak only English Native:
99.1% (17,373)Foreign-born:
38.0% (282)
White (Caucasian) - Speak another language Native:
1.6% (273)Foreign-born:
63.6% (472)
Black or African American - Speak only English Native:
99.9% (3,531)Foreign-born:
46.7% (103)
Asian - Speak only English Native:
40.2% (142)Foreign-born:
5.2% (41)
Asian - Speak another language Native:
60.8% (214)Foreign-born:
94.5% (744)
Other race - Speak only English Native:
15.9% (60)Foreign-born:
9.0% (33)
Other race - Speak another language Native:
83.4% (313)Foreign-born:
88.6% (327)
Two or more races - Speak only English Native:
84.8% (744)Foreign-born:
20.8% (97)
Two or more races - Speak another language Native:
14.4% (127)Foreign-born:
79.5% (373)
White alone - Speak only English Native:
98.3% (17,321)Foreign-born:
31.0% (287)
White alone - Speak another language Native:
1.5% (256)Foreign-born:
69.7% (647)
Hispanic or Latino - Speak only English Native:
58.3% (536)Foreign-born:
7.4% (55)
Hispanic or Latino - Speak another language Native:
46.6% (429)Foreign-born:
92.2% (680)
Foreign-born residents in Mint Hill 2,971 residents are foreign born (3.5% Latin America , 3.5% Asia , 2.5% Europe ).
This city:
10.9%North Carolina:
8.3%
Marital status for residents in Mint Hill Marital status - White (Caucasian) population 15 years and over
Males 27.4% Never married65.1% Now married0.6% Separated1.1% Widowed5.7% DivorcedFemales 18.7% Never married56.0% Now married3.7% Separated10.7% Widowed10.9% DivorcedWomen who gave birth in the past 12 months Now married:
92.6% (240)Unmarried:
7.4% (19)
Women who did not give birth in the past 12 months Now married:
54.3% (1,860)Unmarried:
45.7% (1,563)
Marital status - Black or African American population 15 years and over
Males 32.4% Never married59.3% Now married0.0% Separated1.8% Widowed6.5% DivorcedFemales 36.0% Never married40.5% Now married0.5% Separated6.8% Widowed16.2% DivorcedWomen who gave birth in the past 12 months Now married:
100.0% (13)Unmarried:
0.0% (0)
Women who did not give birth in the past 12 months Now married:
30.4% (349)Unmarried:
69.6% (799)
Marital status - Asian population 15 years and over
Males 27.1% Never married69.1% Now married0.8% Separated3.0% Widowed0.0% DivorcedFemales 17.3% Never married79.2% Now married0.0% Separated0.4% Widowed3.1% DivorcedWomen who gave birth in the past 12 months Now married:
100.0% (18)Unmarried:
0.0% (0)
Women who did not give birth in the past 12 months Now married:
66.0% (172)Unmarried:
34.0% (88)
Marital status - Other race population 15 years and over
Males 37.9% Never married62.1% Now married0.0% Separated0.0% Widowed0.0% DivorcedFemales 30.0% Never married49.4% Now married0.0% Separated20.6% Widowed0.0% DivorcedWomen who did not give birth in the past 12 months Now married:
52.4% (98)Unmarried:
47.6% (89)
Marital status - Two or more races population 15 years and over
Males 45.8% Never married45.5% Now married0.0% Separated0.0% Widowed8.7% DivorcedFemales 24.8% Never married61.2% Now married5.7% Separated5.9% Widowed2.3% DivorcedWomen who gave birth in the past 12 months Now married:
100.0% (45)Unmarried:
0.0% (0)
Women who did not give birth in the past 12 months Now married:
61.1% (215)Unmarried:
38.9% (137)
Marital status - White alone, not Hispanic / Latino population 15 years and over
Males 27.4% Never married64.9% Now married0.7% Separated1.2% Widowed5.9% DivorcedFemales 18.2% Never married56.1% Now married3.8% Separated10.9% Widowed10.9% DivorcedWomen who gave birth in the past 12 months Now married:
92.6% (253)Unmarried:
7.4% (20)
Women who did not give birth in the past 12 months Now married:
54.9% (1,870)Unmarried:
45.1% (1,534)
Marital status - Hispanic or Latino population 15 years and over
Males 36.5% Never married63.5% Now married0.0% Separated0.0% Widowed0.0% DivorcedFemales 33.6% Never married54.9% Now married0.0% Separated8.1% Widowed3.4% DivorcedWomen who did not give birth in the past 12 months Now married:
45.2% (219)Unmarried:
54.8% (266)
Ancestries in Mint Hill
1,996 14.3% English1,444 10.4% American1,025 7.4% Irish866 6.2% German454 3.3% Italian434 3.1% Russian348 2.5% Scotch-Irish324 2.3% European273 2.0% Lebanese222 1.6% Ethiopian215 1.5% French Canadian213 1.5% Scottish159 1.1% Ukrainian146 1.0% French134 1.0% Polish122 0.9% Yugoslavian90 0.6% Brazilian88 0.6% Welsh86 0.6% Jamaican82 0.6% African77 0.6% Swedish70 0.5% Romanian59 0.4% South African53 0.4% Norwegian48 0.3% Swiss44 0.3% British27 0.2% Dutch23 0.2% Greek21 0.2% Liberian20 0.1% Serbian14 0.1% Czech11 0.08% Lithuanian10 0.07% Eastern European10 0.07% Czechoslovakian9 0.06% Belgian9 0.06% Iranian9 0.06% Finnish7 0.05% Slovak
Geographical mobility in Mint Hill Same house 1 year ago 17,141 92.7% White (Caucasian)3,468 84.9% Black or African American30 100.0% American Indian / Alaska Native1,188 100.0% Asian793 97.8% Other race1,367 96.0% Two or more races17,568 92.7% White alone, not Hispanic / Latino1,745 98.9% Hispanic or LatinoMoved within same county 671 3.6% White / Caucasian436 10.7% Black or African American8 0.7% Asian708 3.7% White alone, not Hispanic / Latino11 0.7% Hispanic or LatinoMoved within same state 483 2.6% White / Caucasian102 2.5% Black or African American109 7.7% Two or more races457 2.4% White alone, not Hispanic / Latino42 2.4% Hispanic or LatinoMoved from different state 292 1.6% White / Caucasian53 1.3% Black or African American36 2.5% Two or more races289 1.5% White alone, not Hispanic / Latino19 1.1% Hispanic or LatinoMoved from abroad 3 0.0% White28 2.4% Asian6 0.4% Hispanic or Latino
Children Nativity (place of birth) in Mint Hill
Children under 6 years - Living with two parents Both parents native 836 100.0% NativeBoth parents foreign-born 178 89.6% Native21 10.4% Foreign-bornOne native, one foreign-born parent 80 100.0% NativeChildren under 6 years - Living with one parent Native parent 187 100.0% NativeChildren 6 to 17 years - Living with two parents Both parents native 2,605 100.0% NativeBoth parents foreign-born 449 76.1% Native141 23.9% Foreign-bornOne native, one foreign-born parent 162 100.0% NativeChildren 6 to 17 years - Living with one parent Native parent 546 100.0% Native
Grandparents responsible for own grandchildren in Mint Hill
Grandparents (30 to 59 years) White / Caucasian 5 24.4% Responsible for grandchildren17 75.6% Not responsible for grandchildrenBlack or African American 4 100.0% Not responsible for grandchildrenOther race 2 100.0% Not responsible for grandchildrenWhite alone, not Hispanic / Latino 6 25.3% Responsible for grandchildren18 74.7% Not responsible for grandchildrenHispanic or Latino 1 100.0% Not responsible for grandchildrenGrandparents (60 years and over) White / Caucasian 5 1.7% Responsible for grandchildren284 98.3% Not responsible for grandchildrenBlack or African American 10 22.1% Responsible for grandchildren35 77.9% Not responsible for grandchildrenOther race 25 100.0% Not responsible for grandchildrenWhite alone, not Hispanic / Latino 6 2.1% Responsible for grandchildren301 97.9% Not responsible for grandchildrenHispanic or Latino 43 100.0% Not responsible for grandchildren