Races in Milton-Freewater, Oregon (OR) Detailed Stats
Data:
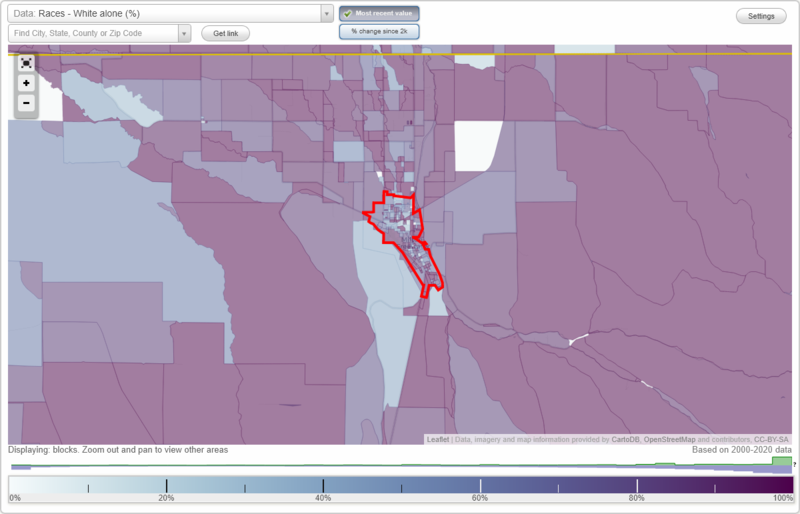
Races - White alone (%)
Races - White alone (% change since 2000)
Races - Black alone (%)
Races - Black alone (% change since 2000)
Races - American Indian alone (%)
Races - American Indian alone (% change since 2000)
Races - Asian alone (%)
Races - Asian alone (% change since 2000)
Races - Hispanic (%)
Races - Hispanic (% change since 2000)
Races - Native Hawaiian and Other Pacific Islander alone (%)
Races - Native Hawaiian and Other Pacific Islander alone (% change since 2000)
Races - Two or more races(%)
Races - Two or more races(% change since 2000)
Races - Other race alone (%)
Races - Other race alone (% change since 2000)
Racial diversity
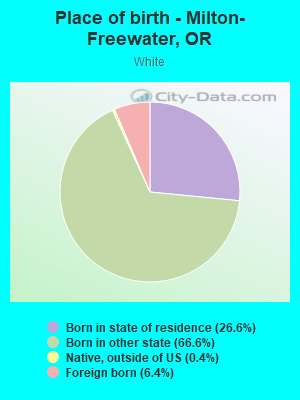
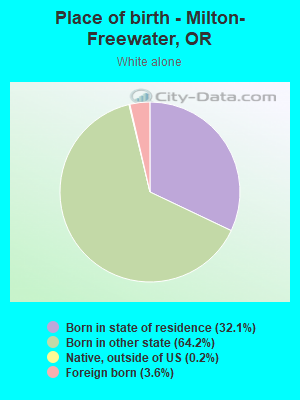
Place of birth - Born in state of residence (%)
Place of birth - Born in state of residence (%) - White
Place of birth - Born in state of residence (%) - Black or African American
Place of birth - Born in state of residence (%) - Asian
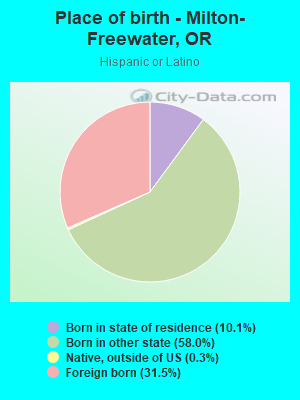
Place of birth - Born in state of residence (%) - Hispanic or Latino
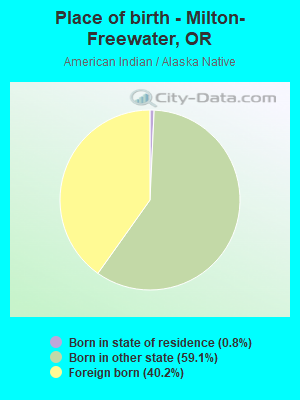
Place of birth - Born in state of residence (%) - American Indian and Alaska Native
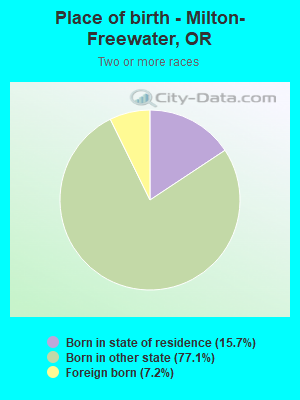
Place of birth - Born in state of residence (%) - Multirace
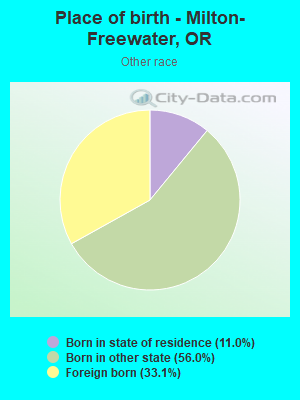
Place of birth - Born in state of residence (%) - Other Race
Place of birth - Born in other state (%)
Place of birth - Born in other state (%) - White
Place of birth - Born in other state (%) - Black or African American
Place of birth - Born in other state (%) - Asian
Place of birth - Born in other state (%) - Hispanic or Latino
Place of birth - Born in other state (%) - American Indian and Alaska Native
Place of birth - Born in other state (%) - Multirace
Place of birth - Born in other state (%) - Other Race
Place of birth - Native, outside of US (%)
Place of birth - Native, outside of US (%) - White
Place of birth - Native, outside of US (%) - Black or African American
Place of birth - Native, outside of US (%) - Asian
Place of birth - Native, outside of US (%) - Hispanic or Latino
Place of birth - Native, outside of US (%) - American Indian and Alaska Native
Place of birth - Native, outside of US (%) - Multirace
Place of birth - Native, outside of US (%) - Other Race
Place of birth - Foreign born (%)
Place of birth - Foreign born (%) - White
Place of birth - Foreign born (%) - Black or African American
Place of birth - Foreign born (%) - Asian
Place of birth - Foreign born (%) - Hispanic or Latino
Place of birth - Foreign born (%) - American Indian and Alaska Native
Place of birth - Foreign born (%) - Multirace
Place of birth - Foreign born (%) - Other Race
Residents speaking English at home (%)
Residents speaking English at home - Born in the United States (%)
Residents speaking English at home - Native, born elsewhere (%)
Residents speaking English at home - Foreign born (%)
Residents speaking Spanish at home (%)
Residents speaking Spanish at home - Born in the United States (%)
Residents speaking Spanish at home - Native, born elsewhere (%)
Residents speaking Spanish at home - Foreign born (%)
Residents speaking other language at home (%)
Residents speaking other language at home - Born in the United States (%)
Residents speaking other language at home - Native, born elsewhere (%)
Residents speaking other language at home - Foreign born (%)
Marital status - Never married (%)
Marital status - Now married (%)
Marital status - Separated (%)
Marital status - Widowed (%)
Marital status - Divorced (%)
Ancestries Reported - Arab (%)
Ancestries Reported - Czech (%)
Ancestries Reported - Danish (%)
Ancestries Reported - Dutch (%)
Ancestries Reported - English (%)
Ancestries Reported - French (%)
Ancestries Reported - French Canadian (%)
Ancestries Reported - German (%)
Ancestries Reported - Greek (%)
Ancestries Reported - Hungarian (%)
Ancestries Reported - Irish (%)
Ancestries Reported - Italian (%)
Ancestries Reported - Lithuanian (%)
Ancestries Reported - Norwegian (%)
Ancestries Reported - Polish (%)
Ancestries Reported - Portuguese (%)
Ancestries Reported - Russian (%)
Ancestries Reported - Scotch-Irish (%)
Ancestries Reported - Scottish (%)
Ancestries Reported - Slovak (%)
Ancestries Reported - Subsaharan African (%)
Ancestries Reported - Swedish (%)
Ancestries Reported - Swiss (%)
Ancestries Reported - Ukrainian (%)
Ancestries Reported - United States (%)
Ancestries Reported - Welsh (%)
Ancestries Reported - West Indian (%)
Ancestries Reported - Other (%)
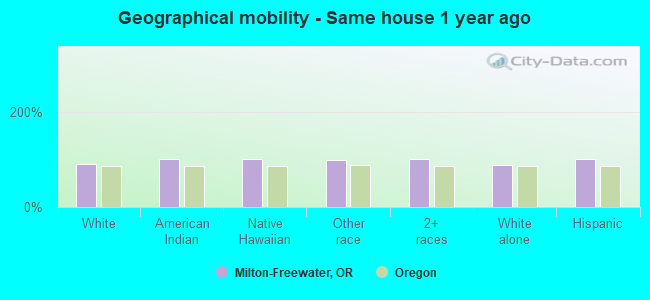
Geographical mobility - Same house 1 year ago (%)
Geographical mobility - Same house 1 year ago (%) - White
Geographical mobility - Same house 1 year ago (%) - Black or African American
Geographical mobility - Same house 1 year ago (%) - Asian
Geographical mobility - Same house 1 year ago (%) - Hispanic or Latino
Geographical mobility - Same house 1 year ago (%) - American Indian and Alaska Native
Geographical mobility - Same house 1 year ago (%) - Multirace
Geographical mobility - Same house 1 year ago (%) - Other Race
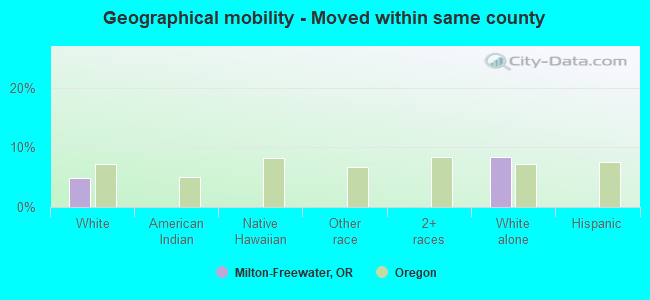
Geographical mobility - Moved within same county (%)
Geographical mobility - Moved within same county (%) - White
Geographical mobility - Moved within same county (%) - Black or African American
Geographical mobility - Moved within same county (%) - Asian
Geographical mobility - Moved within same county (%) - Hispanic or Latino
Geographical mobility - Moved within same county (%) - American Indian and Alaska Native
Geographical mobility - Moved within same county (%) - Multirace
Geographical mobility - Moved within same county (%) - Other Race
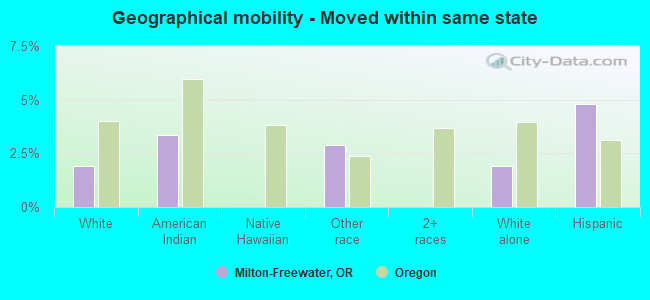
Geographical mobility - Moved from different county within same state (%)
Geographical mobility - Moved from different county within same state (%) - White
Geographical mobility - Moved from different county within same state (%) - Black or African American
Geographical mobility - Moved from different county within same state (%) - Asian
Geographical mobility - Moved from different county within same state (%) - Hispanic or Latino
Geographical mobility - Moved from different county within same state (%) - American Indian and Alaska Native
Geographical mobility - Moved from different county within same state (%) - Multirace
Geographical mobility - Moved from different county within same state (%) - Other Race
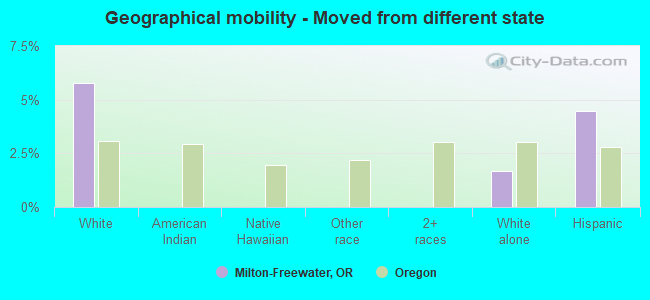
Geographical mobility - Moved from different state (%)
Geographical mobility - Moved from different state (%) - White
Geographical mobility - Moved from different state (%) - Black or African American
Geographical mobility - Moved from different state (%) - Asian
Geographical mobility - Moved from different state (%) - Hispanic or Latino
Geographical mobility - Moved from different state (%) - American Indian and Alaska Native
Geographical mobility - Moved from different state (%) - Multirace
Geographical mobility - Moved from different state (%) - Other Race
Geographical mobility - Moved from abroad (%)
Geographical mobility - Moved from abroad (%) - White
Geographical mobility - Moved from abroad (%) - Black or African American
Geographical mobility - Moved from abroad (%) - Asian
Geographical mobility - Moved from abroad (%) - Hispanic or Latino
Geographical mobility - Moved from abroad (%) - American Indian and Alaska Native
Geographical mobility - Moved from abroad (%) - Multirace
Geographical mobility - Moved from abroad (%) - Other Race
Place of birth for the foreign-born population - Ireland (%)
Place of birth for the foreign-born population - Denmark (%)
Place of birth for the foreign-born population - Norway (%)
Place of birth for the foreign-born population - Sweden (%)
Place of birth for the foreign-born population - United Kingdom (%)
Place of birth for the foreign-born population - England (%)
Place of birth for the foreign-born population - Scotland (%)
Place of birth for the foreign-born population - Other Northern Europe (%)
Place of birth for the foreign-born population - Austria (%)
Place of birth for the foreign-born population - Belgium (%)
Place of birth for the foreign-born population - France (%)
Place of birth for the foreign-born population - Germany (%)
Place of birth for the foreign-born population - Netherlands (%)
Place of birth for the foreign-born population - Switzerland (%)
Place of birth for the foreign-born population - Other Western Europe (%)
Place of birth for the foreign-born population - Greece (%)
Place of birth for the foreign-born population - Italy (%)
Place of birth for the foreign-born population - Portugal (%)
Place of birth for the foreign-born population - Spain (%)
Place of birth for the foreign-born population - Other Southern Europe (%)
Place of birth for the foreign-born population - Albania (%)
Place of birth for the foreign-born population - Belarus (%)
Place of birth for the foreign-born population - Bosnia and Herzegovina (%)
Place of birth for the foreign-born population - Bulgaria (%)
Place of birth for the foreign-born population - Croatia (%)
Place of birth for the foreign-born population - Czechoslovakia (%)
Place of birth for the foreign-born population - Hungary (%)
Place of birth for the foreign-born population - Latvia (%)
Place of birth for the foreign-born population - Lithuania (%)
Place of birth for the foreign-born population - North Macedonia (Macedonia) (%)
Place of birth for the foreign-born population - Moldova (%)
Place of birth for the foreign-born population - Poland (%)
Place of birth for the foreign-born population - Romania (%)
Place of birth for the foreign-born population - Russia (%)
Place of birth for the foreign-born population - Serbia (%)
Place of birth for the foreign-born population - Ukraine (%)
Place of birth for the foreign-born population - Other Eastern Europe (%)
Place of birth for the foreign-born population - China (%)
Place of birth for the foreign-born population - Hong Kong (%)
Place of birth for the foreign-born population - Taiwan (%)
Place of birth for the foreign-born population - Japan (%)
Place of birth for the foreign-born population - Korea (%)
Place of birth for the foreign-born population - Other Eastern Asia (%)
Place of birth for the foreign-born population - Afghanistan (%)
Place of birth for the foreign-born population - Bangladesh (%)
Place of birth for the foreign-born population - India (%)
Place of birth for the foreign-born population - Iran (%)
Place of birth for the foreign-born population - Kazakhstan (%)
Place of birth for the foreign-born population - Nepal (%)
Place of birth for the foreign-born population - Pakistan (%)
Place of birth for the foreign-born population - Sri Lanka (%)
Place of birth for the foreign-born population - Uzbekistan (%)
Place of birth for the foreign-born population - Other South Central Asia (%)
Place of birth for the foreign-born population - Burma (%)
Place of birth for the foreign-born population - Cambodia (%)
Place of birth for the foreign-born population - Indonesia (%)
Place of birth for the foreign-born population - Laos (%)
Place of birth for the foreign-born population - Malaysia (%)
Place of birth for the foreign-born population - Philippines (%)
Place of birth for the foreign-born population - Singapore (%)
Place of birth for the foreign-born population - Thailand (%)
Place of birth for the foreign-born population - Vietnam (%)
Place of birth for the foreign-born population - Other South Eastern Asia (%)
Place of birth for the foreign-born population - Armenia (%)
Place of birth for the foreign-born population - Iraq (%)
Place of birth for the foreign-born population - Israel (%)
Place of birth for the foreign-born population - Jordan (%)
Place of birth for the foreign-born population - Kuwait (%)
Place of birth for the foreign-born population - Lebanon (%)
Place of birth for the foreign-born population - Saudi Arabia (%)
Place of birth for the foreign-born population - Syria (%)
Place of birth for the foreign-born population - Turkey (%)
Place of birth for the foreign-born population - Yemen (%)
Place of birth for the foreign-born population - Other Western Asia (%)
Place of birth for the foreign-born population - Eritrea (%)
Place of birth for the foreign-born population - Ethiopia (%)
Place of birth for the foreign-born population - Kenya (%)
Place of birth for the foreign-born population - Somalia (%)
Place of birth for the foreign-born population - Uganda (%)
Place of birth for the foreign-born population - Zimbabwe (%)
Place of birth for the foreign-born population - Other Eastern Africa (%)
Place of birth for the foreign-born population - Cameroon (%)
Place of birth for the foreign-born population - Congo (%)
Place of birth for the foreign-born population - Democratic Republic of Congo (Zaire) (%)
Place of birth for the foreign-born population - Other Middle Africa (%)
Place of birth for the foreign-born population - Egypt (%)
Place of birth for the foreign-born population - Morocco (%)
Place of birth for the foreign-born population - Sudan (%)
Place of birth for the foreign-born population - Other Northern Africa (%)
Place of birth for the foreign-born population - South Africa (%)
Place of birth for the foreign-born population - Other Southern Africa (%)
Place of birth for the foreign-born population - Cabo Verde (%)
Place of birth for the foreign-born population - Ghana (%)
Place of birth for the foreign-born population - Liberia (%)
Place of birth for the foreign-born population - Nigeria (%)
Place of birth for the foreign-born population - Senegal (%)
Place of birth for the foreign-born population - Sierra Leone (%)
Place of birth for the foreign-born population - Other Western Africa (%)
Place of birth for the foreign-born population - Australia (%)
Place of birth for the foreign-born population - New Zealand (%)
Place of birth for the foreign-born population - Fiji (%)
Place of birth for the foreign-born population - Micronesia (%)
Place of birth for the foreign-born population - Bahamas (%)
Place of birth for the foreign-born population - Barbados (%)
Place of birth for the foreign-born population - Cuba (%)
Place of birth for the foreign-born population - Dominica (%)
Place of birth for the foreign-born population - Dominican Republic (%)
Place of birth for the foreign-born population - Grenada (%)
Place of birth for the foreign-born population - Haiti (%)
Place of birth for the foreign-born population - Jamaica (%)
Place of birth for the foreign-born population - St. Vincent and the Grenadines (%)
Place of birth for the foreign-born population - Trinidad and Tobago (%)
Place of birth for the foreign-born population - West Indies (%)
Place of birth for the foreign-born population - Other Caribbean (%)
Place of birth for the foreign-born population - Belize (%)
Place of birth for the foreign-born population - Costa Rica (%)
Place of birth for the foreign-born population - El Salvador (%)
Place of birth for the foreign-born population - Guatemala (%)
Place of birth for the foreign-born population - Honduras (%)
Place of birth for the foreign-born population - Mexico (%)
Place of birth for the foreign-born population - Nicaragua (%)
Place of birth for the foreign-born population - Panama (%)
Place of birth for the foreign-born population - Other Central America (%)
Place of birth for the foreign-born population - Argentina (%)
Place of birth for the foreign-born population - Bolivia (%)
Place of birth for the foreign-born population - Brazil (%)
Place of birth for the foreign-born population - Chile (%)
Place of birth for the foreign-born population - Colombia (%)
Place of birth for the foreign-born population - Ecuador (%)
Place of birth for the foreign-born population - Guyana (%)
Place of birth for the foreign-born population - Peru (%)
Place of birth for the foreign-born population - Uruguay (%)
Place of birth for the foreign-born population - Venezuela (%)
Place of birth for the foreign-born population - Other South America (%)
Place of birth for the foreign-born population - Canada (%)
Place of birth for the foreign-born population - Other Northern America (%)
Place of birth for the foreign-born population - Other (%)
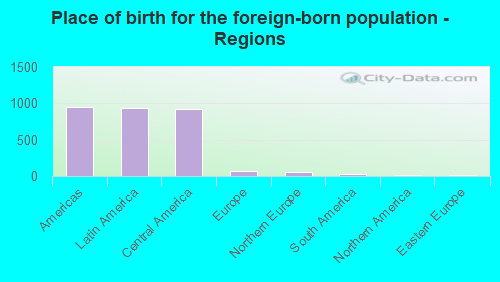
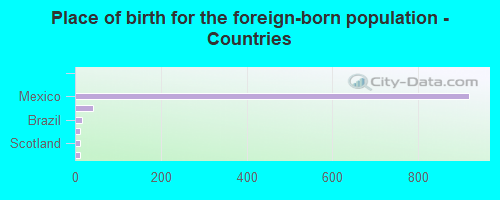
According to 2022 data, the most numerous races in Milton-Freewater, OR are White alone (3,486 residents), Hispanic (3,593 residents), and Two or more races (147 residents). 64.6% of Milton-Freewater residents speak English at home. 14.2% of Milton-Freewater, OR residents are foreign-born (13.0% born in Latin America), which is 36.8% greater than the foreign-born rate of 9.0% across the entire state of Oregon.
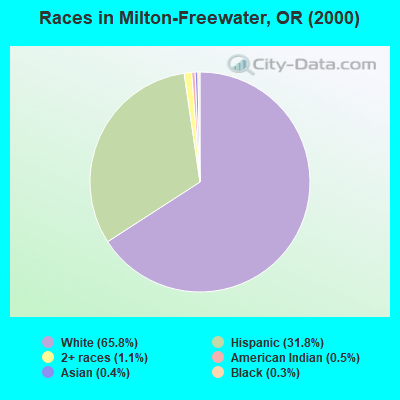
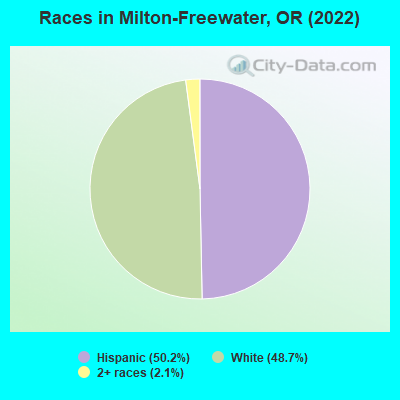
Race distribution in Milton-Freewater
2000 2022
2,857,616 83.5% White alone 275,314 8.0% Hispanic 100,333 2.9% Asian alone 82,733 2.4% Two or more races 53,325 1.6% Black alone 40,130 1.2% American Indian alone 7,398 0.2% Native Hawaiian and Other 4,550 0.1% Other race alone
3,037,571 71.6% White alone 609,538 14.4% Hispanic 252,744 6.0% Two or more races 191,283 4.5% Asian alone 78,228 1.8% Black alone 29,399 0.7% American Indian alone 25,731 0.6% Other race alone 15,643 0.4% Native Hawaiian and Other
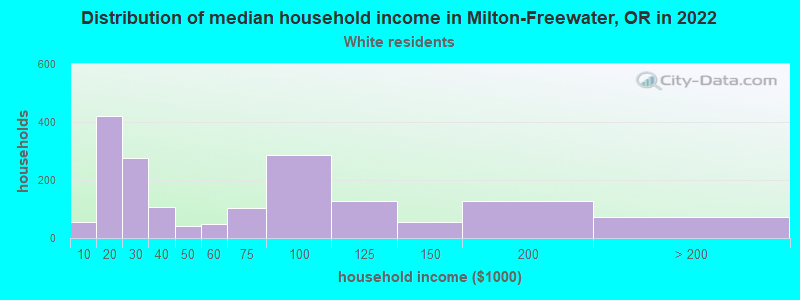
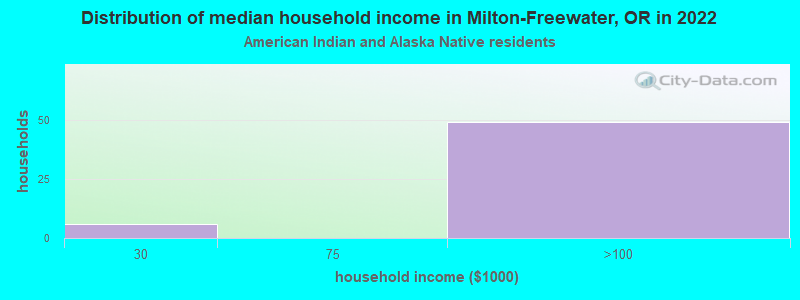
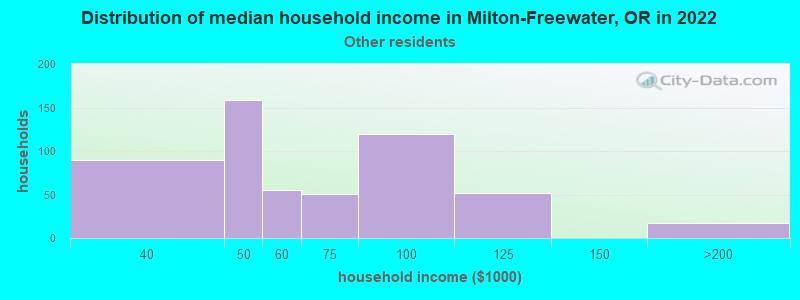
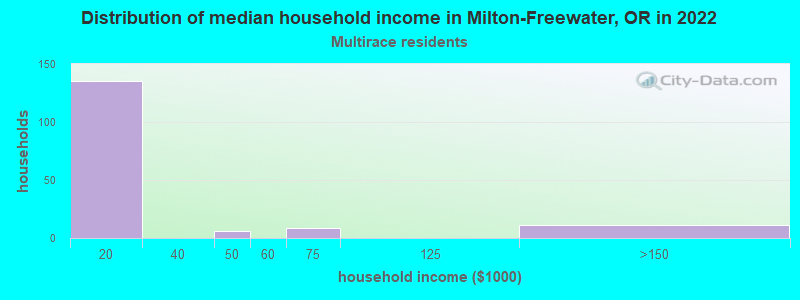
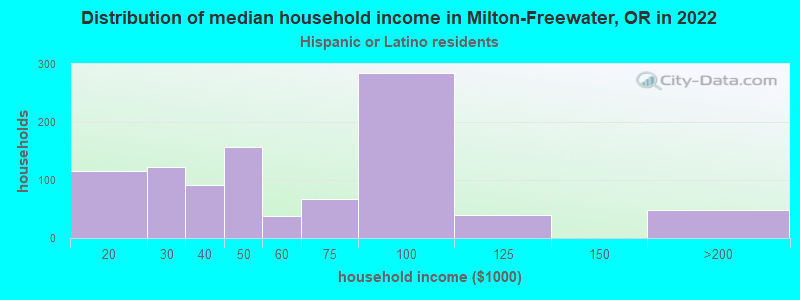
Income and house value in Milton-Freewater Median household income in 2022 $61,986 White non-Hispanic householders$40,324 American Indian and Alaska Native householders$75,856 Some other race householders$17,743 Two or more races householders$73,147 Hispanic or Latino race householdersMedian 2022 house value $242,459 White Non-Hispanic householders$231,397 Some other race householders$164,429 Two or more races householders$219,439 Hispanic or Latino householders
Median age by race in Milton-Freewater
37.1 Median age for White residents34.5 43.9 -708,748,615.0 Median age for Black or African American residents-717,607,972.7 -625,514,402.7 44.6 Median age for American Indian / Alaska Native residents49.2 45.9 -1,276,778,062.1 Median age for Asian residents-1,230,257,687.9 -681,895,092.4 -764,705,881.6 Median age for Native Hawaiian / Pacific Islander residents-764,119,600.6 -774,891,774.1 21.0 Median age for Other race residents34.0 17.3 24.9 Median age for Two or more races residents75.7 14.3 40.9 Median age for White alone residents38.2 43.3 22.6 Median age for Hispanic or Latino residents24.0 21.2
Owner/renter occupied households by race in Milton-Freewater
House owners and renters - White residents 791 48.2% Owner occupied850 51.8% Renter occupiedHouse owners and renters - American Indian / Alaska Native residents 43 89.8% Owner occupied5 10.2% Renter occupiedHouse owners and renters - Other race residents 341 45.9% Owner occupied403 54.1% Renter occupiedHouse owners and renters - Two or more races residents 24 9.7% Owner occupied220 90.3% Renter occupiedHouse owners and renters - White alone residents 769 57.1% Owner occupied579 42.9% Renter occupiedHouse owners and renters - Hispanic or Latino residents 372 36.2% Owner occupied655 63.8% Renter occupied
Language usage in Milton-Freewater
English speakers - Total 64.6% of residents of Milton-Freewater speak English at home.
36.3% of residents speak Spanish at home 1,541 66.8% Speak English very well765 33.2% Speak English less than very well0.3% of residents speak other language at home 12 54.5% Speak English very well10 45.5% Speak English less than very well
English speakers - Born in the United States 68.6% of residents of Milton-Freewater speak English at home.
31.9% of residents speak Spanish at home 1,034 87.2% Speak English very well152 12.8% Speak English less than very well
English speakers - Native, born elsewhere 16.7% of residents of Milton-Freewater speak English at home.
94.4% of residents speak Spanish at home 17 100.0% Speak English less than very well
English speakers - Foreign-born 7.5% of residents of Milton-Freewater speak English at home.
91.7% of residents speak Spanish at home 305 32.2% Speak English very well643 67.8% Speak English less than very well1.2% of residents speak other language at home 12 100.0% Speak English very well
White (Caucasian) - Speak only English Native:
91.3% (3,453)Foreign-born:
37.9% (102)
White (Caucasian) - Speak another language Native:
12.5% (474)Foreign-born:
69.1% (186)
American Indian / Alaska Native - Speak another language Native:
92.0% (113)Foreign-born:
100.0% (112)
Other race - Speak another language Native:
77.9% (1,048)Foreign-born:
100.0% (753)
Two or more races - Speak only English Native:
68.6% (323)Foreign-born:
15.0% (6)
Two or more races - Speak another language Native:
24.8% (117)Foreign-born:
43.1% (18)
White alone - Speak only English Native:
98.8% (3,284)Foreign-born:
80.3% (101)
White alone - Speak another language Native:
1.2% (41)Foreign-born:
19.0% (24)
Hispanic or Latino - Speak only English Native:
28.2% (512)Foreign-born:
0.5% (5)
Hispanic or Latino - Speak another language Native:
72.3% (1,312)Foreign-born:
100.0% (975)
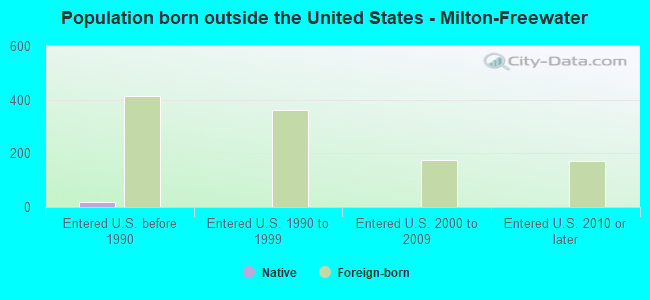
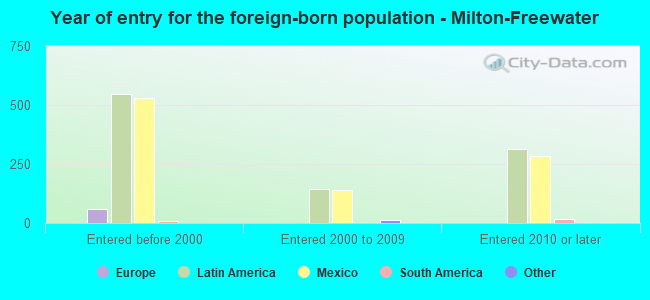
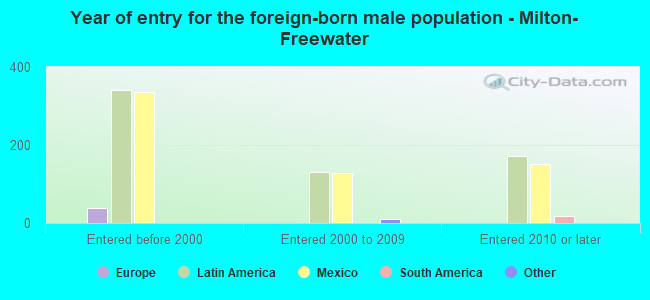
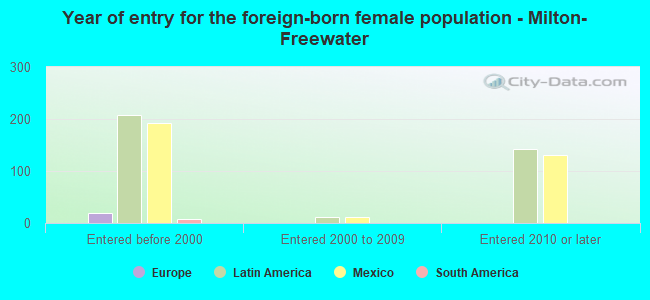
Foreign-born residents in Milton-Freewater 1,020 residents are foreign born (13.0% Latin America ).
This city:
14.2%Oregon:
9.8%
Marital status for residents in Milton-Freewater Marital status - White (Caucasian) population 15 years and over
Males 47.0% Never married42.3% Now married4.3% Separated1.2% Widowed5.2% DivorcedFemales 22.8% Never married39.6% Now married4.1% Separated10.0% Widowed23.4% DivorcedWomen who gave birth in the past 12 months Now married:
75.0% (40)Unmarried:
25.0% (13)
Women who did not give birth in the past 12 months Now married:
33.2% (277)Unmarried:
66.8% (558)
Marital status - American Indian / Alaska Native population 15 years and over
Males 0.0% Never married57.7% Now married0.0% Separated0.0% Widowed42.3% DivorcedFemales 70.5% Never married22.7% Now married0.0% Separated6.8% Widowed0.0% DivorcedWomen who did not give birth in the past 12 months Now married:
22.5% (20)Unmarried:
77.5% (68)
Marital status - Other race population 15 years and over
Males 61.0% Never married32.4% Now married6.6% Separated0.0% Widowed0.0% DivorcedFemales 64.1% Never married33.9% Now married0.0% Separated0.0% Widowed2.0% DivorcedWomen who did not give birth in the past 12 months Now married:
22.1% (108)Unmarried:
77.9% (380)
Marital status - Two or more races population 15 years and over
Males 22.0% Never married11.9% Now married0.0% Separated0.0% Widowed66.1% DivorcedFemales 52.9% Never married29.4% Now married0.0% Separated0.0% Widowed17.6% DivorcedWomen who did not give birth in the past 12 months Now married:
16.3% (9)Unmarried:
83.7% (45)
Marital status - White alone, not Hispanic / Latino population 15 years and over
Males 48.8% Never married37.8% Now married5.5% Separated1.4% Widowed6.6% DivorcedFemales 22.1% Never married38.2% Now married1.1% Separated12.6% Widowed26.0% DivorcedWomen who gave birth in the past 12 months Now married:
100.0% (30)Unmarried:
0.0% (0)
Women who did not give birth in the past 12 months Now married:
22.1% (149)Unmarried:
77.9% (525)
Marital status - Hispanic or Latino population 15 years and over
Males 47.3% Never married45.7% Now married3.0% Separated0.2% Widowed3.8% DivorcedFemales 49.5% Never married37.5% Now married6.6% Separated0.0% Widowed6.4% DivorcedWomen who gave birth in the past 12 months Now married:
51.5% (18)Unmarried:
48.5% (17)
Women who did not give birth in the past 12 months Now married:
36.2% (303)Unmarried:
63.8% (535)
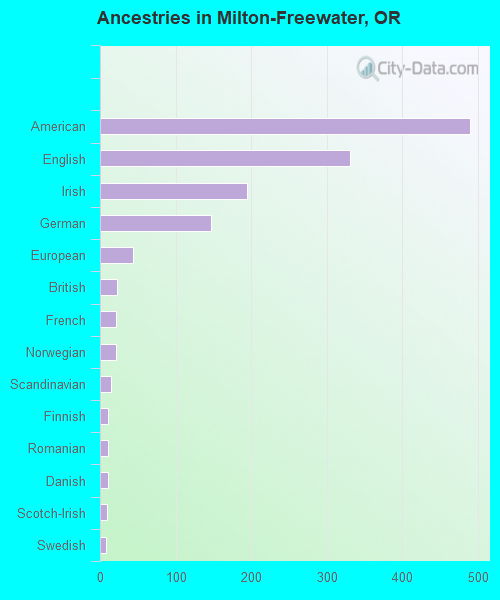
Ancestries in Milton-Freewater
490 11.5% American330 7.7% English194 4.5% Irish147 3.4% German44 1.0% European23 0.5% British21 0.5% French21 0.5% Norwegian14 0.3% Scandinavian11 0.3% Finnish11 0.3% Romanian10 0.2% Danish9 0.2% Scotch-Irish8 0.2% Swedish2 0.05% Italian
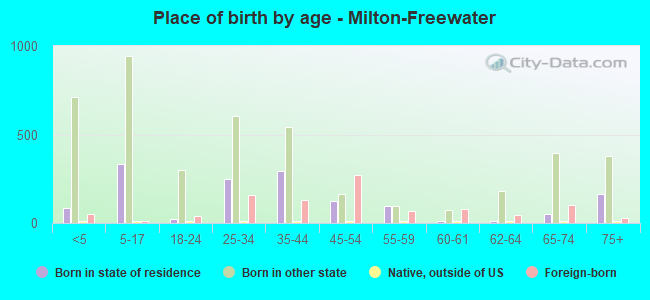
Children Nativity (place of birth) in Milton-Freewater
Children under 6 years - Living with two parents Both parents native 198 100.0% NativeBoth parents foreign-born 27 20.8% Native104 79.2% Foreign-bornOne native, one foreign-born parent 137 100.0% NativeChildren under 6 years - Living with one parent Native parent 337 100.0% NativeForeign-born parent 92 100.0% Native
Children 6 to 17 years - Living with two parents Both parents native 174 100.0% NativeBoth parents foreign-born 73 100.0% NativeOne native, one foreign-born parent 189 100.0% NativeChildren 6 to 17 years - Living with one parent Native parent 695 100.0% Native
Grandparents responsible for own grandchildren in Milton-Freewater
Grandparents (30 to 59 years) White / Caucasian 20 100.0% Responsible for grandchildrenWhite alone, not Hispanic / Latino 21 100.0% Responsible for grandchildrenGrandparents (60 years and over) White / Caucasian 23 33.9% Responsible for grandchildren44 66.1% Not responsible for grandchildrenWhite alone, not Hispanic / Latino 24 62.2% Responsible for grandchildren14 37.8% Not responsible for grandchildren