Races in Millville, New Jersey (NJ) Detailed Stats
Data:
Races - White alone (%)
Races - White alone (% change since 2000)
Races - Black alone (%)
Races - Black alone (% change since 2000)
Races - American Indian alone (%)
Races - American Indian alone (% change since 2000)
Races - Asian alone (%)
Races - Asian alone (% change since 2000)
Races - Hispanic (%)
Races - Hispanic (% change since 2000)
Races - Native Hawaiian and Other Pacific Islander alone (%)
Races - Native Hawaiian and Other Pacific Islander alone (% change since 2000)
Races - Two or more races(%)
Races - Two or more races(% change since 2000)
Races - Other race alone (%)
Races - Other race alone (% change since 2000)
Racial diversity
Place of birth - Born in state of residence (%)
Place of birth - Born in state of residence (%) - White
Place of birth - Born in state of residence (%) - Black or African American
Place of birth - Born in state of residence (%) - Asian
Place of birth - Born in state of residence (%) - Hispanic or Latino
Place of birth - Born in state of residence (%) - American Indian and Alaska Native
Place of birth - Born in state of residence (%) - Multirace
Place of birth - Born in state of residence (%) - Other Race
Place of birth - Born in other state (%)
Place of birth - Born in other state (%) - White
Place of birth - Born in other state (%) - Black or African American
Place of birth - Born in other state (%) - Asian
Place of birth - Born in other state (%) - Hispanic or Latino
Place of birth - Born in other state (%) - American Indian and Alaska Native
Place of birth - Born in other state (%) - Multirace
Place of birth - Born in other state (%) - Other Race
Place of birth - Native, outside of US (%)
Place of birth - Native, outside of US (%) - White
Place of birth - Native, outside of US (%) - Black or African American
Place of birth - Native, outside of US (%) - Asian
Place of birth - Native, outside of US (%) - Hispanic or Latino
Place of birth - Native, outside of US (%) - American Indian and Alaska Native
Place of birth - Native, outside of US (%) - Multirace
Place of birth - Native, outside of US (%) - Other Race
Place of birth - Foreign born (%)
Place of birth - Foreign born (%) - White
Place of birth - Foreign born (%) - Black or African American
Place of birth - Foreign born (%) - Asian
Place of birth - Foreign born (%) - Hispanic or Latino
Place of birth - Foreign born (%) - American Indian and Alaska Native
Place of birth - Foreign born (%) - Multirace
Place of birth - Foreign born (%) - Other Race
Residents speaking English at home (%)
Residents speaking English at home - Born in the United States (%)
Residents speaking English at home - Native, born elsewhere (%)
Residents speaking English at home - Foreign born (%)
Residents speaking Spanish at home (%)
Residents speaking Spanish at home - Born in the United States (%)
Residents speaking Spanish at home - Native, born elsewhere (%)
Residents speaking Spanish at home - Foreign born (%)
Residents speaking other language at home (%)
Residents speaking other language at home - Born in the United States (%)
Residents speaking other language at home - Native, born elsewhere (%)
Residents speaking other language at home - Foreign born (%)
Marital status - Never married (%)
Marital status - Now married (%)
Marital status - Separated (%)
Marital status - Widowed (%)
Marital status - Divorced (%)
Ancestries Reported - Arab (%)
Ancestries Reported - Czech (%)
Ancestries Reported - Danish (%)
Ancestries Reported - Dutch (%)
Ancestries Reported - English (%)
Ancestries Reported - French (%)
Ancestries Reported - French Canadian (%)
Ancestries Reported - German (%)
Ancestries Reported - Greek (%)
Ancestries Reported - Hungarian (%)
Ancestries Reported - Irish (%)
Ancestries Reported - Italian (%)
Ancestries Reported - Lithuanian (%)
Ancestries Reported - Norwegian (%)
Ancestries Reported - Polish (%)
Ancestries Reported - Portuguese (%)
Ancestries Reported - Russian (%)
Ancestries Reported - Scotch-Irish (%)
Ancestries Reported - Scottish (%)
Ancestries Reported - Slovak (%)
Ancestries Reported - Subsaharan African (%)
Ancestries Reported - Swedish (%)
Ancestries Reported - Swiss (%)
Ancestries Reported - Ukrainian (%)
Ancestries Reported - United States (%)
Ancestries Reported - Welsh (%)
Ancestries Reported - West Indian (%)
Ancestries Reported - Other (%)
Geographical mobility - Same house 1 year ago (%)
Geographical mobility - Same house 1 year ago (%) - White
Geographical mobility - Same house 1 year ago (%) - Black or African American
Geographical mobility - Same house 1 year ago (%) - Asian
Geographical mobility - Same house 1 year ago (%) - Hispanic or Latino
Geographical mobility - Same house 1 year ago (%) - American Indian and Alaska Native
Geographical mobility - Same house 1 year ago (%) - Multirace
Geographical mobility - Same house 1 year ago (%) - Other Race
Geographical mobility - Moved within same county (%)
Geographical mobility - Moved within same county (%) - White
Geographical mobility - Moved within same county (%) - Black or African American
Geographical mobility - Moved within same county (%) - Asian
Geographical mobility - Moved within same county (%) - Hispanic or Latino
Geographical mobility - Moved within same county (%) - American Indian and Alaska Native
Geographical mobility - Moved within same county (%) - Multirace
Geographical mobility - Moved within same county (%) - Other Race
Geographical mobility - Moved from different county within same state (%)
Geographical mobility - Moved from different county within same state (%) - White
Geographical mobility - Moved from different county within same state (%) - Black or African American
Geographical mobility - Moved from different county within same state (%) - Asian
Geographical mobility - Moved from different county within same state (%) - Hispanic or Latino
Geographical mobility - Moved from different county within same state (%) - American Indian and Alaska Native
Geographical mobility - Moved from different county within same state (%) - Multirace
Geographical mobility - Moved from different county within same state (%) - Other Race
Geographical mobility - Moved from different state (%)
Geographical mobility - Moved from different state (%) - White
Geographical mobility - Moved from different state (%) - Black or African American
Geographical mobility - Moved from different state (%) - Asian
Geographical mobility - Moved from different state (%) - Hispanic or Latino
Geographical mobility - Moved from different state (%) - American Indian and Alaska Native
Geographical mobility - Moved from different state (%) - Multirace
Geographical mobility - Moved from different state (%) - Other Race
Geographical mobility - Moved from abroad (%)
Geographical mobility - Moved from abroad (%) - White
Geographical mobility - Moved from abroad (%) - Black or African American
Geographical mobility - Moved from abroad (%) - Asian
Geographical mobility - Moved from abroad (%) - Hispanic or Latino
Geographical mobility - Moved from abroad (%) - American Indian and Alaska Native
Geographical mobility - Moved from abroad (%) - Multirace
Geographical mobility - Moved from abroad (%) - Other Race
Place of birth for the foreign-born population - Ireland (%)
Place of birth for the foreign-born population - Denmark (%)
Place of birth for the foreign-born population - Norway (%)
Place of birth for the foreign-born population - Sweden (%)
Place of birth for the foreign-born population - United Kingdom (%)
Place of birth for the foreign-born population - England (%)
Place of birth for the foreign-born population - Scotland (%)
Place of birth for the foreign-born population - Other Northern Europe (%)
Place of birth for the foreign-born population - Austria (%)
Place of birth for the foreign-born population - Belgium (%)
Place of birth for the foreign-born population - France (%)
Place of birth for the foreign-born population - Germany (%)
Place of birth for the foreign-born population - Netherlands (%)
Place of birth for the foreign-born population - Switzerland (%)
Place of birth for the foreign-born population - Other Western Europe (%)
Place of birth for the foreign-born population - Greece (%)
Place of birth for the foreign-born population - Italy (%)
Place of birth for the foreign-born population - Portugal (%)
Place of birth for the foreign-born population - Spain (%)
Place of birth for the foreign-born population - Other Southern Europe (%)
Place of birth for the foreign-born population - Albania (%)
Place of birth for the foreign-born population - Belarus (%)
Place of birth for the foreign-born population - Bosnia and Herzegovina (%)
Place of birth for the foreign-born population - Bulgaria (%)
Place of birth for the foreign-born population - Croatia (%)
Place of birth for the foreign-born population - Czechoslovakia (%)
Place of birth for the foreign-born population - Hungary (%)
Place of birth for the foreign-born population - Latvia (%)
Place of birth for the foreign-born population - Lithuania (%)
Place of birth for the foreign-born population - North Macedonia (Macedonia) (%)
Place of birth for the foreign-born population - Moldova (%)
Place of birth for the foreign-born population - Poland (%)
Place of birth for the foreign-born population - Romania (%)
Place of birth for the foreign-born population - Russia (%)
Place of birth for the foreign-born population - Serbia (%)
Place of birth for the foreign-born population - Ukraine (%)
Place of birth for the foreign-born population - Other Eastern Europe (%)
Place of birth for the foreign-born population - China (%)
Place of birth for the foreign-born population - Hong Kong (%)
Place of birth for the foreign-born population - Taiwan (%)
Place of birth for the foreign-born population - Japan (%)
Place of birth for the foreign-born population - Korea (%)
Place of birth for the foreign-born population - Other Eastern Asia (%)
Place of birth for the foreign-born population - Afghanistan (%)
Place of birth for the foreign-born population - Bangladesh (%)
Place of birth for the foreign-born population - India (%)
Place of birth for the foreign-born population - Iran (%)
Place of birth for the foreign-born population - Kazakhstan (%)
Place of birth for the foreign-born population - Nepal (%)
Place of birth for the foreign-born population - Pakistan (%)
Place of birth for the foreign-born population - Sri Lanka (%)
Place of birth for the foreign-born population - Uzbekistan (%)
Place of birth for the foreign-born population - Other South Central Asia (%)
Place of birth for the foreign-born population - Burma (%)
Place of birth for the foreign-born population - Cambodia (%)
Place of birth for the foreign-born population - Indonesia (%)
Place of birth for the foreign-born population - Laos (%)
Place of birth for the foreign-born population - Malaysia (%)
Place of birth for the foreign-born population - Philippines (%)
Place of birth for the foreign-born population - Singapore (%)
Place of birth for the foreign-born population - Thailand (%)
Place of birth for the foreign-born population - Vietnam (%)
Place of birth for the foreign-born population - Other South Eastern Asia (%)
Place of birth for the foreign-born population - Armenia (%)
Place of birth for the foreign-born population - Iraq (%)
Place of birth for the foreign-born population - Israel (%)
Place of birth for the foreign-born population - Jordan (%)
Place of birth for the foreign-born population - Kuwait (%)
Place of birth for the foreign-born population - Lebanon (%)
Place of birth for the foreign-born population - Saudi Arabia (%)
Place of birth for the foreign-born population - Syria (%)
Place of birth for the foreign-born population - Turkey (%)
Place of birth for the foreign-born population - Yemen (%)
Place of birth for the foreign-born population - Other Western Asia (%)
Place of birth for the foreign-born population - Eritrea (%)
Place of birth for the foreign-born population - Ethiopia (%)
Place of birth for the foreign-born population - Kenya (%)
Place of birth for the foreign-born population - Somalia (%)
Place of birth for the foreign-born population - Uganda (%)
Place of birth for the foreign-born population - Zimbabwe (%)
Place of birth for the foreign-born population - Other Eastern Africa (%)
Place of birth for the foreign-born population - Cameroon (%)
Place of birth for the foreign-born population - Congo (%)
Place of birth for the foreign-born population - Democratic Republic of Congo (Zaire) (%)
Place of birth for the foreign-born population - Other Middle Africa (%)
Place of birth for the foreign-born population - Egypt (%)
Place of birth for the foreign-born population - Morocco (%)
Place of birth for the foreign-born population - Sudan (%)
Place of birth for the foreign-born population - Other Northern Africa (%)
Place of birth for the foreign-born population - South Africa (%)
Place of birth for the foreign-born population - Other Southern Africa (%)
Place of birth for the foreign-born population - Cabo Verde (%)
Place of birth for the foreign-born population - Ghana (%)
Place of birth for the foreign-born population - Liberia (%)
Place of birth for the foreign-born population - Nigeria (%)
Place of birth for the foreign-born population - Senegal (%)
Place of birth for the foreign-born population - Sierra Leone (%)
Place of birth for the foreign-born population - Other Western Africa (%)
Place of birth for the foreign-born population - Australia (%)
Place of birth for the foreign-born population - New Zealand (%)
Place of birth for the foreign-born population - Fiji (%)
Place of birth for the foreign-born population - Micronesia (%)
Place of birth for the foreign-born population - Bahamas (%)
Place of birth for the foreign-born population - Barbados (%)
Place of birth for the foreign-born population - Cuba (%)
Place of birth for the foreign-born population - Dominica (%)
Place of birth for the foreign-born population - Dominican Republic (%)
Place of birth for the foreign-born population - Grenada (%)
Place of birth for the foreign-born population - Haiti (%)
Place of birth for the foreign-born population - Jamaica (%)
Place of birth for the foreign-born population - St. Vincent and the Grenadines (%)
Place of birth for the foreign-born population - Trinidad and Tobago (%)
Place of birth for the foreign-born population - West Indies (%)
Place of birth for the foreign-born population - Other Caribbean (%)
Place of birth for the foreign-born population - Belize (%)
Place of birth for the foreign-born population - Costa Rica (%)
Place of birth for the foreign-born population - El Salvador (%)
Place of birth for the foreign-born population - Guatemala (%)
Place of birth for the foreign-born population - Honduras (%)
Place of birth for the foreign-born population - Mexico (%)
Place of birth for the foreign-born population - Nicaragua (%)
Place of birth for the foreign-born population - Panama (%)
Place of birth for the foreign-born population - Other Central America (%)
Place of birth for the foreign-born population - Argentina (%)
Place of birth for the foreign-born population - Bolivia (%)
Place of birth for the foreign-born population - Brazil (%)
Place of birth for the foreign-born population - Chile (%)
Place of birth for the foreign-born population - Colombia (%)
Place of birth for the foreign-born population - Ecuador (%)
Place of birth for the foreign-born population - Guyana (%)
Place of birth for the foreign-born population - Peru (%)
Place of birth for the foreign-born population - Uruguay (%)
Place of birth for the foreign-born population - Venezuela (%)
Place of birth for the foreign-born population - Other South America (%)
Place of birth for the foreign-born population - Canada (%)
Place of birth for the foreign-born population - Other Northern America (%)
Place of birth for the foreign-born population - Other (%)
Latest news about races in Millville, NJ collected exclusively by city-data.com from local newspapers, TV, and radio stations
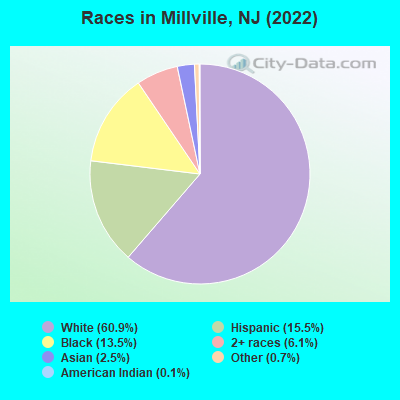
According to 2022 data, the most numerous races in Millville, NJ are White alone (16,513 residents), Hispanic (4,202 residents), and Black alone (3,663 residents). 85.2% of Millville residents speak English at home. 7.2% of Millville, NJ residents are foreign-born (3.0% born in Latin America, 2.4% born in Asia, 1.2% born in Europe), which is 220.7% less than the foreign-born rate of 23.0% across the entire state of New Jersey.
Race distribution in Millville
2000 2022
5,557,209 66.0% White alone 1,117,191 13.3% Hispanic 1,096,171 13.0% Black alone 477,012 5.7% Asian alone 133,689 1.6% Two or more races 19,565 0.2% Other race alone 11,338 0.1% American Indian alone 2,175 0.03% Native Hawaiian and Other
4,766,476 51.5% White alone 2,028,470 21.9% Hispanic 1,111,632 12.0% Black alone 923,546 10.0% Asian alone 332,237 3.6% Two or more races 89,847 1.0% Other race alone 8,557 0.09% American Indian alone 934 0.01% Native Hawaiian and Other
Income and house value in Millville Median household income in 2022 $65,213 White non-Hispanic householders$54,782 Black householders$32,070 Asian householders$61,577 Some other race householders$45,227 Hispanic or Latino race householdersMedian 2022 house value $196,011 White Non-Hispanic householders$171,904 Black or African American householders$187,900 American Indian or Alaska Native householders $260,447 Asian householders$182,493 Some other race householders$148,698 Two or more races householders$215,387 Hispanic or Latino householders
Median age by race in Millville
51.7 Median age for White residents49.2 54.0 40.2 Median age for Black or African American residents35.2 46.4 -717,948,717.2 Median age for American Indian / Alaska Native residents-699,842,021.4 -691,250,903.1 43.5 Median age for Asian residents12.6 40.9 -804,177,544.9 Median age for Native Hawaiian / Pacific Islander residents-666,666,666.0 -666,666,666.0 31.0 Median age for Other race residents34.8 29.3 19.4 Median age for Two or more races residents16.9 22.2 51.7 Median age for White alone residents49.1 52.6 32.4 Median age for Hispanic or Latino residents30.9 32.0
Owner/renter occupied households by race in Millville
House owners and renters - White residents 6,265 77.0% Owner occupied1,870 23.0% Renter occupiedHouse owners and renters - Black or African American residents 483 34.7% Owner occupied910 65.3% Renter occupiedHouse owners and renters - American Indian / Alaska Native residents 8 100.0% Owner occupiedHouse owners and renters - Asian residents 173 53.6% Owner occupied150 46.4% Renter occupiedHouse owners and renters - Other race residents 350 68.7% Owner occupied159 31.3% Renter occupiedHouse owners and renters - Two or more races residents 298 41.9% Owner occupied414 58.1% Renter occupiedHouse owners and renters - White alone residents 6,064 72.1% Owner occupied2,349 27.9% Renter occupiedHouse owners and renters - Hispanic or Latino residents 938 68.2% Owner occupied438 31.8% Renter occupied
Language usage in Millville
English speakers - Total 85.2% of residents of Millville speak English at home.
9.7% of residents speak Spanish at home 1,301 52.1% Speak English very well1,196 47.9% Speak English less than very well4.4% of residents speak other language at home 609 54.1% Speak English very well516 45.9% Speak English less than very well
English speakers - Born in the United States 84.6% of residents of Millville speak English at home.
11.5% of residents speak Spanish at home 429 78.4% Speak English very well118 21.6% Speak English less than very well1.2% of residents speak other language at home 55 100.0% Speak English very well
English speakers - Native, born elsewhere 14.0% of residents of Millville speak English at home.
80.6% of residents speak Spanish at home 161 20.2% Speak English very well637 79.8% Speak English less than very well
English speakers - Foreign-born 28.0% of residents of Millville speak English at home.
25.3% of residents speak Spanish at home 121 24.0% Speak English very well384 76.0% Speak English less than very well53.5% of residents speak other language at home 613 57.5% Speak English very well454 42.5% Speak English less than very well
White (Caucasian) - Speak only English Native:
99.8% (15,338)Foreign-born:
25.2% (124)
White (Caucasian) - Speak another language Native:
4.2% (653)Foreign-born:
75.0% (369)
Black or African American - Speak only English Native:
100.0% (3,192)Foreign-born:
95.2% (418)
Black or African American - Speak another language Native:
2.2% (69)Foreign-born:
10.3% (45)
Asian - Speak only English Native:
85.0% (51)Foreign-born:
2.2% (11)
Asian - Speak another language Native:
17.2% (10)Foreign-born:
98.0% (495)
Other race - Speak another language Native:
54.0% (835)Foreign-born:
100.0% (71)
Two or more races - Speak another language Native:
8.6% (181)Foreign-born:
94.3% (63)
White alone - Speak only English Native:
98.6% (15,054)Foreign-born:
21.8% (119)
White alone - Speak another language Native:
1.6% (239)Foreign-born:
78.9% (431)
Hispanic or Latino - Speak only English Native:
43.5% (1,459)Foreign-born:
3.9% (20)
Hispanic or Latino - Speak another language Native:
56.8% (1,905)Foreign-born:
96.6% (501)
Foreign-born residents in Millville 1,945 residents are foreign born (3.0% Latin America , 2.4% Asia , 1.2% Europe ).
This city:
7.2%New Jersey:
23.2%
Marital status for residents in Millville Marital status - White (Caucasian) population 15 years and over
Males 32.9% Never married51.7% Now married0.7% Separated6.1% Widowed8.5% DivorcedFemales 23.7% Never married46.3% Now married5.3% Separated12.1% Widowed12.5% DivorcedWomen who gave birth in the past 12 months Now married:
63.2% (48)Unmarried:
36.8% (28)
Women who did not give birth in the past 12 months Now married:
48.0% (1,473)Unmarried:
52.0% (1,599)
Marital status - Black or African American population 15 years and over
Males 62.4% Never married22.2% Now married4.8% Separated0.9% Widowed9.6% DivorcedFemales 46.8% Never married29.7% Now married1.7% Separated9.3% Widowed12.6% DivorcedWomen who did not give birth in the past 12 months Now married:
25.5% (213)Unmarried:
74.5% (623)
Marital status - Asian population 15 years and over
Males 39.7% Never married60.3% Now married0.0% Separated0.0% Widowed0.0% DivorcedFemales 9.0% Never married59.7% Now married0.0% Separated15.5% Widowed15.9% DivorcedWomen who did not give birth in the past 12 months Now married:
86.0% (130)Unmarried:
14.0% (21)
Marital status - Other race population 15 years and over
Males 46.6% Never married53.4% Now married0.0% Separated0.0% Widowed0.0% DivorcedFemales 40.3% Never married42.1% Now married0.0% Separated13.9% Widowed3.8% DivorcedWomen who gave birth in the past 12 months Now married:
0.0% (0)Unmarried:
100.0% (34)
Women who did not give birth in the past 12 months Now married:
46.0% (191)Unmarried:
54.0% (224)
Marital status - Two or more races population 15 years and over
Males 68.3% Never married28.3% Now married2.3% Separated1.1% Widowed0.0% DivorcedFemales 55.4% Never married23.1% Now married2.5% Separated1.0% Widowed17.9% DivorcedWomen who did not give birth in the past 12 months Now married:
19.5% (138)Unmarried:
80.5% (569)
Marital status - White alone, not Hispanic / Latino population 15 years and over
Males 33.2% Never married51.1% Now married0.5% Separated6.5% Widowed8.8% DivorcedFemales 22.5% Never married46.9% Now married4.9% Separated13.5% Widowed12.2% DivorcedWomen who gave birth in the past 12 months Now married:
75.0% (58)Unmarried:
25.0% (19)
Women who did not give birth in the past 12 months Now married:
47.8% (1,455)Unmarried:
52.2% (1,588)
Marital status - Hispanic or Latino population 15 years and over
Males 38.2% Never married51.6% Now married2.2% Separated2.8% Widowed5.3% DivorcedFemales 35.0% Never married40.5% Now married5.9% Separated4.0% Widowed14.6% DivorcedWomen who gave birth in the past 12 months Now married:
0.0% (0)Unmarried:
100.0% (39)
Women who did not give birth in the past 12 months Now married:
47.5% (568)Unmarried:
52.5% (628)
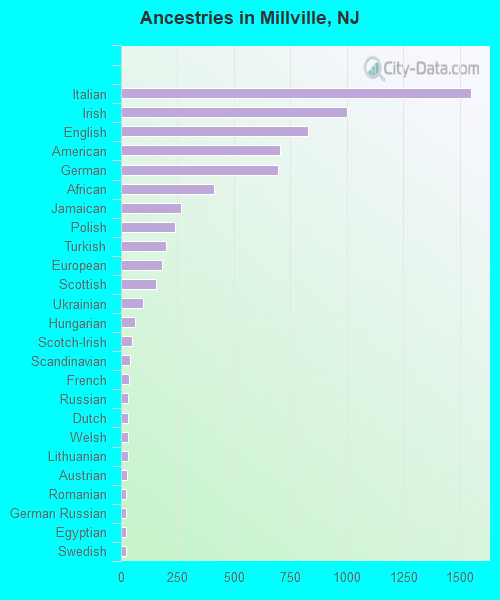
Ancestries in Millville
1,552 12.7% Italian1,002 8.2% Irish830 6.8% English706 5.8% American694 5.7% German413 3.4% African264 2.2% Jamaican240 2.0% Polish200 1.6% Turkish182 1.5% European153 1.2% Scottish99 0.8% Ukrainian63 0.5% Hungarian47 0.4% Scotch-Irish41 0.3% Scandinavian36 0.3% French32 0.3% Russian30 0.2% Dutch30 0.2% Welsh29 0.2% Lithuanian27 0.2% Austrian24 0.2% Romanian23 0.2% German Russian22 0.2% Egyptian21 0.2% Swedish20 0.2% Pennsylvania German19 0.2% Norwegian18 0.1% Greek17 0.1% Czech16 0.1% British14 0.1% Eastern European8 0.07% Northern European8 0.07% West Indian
Children Nativity (place of birth) in Millville
Children under 6 years - Living with two parents Both parents native 548 100.0% NativeBoth parents foreign-born 56 100.0% Foreign-bornOne native, one foreign-born parent 152 100.0% NativeChildren under 6 years - Living with one parent Native parent 647 100.0% NativeForeign-born parent 90 100.0% NativeChildren 6 to 17 years - Living with two parents Both parents native 1,531 100.0% NativeBoth parents foreign-born 109 43.9% Native139 56.1% Foreign-bornOne native, one foreign-born parent 276 100.0% NativeChildren 6 to 17 years - Living with one parent Native parent 1,691 100.0% NativeForeign-born parent 12 50.3% Native12 49.7% Foreign-born
Grandparents responsible for own grandchildren in Millville
Grandparents (30 to 59 years) White / Caucasian 45 32.3% Responsible for grandchildren94 67.7% Not responsible for grandchildrenAmerican Indian / Alaska Native 13 100.0% Not responsible for grandchildrenOther race 24 100.0% Not responsible for grandchildrenWhite alone, not Hispanic / Latino 53 40.5% Responsible for grandchildren78 59.5% Not responsible for grandchildrenHispanic or Latino 73 100.0% Not responsible for grandchildrenGrandparents (60 years and over) White / Caucasian 132 62.7% Responsible for grandchildren78 37.3% Not responsible for grandchildrenWhite alone, not Hispanic / Latino 150 63.3% Responsible for grandchildren87 36.7% Not responsible for grandchildrenHispanic or Latino 7 100.0% Responsible for grandchildren