Races in Middletown, Pennsylvania (PA) Detailed Stats
Ancestries, Foreign-born residents, place of birth
Settings
X


Recent posts about races in Middletown, Pennsylvania on our local forum with over 2,400,000 registered users:
 | Walkable areas - PA small to mid sized cities (19 replies) |
| Buying a house in Harrisburg, never been there before (23 replies) |
| Harrisburg International Airport (40 replies) |
| Hershey area (3 replies) |
| Any Hershey/Palmyra (or thereabouts) Singles for $150-160K? (8 replies) |
| Pros & Cons of East Shore vs. West Shore vs. Upper Dauphin/Perry County (2 replies) |
Latest news about races in Middletown, PA collected exclusively by city-data.com from local newspapers, TV, and radio stations
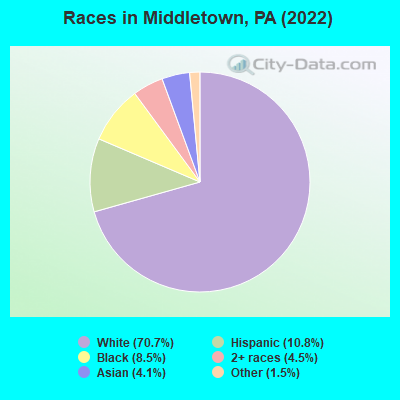
According to 2022 data, the most numerous races in Middletown, PA are White alone (6,794 residents), Black alone (816 residents), and Hispanic (1,037 residents). 88.2% of Middletown residents speak English at home. 7.4% of Middletown, PA residents are foreign-born (5.2% born in Asia, 1.2% born in Europe), which is 5.7% greater than the foreign-born rate of 7.0% across the entire state of Pennsylvania.
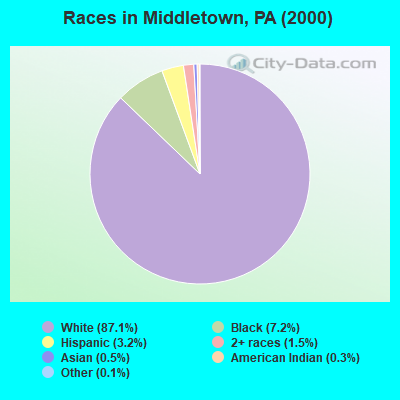
Race distribution in Middletown
2000
2022

- 8,05287.1%White alone
- 6657.2%Black alone
- 2943.2%Hispanic
- 1401.5%Two or more races
- 490.5%Asian alone
- 250.3%American Indian alone
- 130.1%Other race alone
- 40.04%Native Hawaiian and Other
Pacific Islander alone
-
- 6,79470.7%White alone
- 1,03710.8%Hispanic
- 8168.5%Black alone
- 4344.5%Two or more races
- 3924.1%Asian alone
- 1421.5%Other race alone
- 30.03%American Indian alone
2000
2022
-
- 10,322,45584.1%White alone
- 1,202,4379.8%Black alone
- 394,0883.2%Hispanic
- 218,2961.8%Asian alone
- 113,0970.9%Two or more races
- 13,0860.1%Other race alone
- 14,9040.1%American Indian alone
- 2,6910.02%Native Hawaiian and Other
Pacific Islander alone

-
- 9,487,22873.1%White alone
- 1,311,58110.1%Black alone
- 1,115,9978.6%Hispanic
- 493,9423.8%Two or more races
- 487,1243.8%Asian alone
- 63,5820.5%Other race alone
- 10,1300.08%American Indian alone
- 2,4240.02%Native Hawaiian and Other
Pacific Islander alone

Income and house value in Middletown
- Median household income in 2022
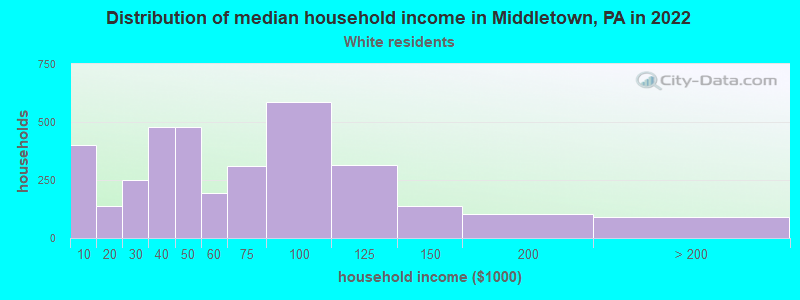
- $49,878White non-Hispanic householders
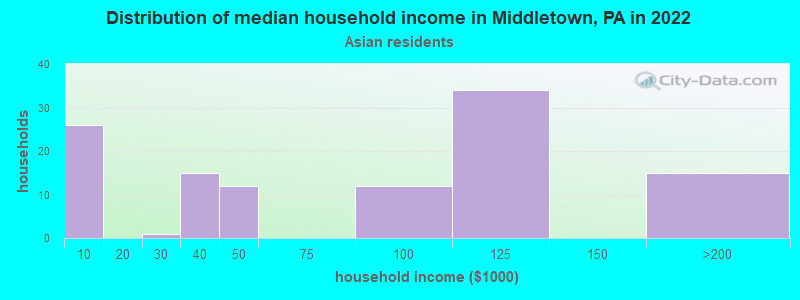
- $91,597Asian householders
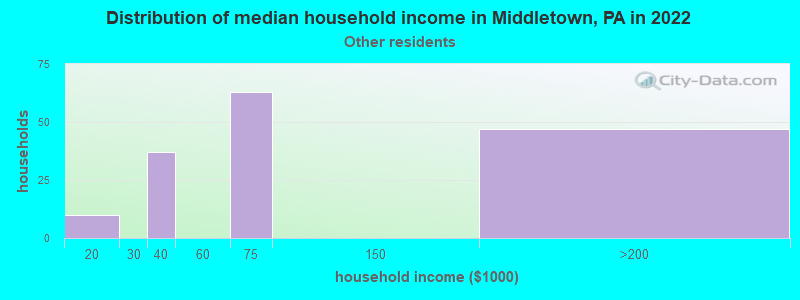
- $92,571Some other race householders
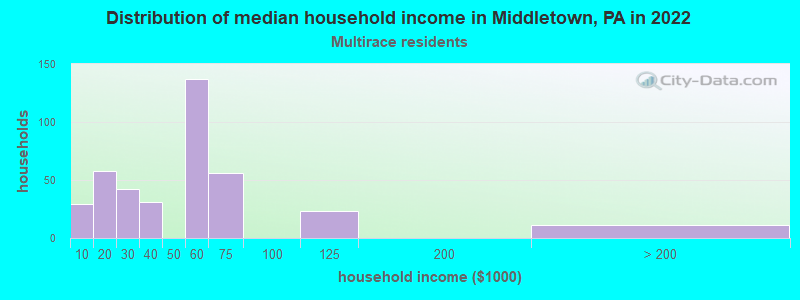
- $40,139Two or more races householders
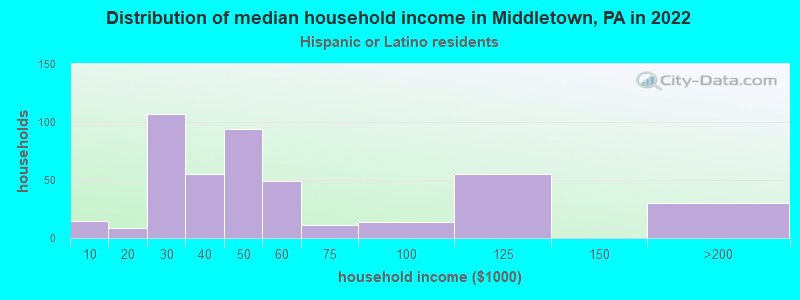
- $44,735Hispanic or Latino race householders
- Median 2022 house value
- $156,393White Non-Hispanic householders
- $171,049Black or African American householders
- $102,035American Indian or Alaska Native householders
- $139,139Asian householders
- $157,691Two or more races householders
- $157,691Hispanic or Latino householders
Household income for White non-Hispanic householders
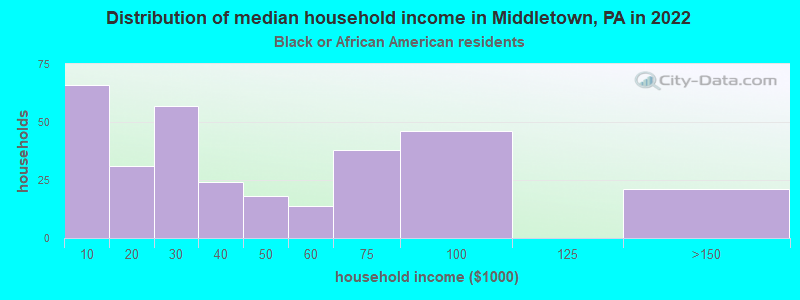
Household income for Black householders
Household income for Asian householders
Household income for Some other race householders
Household income for Two or more races householders
Household income for Hispanic or Latino race householders
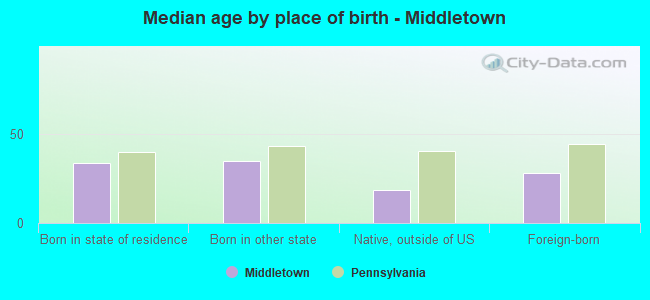
Median age by race in Middletown
- 37.6Median age for White residents
- 34.6Males
- 39.3Females
- 25.0Median age for Black or African American residents
- 19.5Males
- 32.5Females
- -465,804,066.1Median age for American Indian / Alaska Native residents
- -964,080,458.8Males
- -577,519,379.3Females
- 24.8Median age for Asian residents
- 21.2Males
- 42.5Females
- -680,432,644.4Median age for Native Hawaiian / Pacific Islander residents
- -649,523,808.9Males
- -747,474,746.7Females
- 21.8Median age for Other race residents
- 29.7Males
- 21.0Females
- 26.0Median age for Two or more races residents
- 31.6Males
- 20.7Females
- 38.6Median age for White alone residents
- 35.1Males
- 41.3Females
- 25.4Median age for Hispanic or Latino residents
- 26.4Males
- 24.8Females
Owner/renter occupied households by race in Middletown
- House owners and renters - White residents
- 1,76850.6%Owner occupied
- 1,72549.4%Renter occupied
- House owners and renters - Black or African American residents
- 3812.2%Owner occupied
- 27587.8%Renter occupied
- House owners and renters - Asian residents
- 5030.6%Owner occupied
- 11369.4%Renter occupied
- House owners and renters - Other race residents
- 214100.0%Renter occupied
- House owners and renters - Two or more races residents
- 8923.9%Owner occupied
- 28376.1%Renter occupied
- House owners and renters - White alone residents
- 1,78152.2%Owner occupied
- 1,62847.8%Renter occupied
- House owners and renters - Hispanic or Latino residents
- 71.6%Owner occupied
- 40698.4%Renter occupied
Language usage in Middletown
- English speakers - Total
- 88.2% of residents of Middletown speak English at home.
- 4.8% of residents speak Spanish at home
- 38691.0%Speak English very well
- 389.0%Speak English less than very well
- 6.6% of residents speak other language at home
- 38866.3%Speak English very well
- 19733.7%Speak English less than very well
- English speakers - Born in the United States
- 90.4% of residents of Middletown speak English at home.
- 11.3% of residents speak Spanish at home
- 19399.0%Speak English very well
- 21.0%Speak English less than very well
- English speakers - Native, born elsewhere
- 70.3% of residents of Middletown speak English at home.
- 30.7% of residents speak Spanish at home
- 9276.7%Speak English very well
- 2823.3%Speak English less than very well
- English speakers - Foreign-born
- 45.7% of residents of Middletown speak English at home.
- 59.3% of residents speak other language at home
- 32665.6%Speak English very well
- 17134.4%Speak English less than very well
White (Caucasian) - Speak only English
| Native: | 97.8% (6,348) |
| Foreign-born: | 21.4% (26) |
White (Caucasian) - Speak another language
| Native: | 2.2% (145) |
| Foreign-born: | 69.5% (84) |
Black or African American - Speak only English
| Native: | 92.8% (617) |
| Foreign-born: | 69.2% (93) |
Black or African American - Speak another language
| Native: | 11.3% (75) |
| Foreign-born: | 31.6% (42) |
Asian - Speak only English
| Native: | 100.0% (24) |
| Foreign-born: | 6.5% (21) |
Other race - Speak only English
| Native: | 29.1% (25) |
| Foreign-born: | 69.5% (199) |
White alone - Speak only English
| Native: | 98.7% (6,214) |
| Foreign-born: | 19.2% (28) |
White alone - Speak another language
| Native: | 1.3% (82) |
| Foreign-born: | 70.4% (101) |
Hispanic or Latino - Speak only English
| Native: | 45.4% (341) |
| Foreign-born: | 100.0% (45) |
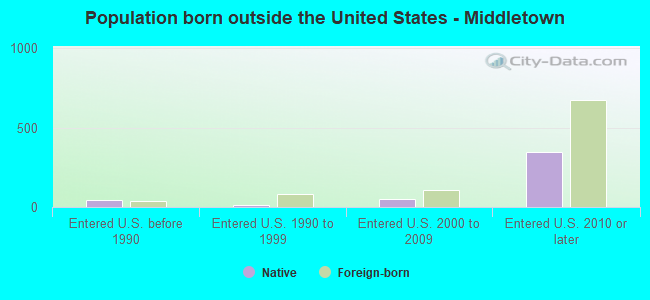
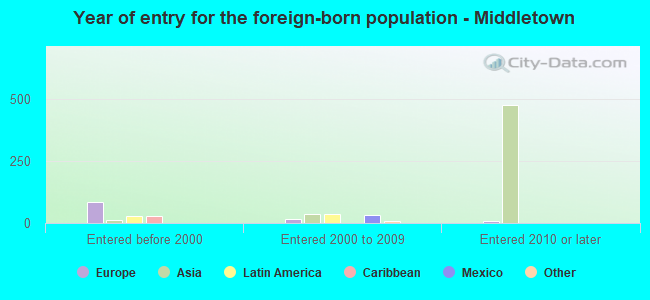
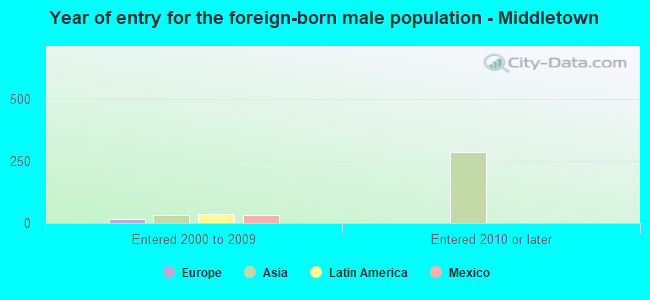
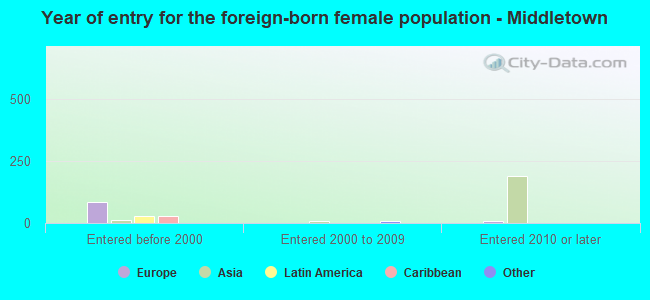
Foreign-born residents in Middletown
714 residents are foreign born (5.2% Asia, 1.2% Europe).
| This city: | 7.4% |
| Pennsylvania: | 7.3% |

Marital status for residents in Middletown
Marital status - White (Caucasian) population 15 years and over
- Males
- 34.1%Never married
- 41.3%Now married
- 5.5%Separated
- 5.7%Widowed
- 13.4%Divorced
- Females
- 38.1%Never married
- 31.8%Now married
- 0.9%Separated
- 10.6%Widowed
- 18.6%Divorced
Women who gave birth in the past 12 months
| Now married: | 100.0% (47) |
| Unmarried: | 0.0% (0) |
Women who did not give birth in the past 12 months
| Now married: | 29.0% (519) |
| Unmarried: | 71.0% (1,271) |
Marital status - Black or African American population 15 years and over
- Males
- 50.0%Never married
- 39.4%Now married
- 0.0%Separated
- 0.0%Widowed
- 10.6%Divorced
- Females
- 52.0%Never married
- 31.1%Now married
- 8.7%Separated
- 1.6%Widowed
- 6.6%Divorced
Women who did not give birth in the past 12 months
| Now married: | 29.7% (90) |
| Unmarried: | 70.3% (214) |
Marital status - Asian population 15 years and over
- Males
- 61.8%Never married
- 38.2%Now married
- 0.0%Separated
- 0.0%Widowed
- 0.0%Divorced
- Females
- 36.9%Never married
- 62.3%Now married
- 0.0%Separated
- 0.8%Widowed
- 0.0%Divorced
Women who gave birth in the past 12 months
| Now married: | 42.9% (4) |
| Unmarried: | 57.1% (5) |
Women who did not give birth in the past 12 months
| Now married: | 59.8% (71) |
| Unmarried: | 40.2% (48) |
Marital status - Other race population 15 years and over
- Males
- 56.4%Never married
- 43.6%Now married
- 0.0%Separated
- 0.0%Widowed
- 0.0%Divorced
- Females
- 34.6%Never married
- 56.1%Now married
- 0.0%Separated
- 0.0%Widowed
- 9.3%Divorced
Women who did not give birth in the past 12 months
| Now married: | 0.0% (0) |
| Unmarried: | 100.0% (46) |
Marital status - Two or more races population 15 years and over
- Males
- 64.1%Never married
- 4.3%Now married
- 0.0%Separated
- 3.8%Widowed
- 27.8%Divorced
- Females
- 58.1%Never married
- 18.8%Now married
- 8.1%Separated
- 10.1%Widowed
- 5.0%Divorced
Women who did not give birth in the past 12 months
| Now married: | 19.9% (54) |
| Unmarried: | 80.1% (219) |
Marital status - White alone, not Hispanic / Latino population 15 years and over
- Males
- 34.3%Never married
- 40.9%Now married
- 5.7%Separated
- 5.9%Widowed
- 13.3%Divorced
- Females
- 37.7%Never married
- 31.7%Now married
- 0.9%Separated
- 11.1%Widowed
- 18.6%Divorced
Women who did not give birth in the past 12 months
| Now married: | 30.5% (536) |
| Unmarried: | 69.5% (1,221) |
Marital status - Hispanic or Latino population 15 years and over
- Males
- 73.2%Never married
- 21.2%Now married
- 0.0%Separated
- 0.0%Widowed
- 5.6%Divorced
- Females
- 58.8%Never married
- 21.7%Now married
- 6.1%Separated
- 0.0%Widowed
- 13.3%Divorced
Women who gave birth in the past 12 months
| Now married: | 100.0% (51) |
| Unmarried: | 0.0% (0) |
Women who did not give birth in the past 12 months
| Now married: | 10.1% (29) |
| Unmarried: | 89.9% (260) |
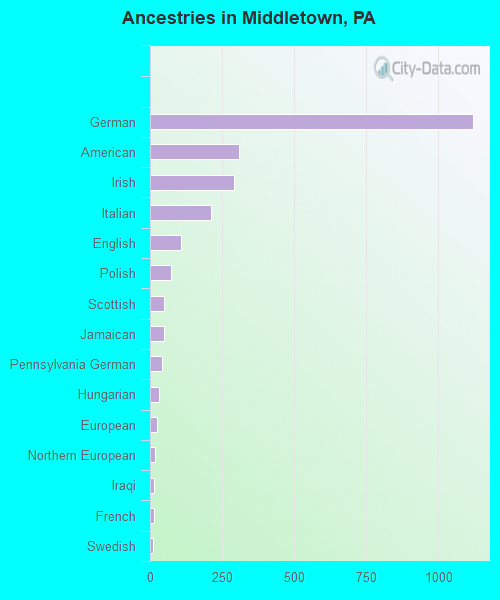
Ancestries in Middletown

- 1,12031.1%German
- 3088.5%American
- 2928.1%Irish
- 2135.9%Italian
- 1093.0%English
- 732.0%Polish
- 491.4%Scottish
- 471.3%Jamaican
- 431.2%Pennsylvania German
- 300.8%Hungarian
- 260.7%European
- 190.5%Northern European
- 150.4%Iraqi
- 150.4%French
- 110.3%Swedish
- 100.3%Scandinavian
- 90.2%British
- 90.2%French Canadian
- 80.2%Czechoslovakian
- 70.2%Welsh
- 40.1%Slovak
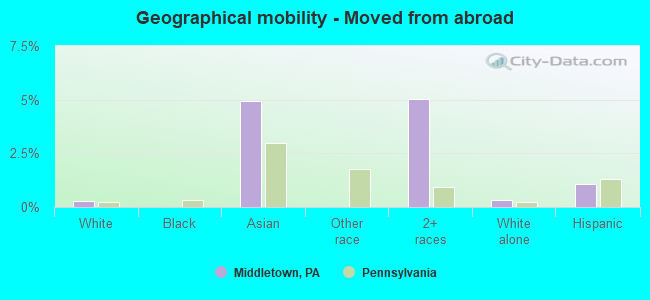
Geographical mobility in Middletown

- Same house 1 year ago
- 5,79482.7%White (Caucasian)
- 77788.9%Black or African American
- 22165.1%Asian
- 24766.9%Other race
- 77985.5%Two or more races
- 5,75984.7%White alone, not Hispanic / Latino
- 57060.0%Hispanic or Latino

-
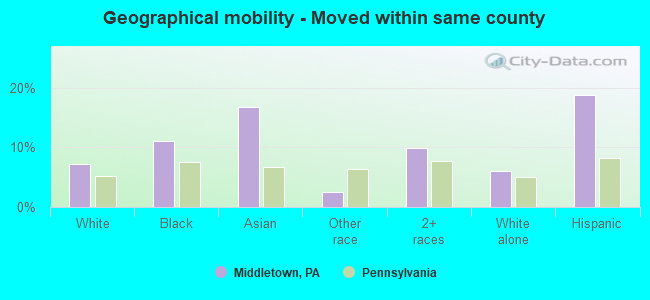
- Moved within same county
- 5007.1%White / Caucasian
- 9711.1%Black or African American
- 5716.8%Asian
- 92.5%Other race
- 909.9%Two or more races
- 4086.0%White alone, not Hispanic / Latino
- 17918.8%Hispanic or Latino
-
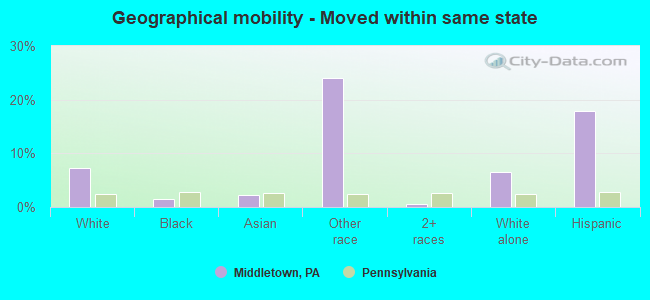
- Moved within same state
- 5057.2%White / Caucasian
- 131.5%Black or African American
- 72.2%Asian
- 8924.1%Other race
- 60.7%Two or more races
- 4376.4%White alone, not Hispanic / Latino
- 17017.9%Hispanic or Latino
-
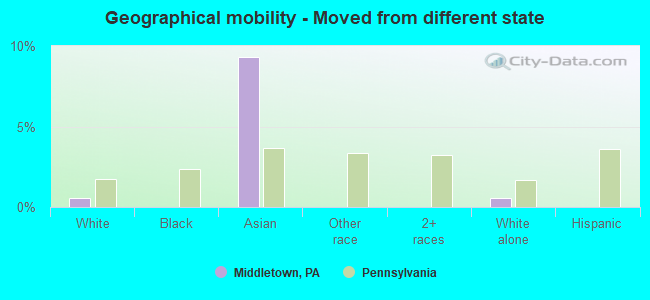
- Moved from different state
- 370.5%White / Caucasian
- 329.3%Asian
- 390.6%White alone, not Hispanic / Latino
-
- Moved from abroad
- 180.3%White
- 174.9%Asian
- 465.0%Two or more races
- 230.3%White alone, not Hispanic / Latino
- 101.1%Hispanic or Latino
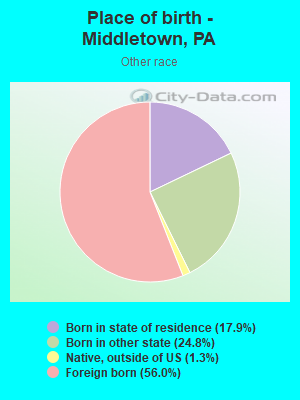
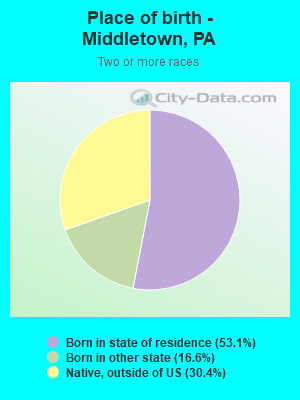
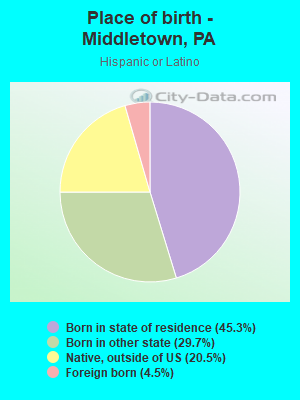
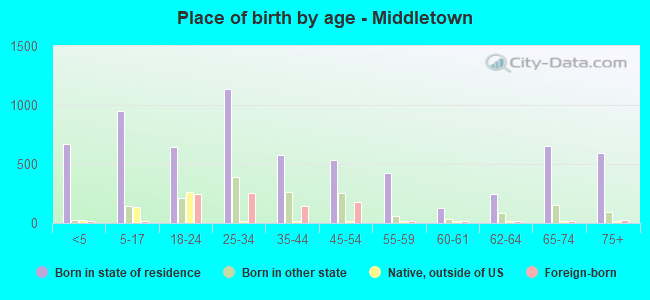
Children Nativity (place of birth) in Middletown
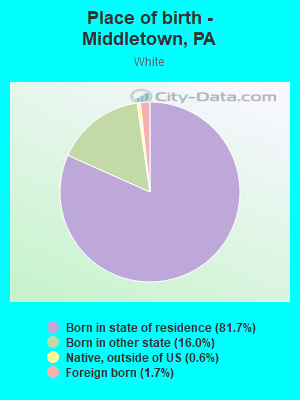
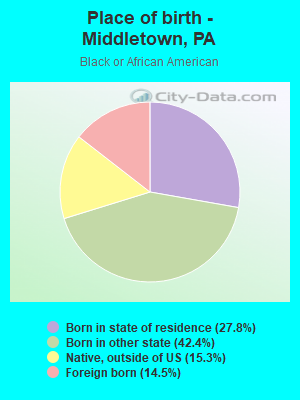
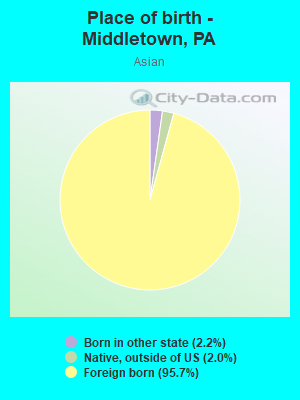
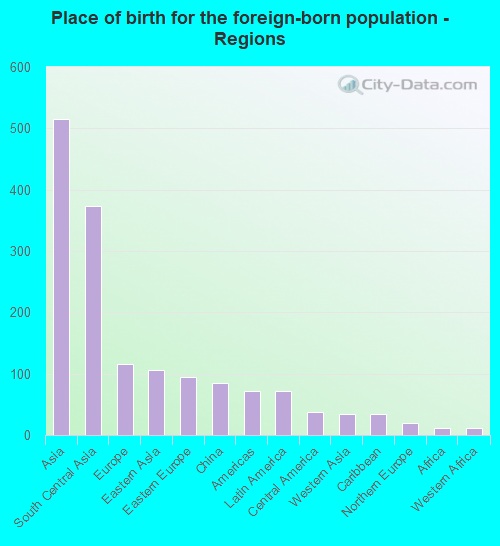
Place of birth for residents in Middletown
![Place of birth for the foreign-born population - Regions]()
- 515Asia
- 373South Central Asia
- 116Europe
- 106Eastern Asia
- 95Eastern Europe
- 84China
- 71Americas
- 71Latin America
- 37Central America
- 34Western Asia
- 34Caribbean
- 20Northern Europe
- 11Africa
- 11Western Africa
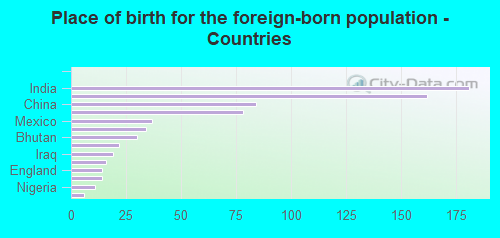
![Place of birth for the foreign-born population - Countries]()
- 181India
- 162Nepal
- 84China
- 78Russia
- 37Mexico
- 34Jamaica
- 30Bhutan
- 22Korea
- 19Iraq
- 16Poland
- 14England
- 14Saudi Arabia
- 11Nigeria
- 6United Kingdom
Grandparents responsible for own grandchildren in Middletown
Zip codes: 17057.