Races in Merrimack, New Hampshire (NH) Detailed Stats
Ancestries, Foreign-born residents, place of birth

Recent posts about races in Merrimack, New Hampshire on our local forum with over 2,400,000 registered users:
 | House to purachase near Merrimack ,NH (3 replies) |
| Possible Relocation to New Hampshire (30 replies) |
| New Hampshire - Who Puts Voting Ballot in Box ? (25 replies) |
| Around 95 up to Portsmouth - Looking to buy a house in good school district 475k (11 replies) |
| live free or die (105 replies) |
| Possible move from NC to NH (10 replies) |
Latest news about races in Merrimack, NH collected exclusively by city-data.com from local newspapers, TV, and radio stations
5.0% of Merrimack, NH residents are foreign-born (1.5% born in Asia, 1.5% born in North America, 1.4% born in Europe), which is about the same as the foreign-born rate of 5.0% across the entire state of New Hampshire.
Race distribution in Merrimack

- 24,03595.7%White alone
- 3771.5%Asian alone
- 2721.1%Hispanic
- 1680.7%Two or more races
- 1810.7%Black alone
- 440.2%American Indian alone
- 320.1%Other race alone
- 100.04%Native Hawaiian and Other
Pacific Islander alone

2000
2022
-
- 1,175,25295.1%White alone
- 20,4891.7%Hispanic
- 15,8031.3%Asian alone
- 11,6060.9%Two or more races
- 8,3540.7%Black alone
- 2,6980.2%American Indian alone
- 1,2540.1%Other race alone
- 3300.03%Native Hawaiian and Other
Pacific Islander alone

-
- 1,208,10186.6%White alone
- 63,4794.5%Hispanic
- 60,7244.4%Two or more races
- 36,5192.6%Asian alone
- 17,9311.3%Black alone
- 6,6150.5%Other race alone
- 1,0140.07%American Indian alone
- 8480.06%Native Hawaiian and Other
Pacific Islander alone

Income and house value in Merrimack
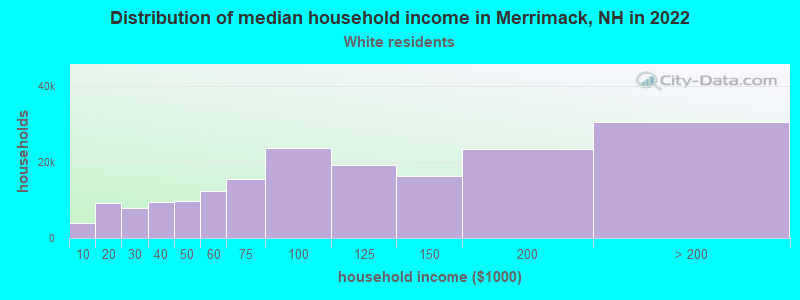
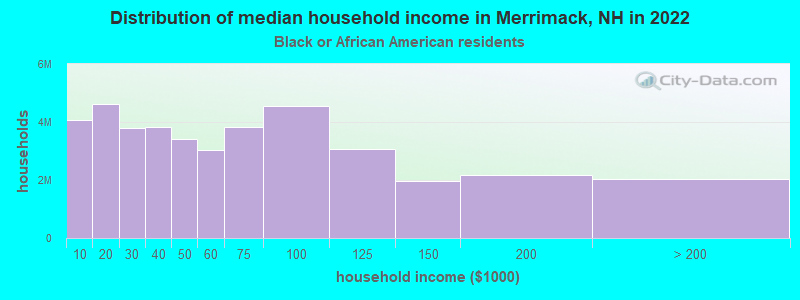
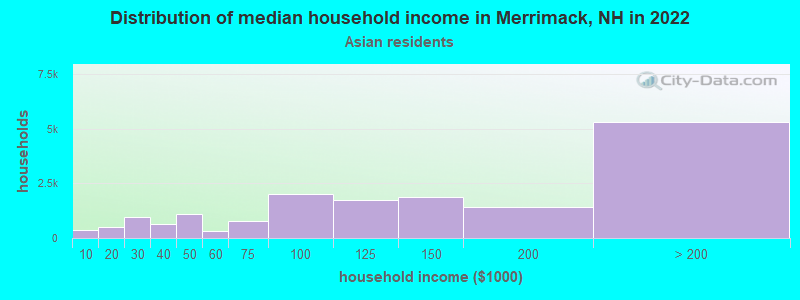
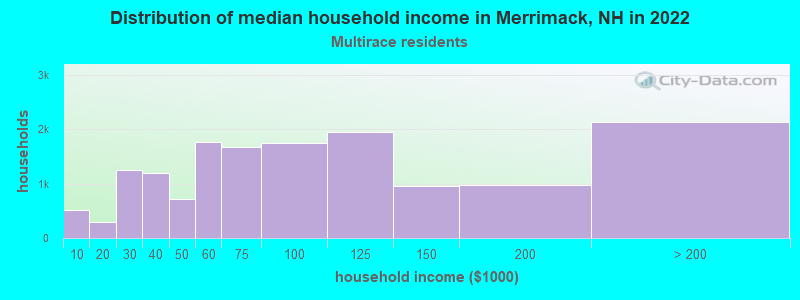
- Median household income in 2022
- $124,162White non-Hispanic householders
- $113,831Black householders
- $161,946Asian householders
- $123,323Some other race householders
- $110,507Two or more races householders
- $176,677Hispanic or Latino race householders
- Median 2022 house value
- $431,258White Non-Hispanic householders
- $444,190Black or African American householders
- $374,418Asian householders
- $285,701Some other race householders
- $291,114Two or more races householders
- $410,507Hispanic or Latino householders
Household income for White non-Hispanic householders
Household income for Black householders
Household income for Asian householders
Household income for Two or more races householders
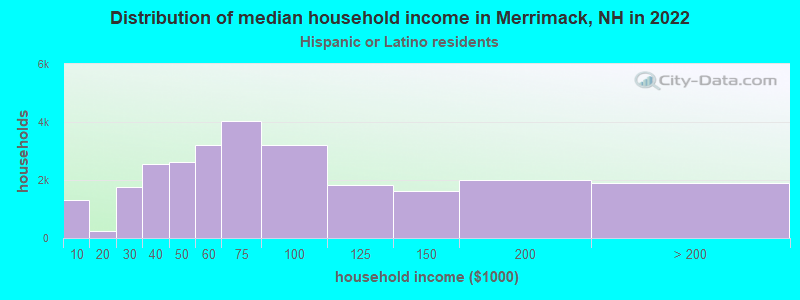
Household income for Hispanic or Latino race householders
Foreign-born residents in Merrimack
1,259 residents are foreign born (1.5% Asia, 1.5% North America, 1.4% Europe).
| This city: | 5.0% |
| New Hampshire: | 4.4% |
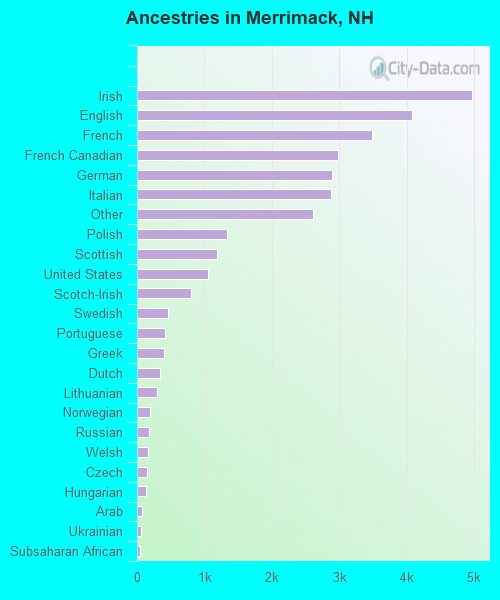
Ancestries in Merrimack

- 4,97415.9%Irish
- 4,08313.0%English
- 3,48111.1%French
- 2,9829.5%French Canadian
- 2,8949.2%German
- 2,8749.2%Italian
- 2,6148.4%Other
- 1,3284.2%Polish
- 1,1843.8%Scottish
- 1,0513.4%United States
- 8052.6%Scotch-Irish
- 4551.5%Swedish
- 4191.3%Portuguese
- 4081.3%Greek
- 3421.1%Dutch
- 2981.0%Lithuanian
- 1930.6%Norwegian
- 1730.6%Russian
- 1620.5%Welsh
- 1410.5%Czech
- 1330.4%Hungarian
- 750.2%Arab
- 630.2%Ukrainian
- 490.2%Subsaharan African
- 370.1%Danish
- 310.10%West Indian
- 300.10%Swiss
- 180.06%Slovak
Zip codes: 03054.