Races in Memphis, Florida (FL) Detailed Stats
Data:
Races - White alone (%)
Races - White alone (% change since 2000)
Races - Black alone (%)
Races - Black alone (% change since 2000)
Races - American Indian alone (%)
Races - American Indian alone (% change since 2000)
Races - Asian alone (%)
Races - Asian alone (% change since 2000)
Races - Hispanic (%)
Races - Hispanic (% change since 2000)
Races - Native Hawaiian and Other Pacific Islander alone (%)
Races - Native Hawaiian and Other Pacific Islander alone (% change since 2000)
Races - Two or more races(%)
Races - Two or more races(% change since 2000)
Races - Other race alone (%)
Races - Other race alone (% change since 2000)
Racial diversity
Place of birth - Born in state of residence (%)
Place of birth - Born in state of residence (%) - White
Place of birth - Born in state of residence (%) - Black or African American
Place of birth - Born in state of residence (%) - Asian
Place of birth - Born in state of residence (%) - Hispanic or Latino
Place of birth - Born in state of residence (%) - American Indian and Alaska Native
Place of birth - Born in state of residence (%) - Multirace
Place of birth - Born in state of residence (%) - Other Race
Place of birth - Born in other state (%)
Place of birth - Born in other state (%) - White
Place of birth - Born in other state (%) - Black or African American
Place of birth - Born in other state (%) - Asian
Place of birth - Born in other state (%) - Hispanic or Latino
Place of birth - Born in other state (%) - American Indian and Alaska Native
Place of birth - Born in other state (%) - Multirace
Place of birth - Born in other state (%) - Other Race
Place of birth - Native, outside of US (%)
Place of birth - Native, outside of US (%) - White
Place of birth - Native, outside of US (%) - Black or African American
Place of birth - Native, outside of US (%) - Asian
Place of birth - Native, outside of US (%) - Hispanic or Latino
Place of birth - Native, outside of US (%) - American Indian and Alaska Native
Place of birth - Native, outside of US (%) - Multirace
Place of birth - Native, outside of US (%) - Other Race
Place of birth - Foreign born (%)
Place of birth - Foreign born (%) - White
Place of birth - Foreign born (%) - Black or African American
Place of birth - Foreign born (%) - Asian
Place of birth - Foreign born (%) - Hispanic or Latino
Place of birth - Foreign born (%) - American Indian and Alaska Native
Place of birth - Foreign born (%) - Multirace
Place of birth - Foreign born (%) - Other Race
Residents speaking English at home (%)
Residents speaking English at home - Born in the United States (%)
Residents speaking English at home - Native, born elsewhere (%)
Residents speaking English at home - Foreign born (%)
Residents speaking Spanish at home (%)
Residents speaking Spanish at home - Born in the United States (%)
Residents speaking Spanish at home - Native, born elsewhere (%)
Residents speaking Spanish at home - Foreign born (%)
Residents speaking other language at home (%)
Residents speaking other language at home - Born in the United States (%)
Residents speaking other language at home - Native, born elsewhere (%)
Residents speaking other language at home - Foreign born (%)
Marital status - Never married (%)
Marital status - Now married (%)
Marital status - Separated (%)
Marital status - Widowed (%)
Marital status - Divorced (%)
Ancestries Reported - Arab (%)
Ancestries Reported - Czech (%)
Ancestries Reported - Danish (%)
Ancestries Reported - Dutch (%)
Ancestries Reported - English (%)
Ancestries Reported - French (%)
Ancestries Reported - French Canadian (%)
Ancestries Reported - German (%)
Ancestries Reported - Greek (%)
Ancestries Reported - Hungarian (%)
Ancestries Reported - Irish (%)
Ancestries Reported - Italian (%)
Ancestries Reported - Lithuanian (%)
Ancestries Reported - Norwegian (%)
Ancestries Reported - Polish (%)
Ancestries Reported - Portuguese (%)
Ancestries Reported - Russian (%)
Ancestries Reported - Scotch-Irish (%)
Ancestries Reported - Scottish (%)
Ancestries Reported - Slovak (%)
Ancestries Reported - Subsaharan African (%)
Ancestries Reported - Swedish (%)
Ancestries Reported - Swiss (%)
Ancestries Reported - Ukrainian (%)
Ancestries Reported - United States (%)
Ancestries Reported - Welsh (%)
Ancestries Reported - West Indian (%)
Ancestries Reported - Other (%)
Geographical mobility - Same house 1 year ago (%)
Geographical mobility - Same house 1 year ago (%) - White
Geographical mobility - Same house 1 year ago (%) - Black or African American
Geographical mobility - Same house 1 year ago (%) - Asian
Geographical mobility - Same house 1 year ago (%) - Hispanic or Latino
Geographical mobility - Same house 1 year ago (%) - American Indian and Alaska Native
Geographical mobility - Same house 1 year ago (%) - Multirace
Geographical mobility - Same house 1 year ago (%) - Other Race
Geographical mobility - Moved within same county (%)
Geographical mobility - Moved within same county (%) - White
Geographical mobility - Moved within same county (%) - Black or African American
Geographical mobility - Moved within same county (%) - Asian
Geographical mobility - Moved within same county (%) - Hispanic or Latino
Geographical mobility - Moved within same county (%) - American Indian and Alaska Native
Geographical mobility - Moved within same county (%) - Multirace
Geographical mobility - Moved within same county (%) - Other Race
Geographical mobility - Moved from different county within same state (%)
Geographical mobility - Moved from different county within same state (%) - White
Geographical mobility - Moved from different county within same state (%) - Black or African American
Geographical mobility - Moved from different county within same state (%) - Asian
Geographical mobility - Moved from different county within same state (%) - Hispanic or Latino
Geographical mobility - Moved from different county within same state (%) - American Indian and Alaska Native
Geographical mobility - Moved from different county within same state (%) - Multirace
Geographical mobility - Moved from different county within same state (%) - Other Race
Geographical mobility - Moved from different state (%)
Geographical mobility - Moved from different state (%) - White
Geographical mobility - Moved from different state (%) - Black or African American
Geographical mobility - Moved from different state (%) - Asian
Geographical mobility - Moved from different state (%) - Hispanic or Latino
Geographical mobility - Moved from different state (%) - American Indian and Alaska Native
Geographical mobility - Moved from different state (%) - Multirace
Geographical mobility - Moved from different state (%) - Other Race
Geographical mobility - Moved from abroad (%)
Geographical mobility - Moved from abroad (%) - White
Geographical mobility - Moved from abroad (%) - Black or African American
Geographical mobility - Moved from abroad (%) - Asian
Geographical mobility - Moved from abroad (%) - Hispanic or Latino
Geographical mobility - Moved from abroad (%) - American Indian and Alaska Native
Geographical mobility - Moved from abroad (%) - Multirace
Geographical mobility - Moved from abroad (%) - Other Race
Place of birth for the foreign-born population - Ireland (%)
Place of birth for the foreign-born population - Denmark (%)
Place of birth for the foreign-born population - Norway (%)
Place of birth for the foreign-born population - Sweden (%)
Place of birth for the foreign-born population - United Kingdom (%)
Place of birth for the foreign-born population - England (%)
Place of birth for the foreign-born population - Scotland (%)
Place of birth for the foreign-born population - Other Northern Europe (%)
Place of birth for the foreign-born population - Austria (%)
Place of birth for the foreign-born population - Belgium (%)
Place of birth for the foreign-born population - France (%)
Place of birth for the foreign-born population - Germany (%)
Place of birth for the foreign-born population - Netherlands (%)
Place of birth for the foreign-born population - Switzerland (%)
Place of birth for the foreign-born population - Other Western Europe (%)
Place of birth for the foreign-born population - Greece (%)
Place of birth for the foreign-born population - Italy (%)
Place of birth for the foreign-born population - Portugal (%)
Place of birth for the foreign-born population - Spain (%)
Place of birth for the foreign-born population - Other Southern Europe (%)
Place of birth for the foreign-born population - Albania (%)
Place of birth for the foreign-born population - Belarus (%)
Place of birth for the foreign-born population - Bosnia and Herzegovina (%)
Place of birth for the foreign-born population - Bulgaria (%)
Place of birth for the foreign-born population - Croatia (%)
Place of birth for the foreign-born population - Czechoslovakia (%)
Place of birth for the foreign-born population - Hungary (%)
Place of birth for the foreign-born population - Latvia (%)
Place of birth for the foreign-born population - Lithuania (%)
Place of birth for the foreign-born population - North Macedonia (Macedonia) (%)
Place of birth for the foreign-born population - Moldova (%)
Place of birth for the foreign-born population - Poland (%)
Place of birth for the foreign-born population - Romania (%)
Place of birth for the foreign-born population - Russia (%)
Place of birth for the foreign-born population - Serbia (%)
Place of birth for the foreign-born population - Ukraine (%)
Place of birth for the foreign-born population - Other Eastern Europe (%)
Place of birth for the foreign-born population - China (%)
Place of birth for the foreign-born population - Hong Kong (%)
Place of birth for the foreign-born population - Taiwan (%)
Place of birth for the foreign-born population - Japan (%)
Place of birth for the foreign-born population - Korea (%)
Place of birth for the foreign-born population - Other Eastern Asia (%)
Place of birth for the foreign-born population - Afghanistan (%)
Place of birth for the foreign-born population - Bangladesh (%)
Place of birth for the foreign-born population - India (%)
Place of birth for the foreign-born population - Iran (%)
Place of birth for the foreign-born population - Kazakhstan (%)
Place of birth for the foreign-born population - Nepal (%)
Place of birth for the foreign-born population - Pakistan (%)
Place of birth for the foreign-born population - Sri Lanka (%)
Place of birth for the foreign-born population - Uzbekistan (%)
Place of birth for the foreign-born population - Other South Central Asia (%)
Place of birth for the foreign-born population - Burma (%)
Place of birth for the foreign-born population - Cambodia (%)
Place of birth for the foreign-born population - Indonesia (%)
Place of birth for the foreign-born population - Laos (%)
Place of birth for the foreign-born population - Malaysia (%)
Place of birth for the foreign-born population - Philippines (%)
Place of birth for the foreign-born population - Singapore (%)
Place of birth for the foreign-born population - Thailand (%)
Place of birth for the foreign-born population - Vietnam (%)
Place of birth for the foreign-born population - Other South Eastern Asia (%)
Place of birth for the foreign-born population - Armenia (%)
Place of birth for the foreign-born population - Iraq (%)
Place of birth for the foreign-born population - Israel (%)
Place of birth for the foreign-born population - Jordan (%)
Place of birth for the foreign-born population - Kuwait (%)
Place of birth for the foreign-born population - Lebanon (%)
Place of birth for the foreign-born population - Saudi Arabia (%)
Place of birth for the foreign-born population - Syria (%)
Place of birth for the foreign-born population - Turkey (%)
Place of birth for the foreign-born population - Yemen (%)
Place of birth for the foreign-born population - Other Western Asia (%)
Place of birth for the foreign-born population - Eritrea (%)
Place of birth for the foreign-born population - Ethiopia (%)
Place of birth for the foreign-born population - Kenya (%)
Place of birth for the foreign-born population - Somalia (%)
Place of birth for the foreign-born population - Uganda (%)
Place of birth for the foreign-born population - Zimbabwe (%)
Place of birth for the foreign-born population - Other Eastern Africa (%)
Place of birth for the foreign-born population - Cameroon (%)
Place of birth for the foreign-born population - Congo (%)
Place of birth for the foreign-born population - Democratic Republic of Congo (Zaire) (%)
Place of birth for the foreign-born population - Other Middle Africa (%)
Place of birth for the foreign-born population - Egypt (%)
Place of birth for the foreign-born population - Morocco (%)
Place of birth for the foreign-born population - Sudan (%)
Place of birth for the foreign-born population - Other Northern Africa (%)
Place of birth for the foreign-born population - South Africa (%)
Place of birth for the foreign-born population - Other Southern Africa (%)
Place of birth for the foreign-born population - Cabo Verde (%)
Place of birth for the foreign-born population - Ghana (%)
Place of birth for the foreign-born population - Liberia (%)
Place of birth for the foreign-born population - Nigeria (%)
Place of birth for the foreign-born population - Senegal (%)
Place of birth for the foreign-born population - Sierra Leone (%)
Place of birth for the foreign-born population - Other Western Africa (%)
Place of birth for the foreign-born population - Australia (%)
Place of birth for the foreign-born population - New Zealand (%)
Place of birth for the foreign-born population - Fiji (%)
Place of birth for the foreign-born population - Micronesia (%)
Place of birth for the foreign-born population - Bahamas (%)
Place of birth for the foreign-born population - Barbados (%)
Place of birth for the foreign-born population - Cuba (%)
Place of birth for the foreign-born population - Dominica (%)
Place of birth for the foreign-born population - Dominican Republic (%)
Place of birth for the foreign-born population - Grenada (%)
Place of birth for the foreign-born population - Haiti (%)
Place of birth for the foreign-born population - Jamaica (%)
Place of birth for the foreign-born population - St. Vincent and the Grenadines (%)
Place of birth for the foreign-born population - Trinidad and Tobago (%)
Place of birth for the foreign-born population - West Indies (%)
Place of birth for the foreign-born population - Other Caribbean (%)
Place of birth for the foreign-born population - Belize (%)
Place of birth for the foreign-born population - Costa Rica (%)
Place of birth for the foreign-born population - El Salvador (%)
Place of birth for the foreign-born population - Guatemala (%)
Place of birth for the foreign-born population - Honduras (%)
Place of birth for the foreign-born population - Mexico (%)
Place of birth for the foreign-born population - Nicaragua (%)
Place of birth for the foreign-born population - Panama (%)
Place of birth for the foreign-born population - Other Central America (%)
Place of birth for the foreign-born population - Argentina (%)
Place of birth for the foreign-born population - Bolivia (%)
Place of birth for the foreign-born population - Brazil (%)
Place of birth for the foreign-born population - Chile (%)
Place of birth for the foreign-born population - Colombia (%)
Place of birth for the foreign-born population - Ecuador (%)
Place of birth for the foreign-born population - Guyana (%)
Place of birth for the foreign-born population - Peru (%)
Place of birth for the foreign-born population - Uruguay (%)
Place of birth for the foreign-born population - Venezuela (%)
Place of birth for the foreign-born population - Other South America (%)
Place of birth for the foreign-born population - Canada (%)
Place of birth for the foreign-born population - Other Northern America (%)
Place of birth for the foreign-born population - Other (%)
affordable housing and rents just took a major hit here (270 replies)Is Sarasota in a bubble (860 replies)Quieter SW coastal towns suggestions (89 replies)Manatee County Fair, Beer & Burger Festival, Antiques Show, Motown, Frankie Valli & more, all this weekend! (0 replies)Motown, Boat & Home Shows, Seafood & Music Festival, Pride in the Park, Drag Racing & more, all this weekend! (8 replies)safe neighborhood for LVNs (18 replies)
Latest news about races in Memphis, FL collected exclusively by city-data.com from local newspapers, TV, and radio stations
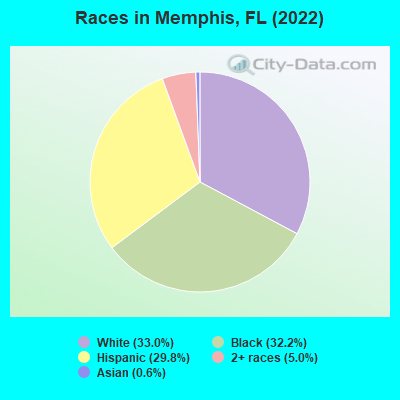
According to 2022 data, the most numerous races in Memphis, FL are White alone (3,820 residents), Hispanic (3,444 residents), and Black alone (3,726 residents). 75.3% of Memphis residents speak English at home. 13.3% of Memphis, FL residents are foreign-born (11.9% born in Latin America), which is 57.7% less than the foreign-born rate of 21.0% across the entire state of Florida.
Race distribution in Memphis
2000 2022
10,458,509 65.4% White alone 2,682,715 16.8% Hispanic 2,264,268 14.2% Black alone 261,693 1.6% Asian alone 236,954 1.5% Two or more races 42,358 0.3% American Indian alone 28,994 0.2% Other race alone 6,887 0.04% Native Hawaiian and Other
11,309,403 50.8% White alone 6,025,039 27.1% Hispanic 3,241,015 14.6% Black alone 861,630 3.9% Two or more races 623,692 2.8% Asian alone 152,054 0.7% Other race alone 22,504 0.1% American Indian alone 9,486 0.04% Native Hawaiian and Other
Income and house value in Memphis Median household income in 2022 $108,280 White non-Hispanic householders$67,606 Black householders$54,645 Two or more races householders$39,788 Hispanic or Latino race householdersMedian 2022 house value $417,197 White Non-Hispanic householders$283,532 Black or African American householders$267,330 Some other race householders$385,693 Two or more races householders$292,533 Hispanic or Latino householders
Median age by race in Memphis
38.2 Median age for White residents39.0 36.9 43.9 Median age for Black or African American residents41.4 43.1 -598,566,307.6 Median age for American Indian / Alaska Native residents-611,418,047.3 -594,925,633.7 32.4 Median age for Asian residents-815,173,526.2 56.1 -679,849,340.2 Median age for Native Hawaiian / Pacific Islander residents-858,307,848.3 -443,298,968.6 18.7 Median age for Other race residents18.5 14.8 24.0 Median age for Two or more races residents21.9 32.4 38.2 Median age for White alone residents38.5 37.7 27.2 Median age for Hispanic or Latino residents27.0 30.2
Owner/renter occupied households by race in Memphis
House owners and renters - White residents 1,542 83.6% Owner occupied301 16.4% Renter occupiedHouse owners and renters - Black or African American residents 681 53.9% Owner occupied583 46.1% Renter occupiedHouse owners and renters - Asian residents 10 100.0% Owner occupiedHouse owners and renters - Other race residents 128 56.9% Owner occupied97 43.1% Renter occupiedHouse owners and renters - Two or more races residents 182 42.1% Owner occupied250 57.9% Renter occupiedHouse owners and renters - White alone residents 1,328 89.8% Owner occupied152 10.2% Renter occupiedHouse owners and renters - Hispanic or Latino residents 424 52.0% Owner occupied391 48.0% Renter occupied
Language usage in Memphis
English speakers - Total 75.3% of residents of Memphis speak English at home.
21.6% of residents speak Spanish at home 1,603 67.2% Speak English very well783 32.8% Speak English less than very well2.0% of residents speak other language at home 207 95.0% Speak English very well11 5.0% Speak English less than very well
English speakers - Born in the United States 83.5% of residents of Memphis speak English at home.
12.9% of residents speak Spanish at home 274 79.9% Speak English very well69 20.1% Speak English less than very well1.7% of residents speak other language at home 45 100.0% Speak English very well
English speakers - Native, born elsewhere 76.5% of residents of Memphis speak English at home.
37.3% of residents speak Spanish at home 57 100.0% Speak English less than very well
English speakers - Foreign-born 24.0% of residents of Memphis speak English at home.
58.3% of residents speak Spanish at home 514 58.7% Speak English very well361 41.3% Speak English less than very well11.1% of residents speak other language at home 154 92.8% Speak English very well12 7.2% Speak English less than very well
White (Caucasian) - Speak only English Native:
82.6% (3,635)Foreign-born:
9.1% (46)
White (Caucasian) - Speak another language Native:
12.4% (547)Foreign-born:
77.1% (390)
Black or African American - Speak only English Native:
95.9% (3,294)Foreign-born:
46.5% (116)
Asian - Speak another language Native:
100.0% (45)Foreign-born:
75.1% (21)
Other race - Speak only English Native:
21.1% (111)Foreign-born:
19.3% (100)
Other race - Speak another language Native:
75.7% (400)Foreign-born:
81.6% (422)
Two or more races - Speak another language Native:
27.0% (372)Foreign-born:
96.5% (236)
White alone - Speak another language Native:
1.5% (51)Foreign-born:
100.0% (148)
Hispanic or Latino - Speak only English Native:
33.7% (733)Foreign-born:
23.4% (252)
Hispanic or Latino - Speak another language Native:
62.4% (1,355)Foreign-born:
82.0% (885)
Foreign-born residents in Memphis 1,541 residents are foreign born (11.9% Latin America ).
This city:
13.3%Florida:
21.1%
Marital status for residents in Memphis Marital status - White (Caucasian) population 15 years and over
Males 27.1% Never married64.9% Now married0.0% Separated0.0% Widowed8.1% DivorcedFemales 25.0% Never married57.5% Now married3.4% Separated4.5% Widowed9.6% DivorcedWomen who gave birth in the past 12 months Now married:
60.0% (55)Unmarried:
40.0% (37)
Women who did not give birth in the past 12 months Now married:
61.8% (716)Unmarried:
38.2% (442)
Marital status - Black or African American population 15 years and over
Males 63.6% Never married21.4% Now married0.0% Separated1.4% Widowed13.6% DivorcedFemales 56.6% Never married23.4% Now married4.4% Separated11.6% Widowed3.9% DivorcedWomen who did not give birth in the past 12 months Now married:
18.1% (164)Unmarried:
81.9% (743)
Marital status - Asian population 15 years and over
Males 79.5% Never married20.5% Now married0.0% Separated0.0% Widowed0.0% DivorcedFemales 0.0% Never married100.0% Now married0.0% Separated0.0% Widowed0.0% DivorcedWomen who did not give birth in the past 12 months Now married:
100.0% (7)Unmarried:
0.0% (0)
Marital status - Other race population 15 years and over
Males 39.9% Never married53.0% Now married0.0% Separated0.0% Widowed7.1% DivorcedFemales 18.5% Never married60.8% Now married0.0% Separated0.0% Widowed20.7% DivorcedWomen who gave birth in the past 12 months Now married:
100.0% (68)Unmarried:
0.0% (0)
Women who did not give birth in the past 12 months Now married:
42.5% (68)Unmarried:
57.5% (92)
Marital status - Two or more races population 15 years and over
Males 33.6% Never married50.5% Now married5.7% Separated10.2% Widowed0.0% DivorcedFemales 34.5% Never married65.5% Now married0.0% Separated0.0% Widowed0.0% DivorcedWomen who did not give birth in the past 12 months Now married:
63.3% (162)Unmarried:
36.7% (94)
Marital status - White alone, not Hispanic / Latino population 15 years and over
Males 20.1% Never married69.4% Now married0.0% Separated0.0% Widowed10.5% DivorcedFemales 19.7% Never married58.1% Now married4.6% Separated6.0% Widowed11.6% DivorcedWomen who gave birth in the past 12 months Now married:
81.4% (59)Unmarried:
18.6% (13)
Women who did not give birth in the past 12 months Now married:
67.4% (571)Unmarried:
32.6% (276)
Marital status - Hispanic or Latino population 15 years and over
Males 37.7% Never married53.8% Now married2.0% Separated3.6% Widowed2.8% DivorcedFemales 28.8% Never married64.0% Now married0.0% Separated0.0% Widowed7.2% DivorcedWomen who gave birth in the past 12 months Now married:
68.4% (58)Unmarried:
31.6% (27)
Women who did not give birth in the past 12 months Now married:
59.1% (429)Unmarried:
40.9% (298)
Ancestries in Memphis
390 6.4% West Indian277 4.6% American263 4.3% German234 3.9% English177 2.9% Italian147 2.4% Irish72 1.2% Ukrainian58 1.0% Austrian57 0.9% Jamaican48 0.8% French47 0.8% European33 0.5% Polish19 0.3% Scottish18 0.3% Croatian17 0.3% Dutch9 0.1% Eastern European9 0.1% Scotch-Irish6 0.10% Finnish4 0.07% Norwegian
Geographical mobility in Memphis Same house 1 year ago 4,806 94.9% White (Caucasian)3,134 81.6% Black or African American65 100.0% Asian1,022 84.7% Other race1,545 90.7% Two or more races3,454 92.7% White alone, not Hispanic / Latino3,142 94.2% Hispanic or LatinoMoved within same county 47 0.9% White / Caucasian303 7.9% Black or African American40 3.3% Other race76 4.5% Two or more races51 1.4% White alone, not Hispanic / Latino53 1.6% Hispanic or LatinoMoved within same state 165 3.3% White / Caucasian157 4.1% Black or African American133 11.0% Other race174 4.7% White alone, not Hispanic / Latino128 3.8% Hispanic or LatinoMoved from different state 16 0.3% White / Caucasian116 3.0% Black or African American30 1.7% Two or more races16 0.4% White alone, not Hispanic / Latino
Children Nativity (place of birth) in Memphis
Children under 6 years - Living with two parents Both parents native 194 100.0% NativeOne native, one foreign-born parent 160 100.0% NativeChildren under 6 years - Living with one parent Native parent 185 100.0% NativeForeign-born parent 23 39.5% Native35 60.5% Foreign-bornChildren 6 to 17 years - Living with two parents Both parents native 616 97.4% Native16 2.6% Foreign-bornBoth parents foreign-born 315 100.0% NativeOne native, one foreign-born parent 249 86.5% Native39 13.5% Foreign-bornChildren 6 to 17 years - Living with one parent Native parent 634 100.0% NativeForeign-born parent 111 60.6% Native72 39.4% Foreign-born
Grandparents responsible for own grandchildren in Memphis
Grandparents (30 to 59 years) White / Caucasian 67 100.0% Not responsible for grandchildrenBlack or African American 156 100.0% Not responsible for grandchildrenAsian 11 100.0% Responsible for grandchildrenWhite alone, not Hispanic / Latino 22 100.0% Not responsible for grandchildrenHispanic or Latino 56 100.0% Not responsible for grandchildren
Grandparents (60 years and over) White / Caucasian 17 100.0% Not responsible for grandchildrenWhite alone, not Hispanic / Latino 18 100.0% Not responsible for grandchildren