Races in Melbourne Shores-Floridana Beach, Florida (FL) Detailed Stats
Ancestries, Foreign-born residents, place of birth
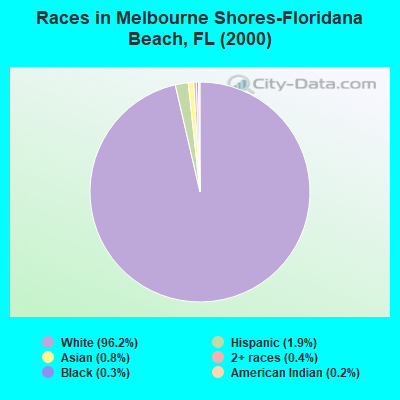
Race distribution in Melbourne Shores-Floridana Beach

- 6,28896.2%White alone
- 1271.9%Hispanic
- 550.8%Asian alone
- 270.4%Two or more races
- 190.3%Black alone
- 100.2%American Indian alone
- 40.06%Native Hawaiian and Other
Pacific Islander alone - 30.05%Other race alone
2000
2022
-
- 10,458,50965.4%White alone
- 2,682,71516.8%Hispanic
- 2,264,26814.2%Black alone
- 261,6931.6%Asian alone
- 236,9541.5%Two or more races
- 42,3580.3%American Indian alone
- 28,9940.2%Other race alone
- 6,8870.04%Native Hawaiian and Other
Pacific Islander alone

-
- 11,309,40350.8%White alone
- 6,025,03927.1%Hispanic
- 3,241,01514.6%Black alone
- 861,6303.9%Two or more races
- 623,6922.8%Asian alone
- 152,0540.7%Other race alone
- 22,5040.1%American Indian alone
- 9,4860.04%Native Hawaiian and Other
Pacific Islander alone

Income and house value in Melbourne Shores-Floridana Beach
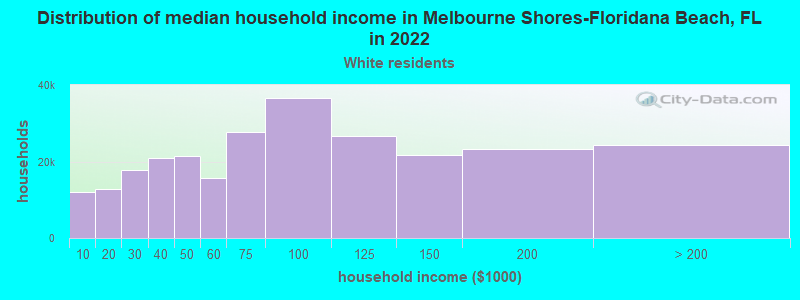
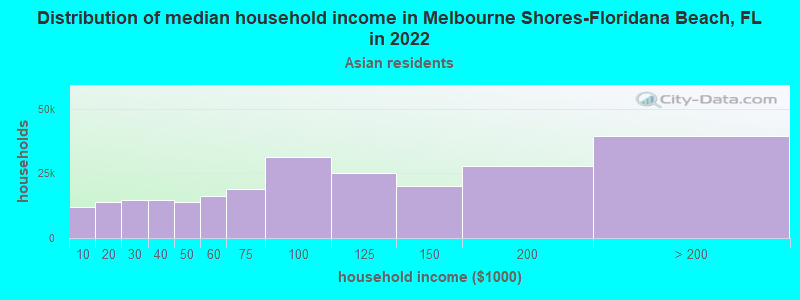
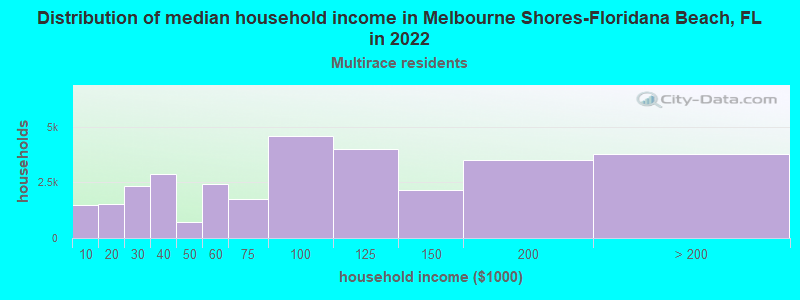
- Median household income in 2022
- $97,292White non-Hispanic householders
- over $200,000Asian householders
- $140,119Some other race householders
- $153,572Two or more races householders
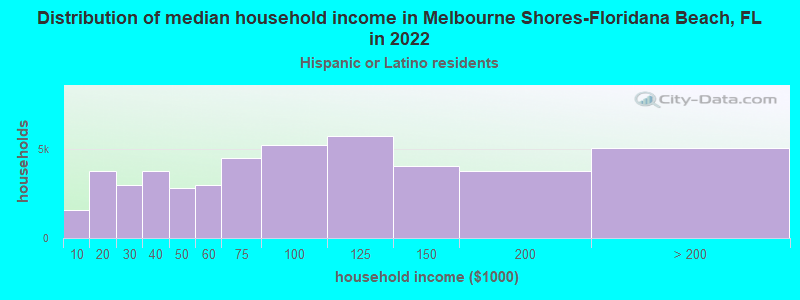
- $153,026Hispanic or Latino race householders
- Median 2022 house value
- $665,910White Non-Hispanic householders
- $720,890Asian householders
- $528,652Some other race householders
- $211,461Two or more races householders
- $413,310Hispanic or Latino householders
Household income for White non-Hispanic householders
Household income for Asian householders
Household income for Two or more races householders
Household income for Hispanic or Latino race householders
Zip code: 32951