Races in Meadow Woods, Florida (FL) Detailed Stats
Data:
Races - White alone (%)
Races - White alone (% change since 2000)
Races - Black alone (%)
Races - Black alone (% change since 2000)
Races - American Indian alone (%)
Races - American Indian alone (% change since 2000)
Races - Asian alone (%)
Races - Asian alone (% change since 2000)
Races - Hispanic (%)
Races - Hispanic (% change since 2000)
Races - Native Hawaiian and Other Pacific Islander alone (%)
Races - Native Hawaiian and Other Pacific Islander alone (% change since 2000)
Races - Two or more races(%)
Races - Two or more races(% change since 2000)
Races - Other race alone (%)
Races - Other race alone (% change since 2000)
Racial diversity
Place of birth - Born in state of residence (%)
Place of birth - Born in state of residence (%) - White
Place of birth - Born in state of residence (%) - Black or African American
Place of birth - Born in state of residence (%) - Asian
Place of birth - Born in state of residence (%) - Hispanic or Latino
Place of birth - Born in state of residence (%) - American Indian and Alaska Native
Place of birth - Born in state of residence (%) - Multirace
Place of birth - Born in state of residence (%) - Other Race
Place of birth - Born in other state (%)
Place of birth - Born in other state (%) - White
Place of birth - Born in other state (%) - Black or African American
Place of birth - Born in other state (%) - Asian
Place of birth - Born in other state (%) - Hispanic or Latino
Place of birth - Born in other state (%) - American Indian and Alaska Native
Place of birth - Born in other state (%) - Multirace
Place of birth - Born in other state (%) - Other Race
Place of birth - Native, outside of US (%)
Place of birth - Native, outside of US (%) - White
Place of birth - Native, outside of US (%) - Black or African American
Place of birth - Native, outside of US (%) - Asian
Place of birth - Native, outside of US (%) - Hispanic or Latino
Place of birth - Native, outside of US (%) - American Indian and Alaska Native
Place of birth - Native, outside of US (%) - Multirace
Place of birth - Native, outside of US (%) - Other Race
Place of birth - Foreign born (%)
Place of birth - Foreign born (%) - White
Place of birth - Foreign born (%) - Black or African American
Place of birth - Foreign born (%) - Asian
Place of birth - Foreign born (%) - Hispanic or Latino
Place of birth - Foreign born (%) - American Indian and Alaska Native
Place of birth - Foreign born (%) - Multirace
Place of birth - Foreign born (%) - Other Race
Residents speaking English at home (%)
Residents speaking English at home - Born in the United States (%)
Residents speaking English at home - Native, born elsewhere (%)
Residents speaking English at home - Foreign born (%)
Residents speaking Spanish at home (%)
Residents speaking Spanish at home - Born in the United States (%)
Residents speaking Spanish at home - Native, born elsewhere (%)
Residents speaking Spanish at home - Foreign born (%)
Residents speaking other language at home (%)
Residents speaking other language at home - Born in the United States (%)
Residents speaking other language at home - Native, born elsewhere (%)
Residents speaking other language at home - Foreign born (%)
Marital status - Never married (%)
Marital status - Now married (%)
Marital status - Separated (%)
Marital status - Widowed (%)
Marital status - Divorced (%)
Ancestries Reported - Arab (%)
Ancestries Reported - Czech (%)
Ancestries Reported - Danish (%)
Ancestries Reported - Dutch (%)
Ancestries Reported - English (%)
Ancestries Reported - French (%)
Ancestries Reported - French Canadian (%)
Ancestries Reported - German (%)
Ancestries Reported - Greek (%)
Ancestries Reported - Hungarian (%)
Ancestries Reported - Irish (%)
Ancestries Reported - Italian (%)
Ancestries Reported - Lithuanian (%)
Ancestries Reported - Norwegian (%)
Ancestries Reported - Polish (%)
Ancestries Reported - Portuguese (%)
Ancestries Reported - Russian (%)
Ancestries Reported - Scotch-Irish (%)
Ancestries Reported - Scottish (%)
Ancestries Reported - Slovak (%)
Ancestries Reported - Subsaharan African (%)
Ancestries Reported - Swedish (%)
Ancestries Reported - Swiss (%)
Ancestries Reported - Ukrainian (%)
Ancestries Reported - United States (%)
Ancestries Reported - Welsh (%)
Ancestries Reported - West Indian (%)
Ancestries Reported - Other (%)
Geographical mobility - Same house 1 year ago (%)
Geographical mobility - Same house 1 year ago (%) - White
Geographical mobility - Same house 1 year ago (%) - Black or African American
Geographical mobility - Same house 1 year ago (%) - Asian
Geographical mobility - Same house 1 year ago (%) - Hispanic or Latino
Geographical mobility - Same house 1 year ago (%) - American Indian and Alaska Native
Geographical mobility - Same house 1 year ago (%) - Multirace
Geographical mobility - Same house 1 year ago (%) - Other Race
Geographical mobility - Moved within same county (%)
Geographical mobility - Moved within same county (%) - White
Geographical mobility - Moved within same county (%) - Black or African American
Geographical mobility - Moved within same county (%) - Asian
Geographical mobility - Moved within same county (%) - Hispanic or Latino
Geographical mobility - Moved within same county (%) - American Indian and Alaska Native
Geographical mobility - Moved within same county (%) - Multirace
Geographical mobility - Moved within same county (%) - Other Race
Geographical mobility - Moved from different county within same state (%)
Geographical mobility - Moved from different county within same state (%) - White
Geographical mobility - Moved from different county within same state (%) - Black or African American
Geographical mobility - Moved from different county within same state (%) - Asian
Geographical mobility - Moved from different county within same state (%) - Hispanic or Latino
Geographical mobility - Moved from different county within same state (%) - American Indian and Alaska Native
Geographical mobility - Moved from different county within same state (%) - Multirace
Geographical mobility - Moved from different county within same state (%) - Other Race
Geographical mobility - Moved from different state (%)
Geographical mobility - Moved from different state (%) - White
Geographical mobility - Moved from different state (%) - Black or African American
Geographical mobility - Moved from different state (%) - Asian
Geographical mobility - Moved from different state (%) - Hispanic or Latino
Geographical mobility - Moved from different state (%) - American Indian and Alaska Native
Geographical mobility - Moved from different state (%) - Multirace
Geographical mobility - Moved from different state (%) - Other Race
Geographical mobility - Moved from abroad (%)
Geographical mobility - Moved from abroad (%) - White
Geographical mobility - Moved from abroad (%) - Black or African American
Geographical mobility - Moved from abroad (%) - Asian
Geographical mobility - Moved from abroad (%) - Hispanic or Latino
Geographical mobility - Moved from abroad (%) - American Indian and Alaska Native
Geographical mobility - Moved from abroad (%) - Multirace
Geographical mobility - Moved from abroad (%) - Other Race
Place of birth for the foreign-born population - Ireland (%)
Place of birth for the foreign-born population - Denmark (%)
Place of birth for the foreign-born population - Norway (%)
Place of birth for the foreign-born population - Sweden (%)
Place of birth for the foreign-born population - United Kingdom (%)
Place of birth for the foreign-born population - England (%)
Place of birth for the foreign-born population - Scotland (%)
Place of birth for the foreign-born population - Other Northern Europe (%)
Place of birth for the foreign-born population - Austria (%)
Place of birth for the foreign-born population - Belgium (%)
Place of birth for the foreign-born population - France (%)
Place of birth for the foreign-born population - Germany (%)
Place of birth for the foreign-born population - Netherlands (%)
Place of birth for the foreign-born population - Switzerland (%)
Place of birth for the foreign-born population - Other Western Europe (%)
Place of birth for the foreign-born population - Greece (%)
Place of birth for the foreign-born population - Italy (%)
Place of birth for the foreign-born population - Portugal (%)
Place of birth for the foreign-born population - Spain (%)
Place of birth for the foreign-born population - Other Southern Europe (%)
Place of birth for the foreign-born population - Albania (%)
Place of birth for the foreign-born population - Belarus (%)
Place of birth for the foreign-born population - Bosnia and Herzegovina (%)
Place of birth for the foreign-born population - Bulgaria (%)
Place of birth for the foreign-born population - Croatia (%)
Place of birth for the foreign-born population - Czechoslovakia (%)
Place of birth for the foreign-born population - Hungary (%)
Place of birth for the foreign-born population - Latvia (%)
Place of birth for the foreign-born population - Lithuania (%)
Place of birth for the foreign-born population - North Macedonia (Macedonia) (%)
Place of birth for the foreign-born population - Moldova (%)
Place of birth for the foreign-born population - Poland (%)
Place of birth for the foreign-born population - Romania (%)
Place of birth for the foreign-born population - Russia (%)
Place of birth for the foreign-born population - Serbia (%)
Place of birth for the foreign-born population - Ukraine (%)
Place of birth for the foreign-born population - Other Eastern Europe (%)
Place of birth for the foreign-born population - China (%)
Place of birth for the foreign-born population - Hong Kong (%)
Place of birth for the foreign-born population - Taiwan (%)
Place of birth for the foreign-born population - Japan (%)
Place of birth for the foreign-born population - Korea (%)
Place of birth for the foreign-born population - Other Eastern Asia (%)
Place of birth for the foreign-born population - Afghanistan (%)
Place of birth for the foreign-born population - Bangladesh (%)
Place of birth for the foreign-born population - India (%)
Place of birth for the foreign-born population - Iran (%)
Place of birth for the foreign-born population - Kazakhstan (%)
Place of birth for the foreign-born population - Nepal (%)
Place of birth for the foreign-born population - Pakistan (%)
Place of birth for the foreign-born population - Sri Lanka (%)
Place of birth for the foreign-born population - Uzbekistan (%)
Place of birth for the foreign-born population - Other South Central Asia (%)
Place of birth for the foreign-born population - Burma (%)
Place of birth for the foreign-born population - Cambodia (%)
Place of birth for the foreign-born population - Indonesia (%)
Place of birth for the foreign-born population - Laos (%)
Place of birth for the foreign-born population - Malaysia (%)
Place of birth for the foreign-born population - Philippines (%)
Place of birth for the foreign-born population - Singapore (%)
Place of birth for the foreign-born population - Thailand (%)
Place of birth for the foreign-born population - Vietnam (%)
Place of birth for the foreign-born population - Other South Eastern Asia (%)
Place of birth for the foreign-born population - Armenia (%)
Place of birth for the foreign-born population - Iraq (%)
Place of birth for the foreign-born population - Israel (%)
Place of birth for the foreign-born population - Jordan (%)
Place of birth for the foreign-born population - Kuwait (%)
Place of birth for the foreign-born population - Lebanon (%)
Place of birth for the foreign-born population - Saudi Arabia (%)
Place of birth for the foreign-born population - Syria (%)
Place of birth for the foreign-born population - Turkey (%)
Place of birth for the foreign-born population - Yemen (%)
Place of birth for the foreign-born population - Other Western Asia (%)
Place of birth for the foreign-born population - Eritrea (%)
Place of birth for the foreign-born population - Ethiopia (%)
Place of birth for the foreign-born population - Kenya (%)
Place of birth for the foreign-born population - Somalia (%)
Place of birth for the foreign-born population - Uganda (%)
Place of birth for the foreign-born population - Zimbabwe (%)
Place of birth for the foreign-born population - Other Eastern Africa (%)
Place of birth for the foreign-born population - Cameroon (%)
Place of birth for the foreign-born population - Congo (%)
Place of birth for the foreign-born population - Democratic Republic of Congo (Zaire) (%)
Place of birth for the foreign-born population - Other Middle Africa (%)
Place of birth for the foreign-born population - Egypt (%)
Place of birth for the foreign-born population - Morocco (%)
Place of birth for the foreign-born population - Sudan (%)
Place of birth for the foreign-born population - Other Northern Africa (%)
Place of birth for the foreign-born population - South Africa (%)
Place of birth for the foreign-born population - Other Southern Africa (%)
Place of birth for the foreign-born population - Cabo Verde (%)
Place of birth for the foreign-born population - Ghana (%)
Place of birth for the foreign-born population - Liberia (%)
Place of birth for the foreign-born population - Nigeria (%)
Place of birth for the foreign-born population - Senegal (%)
Place of birth for the foreign-born population - Sierra Leone (%)
Place of birth for the foreign-born population - Other Western Africa (%)
Place of birth for the foreign-born population - Australia (%)
Place of birth for the foreign-born population - New Zealand (%)
Place of birth for the foreign-born population - Fiji (%)
Place of birth for the foreign-born population - Micronesia (%)
Place of birth for the foreign-born population - Bahamas (%)
Place of birth for the foreign-born population - Barbados (%)
Place of birth for the foreign-born population - Cuba (%)
Place of birth for the foreign-born population - Dominica (%)
Place of birth for the foreign-born population - Dominican Republic (%)
Place of birth for the foreign-born population - Grenada (%)
Place of birth for the foreign-born population - Haiti (%)
Place of birth for the foreign-born population - Jamaica (%)
Place of birth for the foreign-born population - St. Vincent and the Grenadines (%)
Place of birth for the foreign-born population - Trinidad and Tobago (%)
Place of birth for the foreign-born population - West Indies (%)
Place of birth for the foreign-born population - Other Caribbean (%)
Place of birth for the foreign-born population - Belize (%)
Place of birth for the foreign-born population - Costa Rica (%)
Place of birth for the foreign-born population - El Salvador (%)
Place of birth for the foreign-born population - Guatemala (%)
Place of birth for the foreign-born population - Honduras (%)
Place of birth for the foreign-born population - Mexico (%)
Place of birth for the foreign-born population - Nicaragua (%)
Place of birth for the foreign-born population - Panama (%)
Place of birth for the foreign-born population - Other Central America (%)
Place of birth for the foreign-born population - Argentina (%)
Place of birth for the foreign-born population - Bolivia (%)
Place of birth for the foreign-born population - Brazil (%)
Place of birth for the foreign-born population - Chile (%)
Place of birth for the foreign-born population - Colombia (%)
Place of birth for the foreign-born population - Ecuador (%)
Place of birth for the foreign-born population - Guyana (%)
Place of birth for the foreign-born population - Peru (%)
Place of birth for the foreign-born population - Uruguay (%)
Place of birth for the foreign-born population - Venezuela (%)
Place of birth for the foreign-born population - Other South America (%)
Place of birth for the foreign-born population - Canada (%)
Place of birth for the foreign-born population - Other Northern America (%)
Place of birth for the foreign-born population - Other (%)
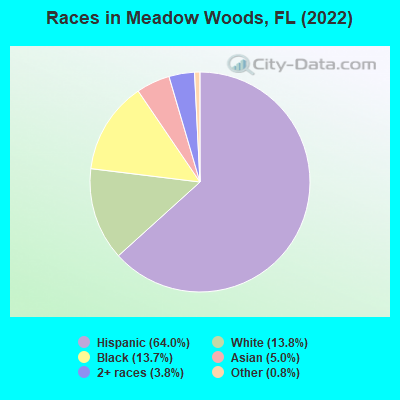
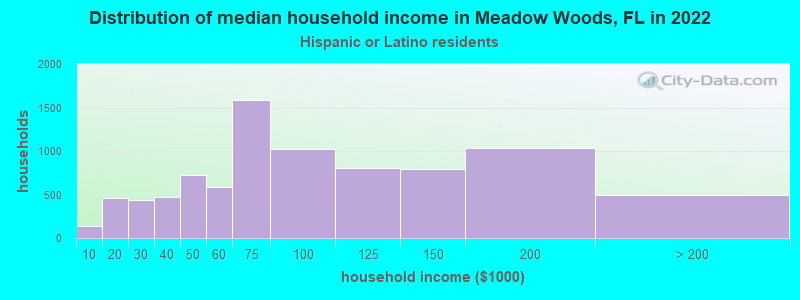
According to 2022 data, the most numerous races in Meadow Woods, FL are White alone (5,942 residents), Hispanic (27,506 residents), and Black alone (5,897 residents). 40.1% of Meadow Woods residents speak English at home. 30.9% of Meadow Woods, FL residents are foreign-born (24.4% born in Latin America, 3.1% born in Asia), which is 32.0% greater than the foreign-born rate of 21.0% across the entire state of Florida.
Race distribution in Meadow Woods
2000 2022
10,458,509 65.4% White alone 2,682,715 16.8% Hispanic 2,264,268 14.2% Black alone 261,693 1.6% Asian alone 236,954 1.5% Two or more races 42,358 0.3% American Indian alone 28,994 0.2% Other race alone 6,887 0.04% Native Hawaiian and Other
11,309,403 50.8% White alone 6,025,039 27.1% Hispanic 3,241,015 14.6% Black alone 861,630 3.9% Two or more races 623,692 2.8% Asian alone 152,054 0.7% Other race alone 22,504 0.1% American Indian alone 9,486 0.04% Native Hawaiian and Other
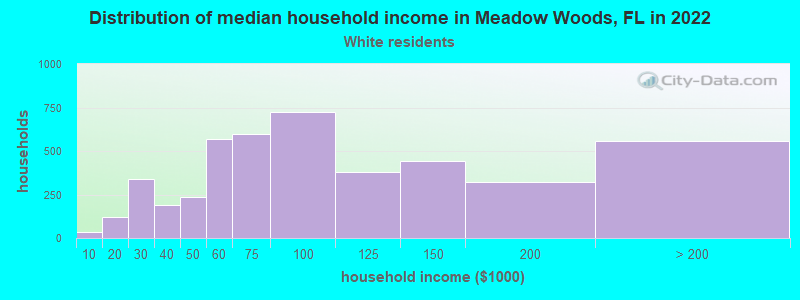
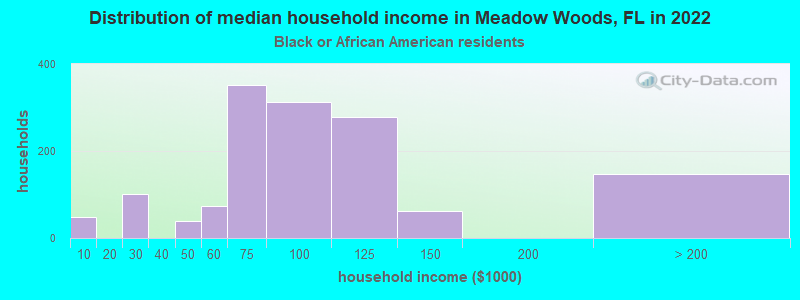
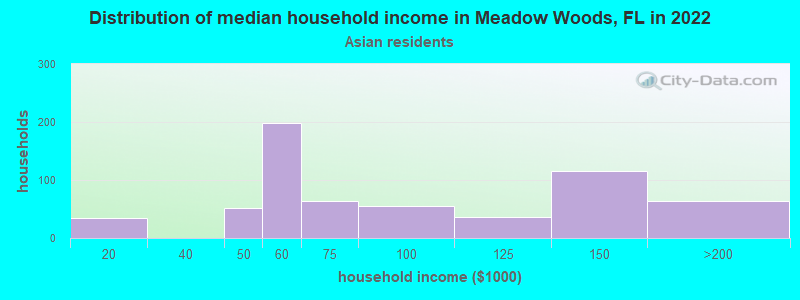
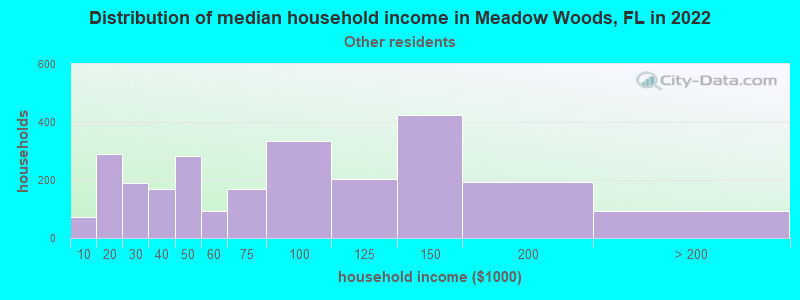
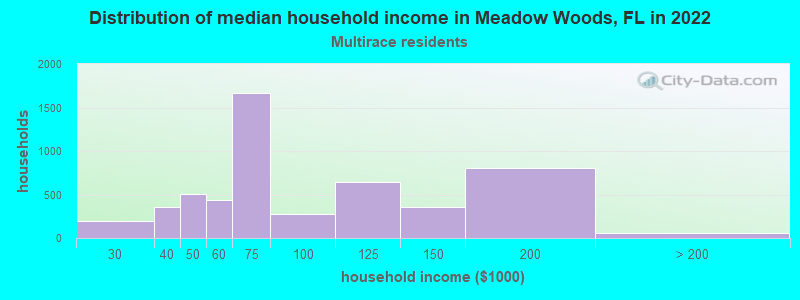
Income and house value in Meadow Woods Median household income in 2022 $71,312 White non-Hispanic householders$87,189 Black householders$86,041 Asian householders$62,850 Some other race householders$70,217 Two or more races householders$74,003 Hispanic or Latino race householdersMedian 2022 house value $350,374 White Non-Hispanic householders$360,603 Black or African American householders $411,022 Asian householders$410,657 Some other race householders$367,180 Two or more races householders$375,583 Hispanic or Latino householders
Median age by race in Meadow Woods
40.0 Median age for White residents41.2 36.7 30.6 Median age for Black or African American residents30.5 31.0 -614,300,100.1 Median age for American Indian / Alaska Native residents-735,632,183.2 -529,680,364.8 34.4 Median age for Asian residents28.4 46.5 -679,790,025.6 Median age for Native Hawaiian / Pacific Islander residents-1,327,635,326.3 -611,111,110.5 47.8 Median age for Other race residents45.6 51.3 34.8 Median age for Two or more races residents34.7 33.4 39.3 Median age for White alone residents40.6 35.3 37.7 Median age for Hispanic or Latino residents38.1 37.8
Owner/renter occupied households by race in Meadow Woods
House owners and renters - White residents 3,110 68.2% Owner occupied1,452 31.8% Renter occupiedHouse owners and renters - Black or African American residents 1,155 82.8% Owner occupied239 17.2% Renter occupiedHouse owners and renters - American Indian / Alaska Native residents 18 100.0% Renter occupiedHouse owners and renters - Asian residents 467 77.4% Owner occupied136 22.6% Renter occupiedHouse owners and renters - Other race residents 1,353 50.6% Owner occupied1,320 49.4% Renter occupiedHouse owners and renters - Two or more races residents 4,864 88.1% Owner occupied654 11.9% Renter occupiedHouse owners and renters - White alone residents 1,689 66.3% Owner occupied859 33.7% Renter occupiedHouse owners and renters - Hispanic or Latino residents 6,306 72.6% Owner occupied2,378 27.4% Renter occupied
Language usage in Meadow Woods
English speakers - Total 40.1% of residents of Meadow Woods speak English at home.
51.2% of residents speak Spanish at home 12,556 61.5% Speak English very well7,875 38.5% Speak English less than very well7.9% of residents speak other language at home 1,964 62.2% Speak English very well1,195 37.8% Speak English less than very well
English speakers - Born in the United States 74.4% of residents of Meadow Woods speak English at home.
24.8% of residents speak Spanish at home 2,145 77.4% Speak English very well627 22.6% Speak English less than very well1.6% of residents speak other language at home 181 100.0% Speak English very well
English speakers - Native, born elsewhere 8.1% of residents of Meadow Woods speak English at home.
91.3% of residents speak Spanish at home 4,663 71.1% Speak English very well1,895 28.9% Speak English less than very well2.0% of residents speak other language at home 20 13.6% Speak English very well127 86.4% Speak English less than very well
English speakers - Foreign-born 9.6% of residents of Meadow Woods speak English at home.
71.3% of residents speak Spanish at home 4,397 45.9% Speak English very well5,181 54.1% Speak English less than very well18.5% of residents speak other language at home 1,364 54.9% Speak English very well1,120 45.1% Speak English less than very well
White (Caucasian) - Speak only English Native:
64.8% (6,085)Foreign-born:
5.7% (134)
White (Caucasian) - Speak another language Native:
22.5% (2,116)Foreign-born:
91.5% (2,143)
Black or African American - Speak only English Native:
91.5% (4,877)Foreign-born:
40.6% (411)
Black or African American - Speak another language Native:
8.1% (434)Foreign-born:
58.6% (594)
Asian - Speak only English Native:
73.3% (609)Foreign-born:
8.7% (109)
Asian - Speak another language Native:
28.5% (237)Foreign-born:
89.5% (1,116)
Other race - Speak only English Native:
22.9% (900)Foreign-born:
15.0% (269)
Other race - Speak another language Native:
75.9% (2,985)Foreign-born:
82.0% (1,475)
Two or more races - Speak only English Native:
29.0% (2,843)Foreign-born:
5.7% (461)
Two or more races - Speak another language Native:
72.2% (7,088)Foreign-born:
94.4% (7,632)
White alone - Speak only English Native:
93.2% (4,409)Foreign-born:
12.9% (130)
White alone - Speak another language Native:
6.6% (310)Foreign-born:
90.5% (917)
Hispanic or Latino - Speak only English Native:
28.4% (4,292)Foreign-born:
5.0% (496)
Hispanic or Latino - Speak another language Native:
70.2% (10,616)Foreign-born:
95.1% (9,480)
Foreign-born residents in Meadow Woods 13,269 residents are foreign born (24.4% Latin America , 3.1% Asia ).
This city:
30.9%Florida:
21.1%
Marital status for residents in Meadow Woods Marital status - White (Caucasian) population 15 years and over
Males 32.8% Never married55.2% Now married2.7% Separated0.8% Widowed8.4% DivorcedFemales 22.2% Never married61.8% Now married3.7% Separated3.1% Widowed9.2% DivorcedWomen who gave birth in the past 12 months Now married:
58.3% (65)Unmarried:
41.7% (47)
Women who did not give birth in the past 12 months Now married:
65.4% (1,982)Unmarried:
34.6% (1,050)
Marital status - Black or African American population 15 years and over
Males 29.9% Never married67.2% Now married0.0% Separated0.0% Widowed3.0% DivorcedFemales 39.3% Never married47.8% Now married3.9% Separated0.0% Widowed9.0% DivorcedWomen who did not give birth in the past 12 months Now married:
53.0% (1,091)Unmarried:
47.0% (969)
Marital status - Asian population 15 years and over
Males 53.6% Never married46.4% Now married0.0% Separated0.0% Widowed0.0% DivorcedFemales 26.1% Never married51.2% Now married0.0% Separated19.9% Widowed2.7% DivorcedWomen who did not give birth in the past 12 months Now married:
48.5% (291)Unmarried:
51.5% (309)
Marital status - Other race population 15 years and over
Males 32.0% Never married58.0% Now married4.8% Separated0.0% Widowed5.3% DivorcedFemales 33.7% Never married46.3% Now married2.8% Separated3.1% Widowed14.1% DivorcedWomen who gave birth in the past 12 months Now married:
0.0% (0)Unmarried:
100.0% (34)
Women who did not give birth in the past 12 months Now married:
33.3% (428)Unmarried:
66.7% (857)
Marital status - Two or more races population 15 years and over
Males 39.4% Never married48.2% Now married3.9% Separated2.7% Widowed5.8% DivorcedFemales 25.9% Never married40.7% Now married1.3% Separated6.2% Widowed26.0% DivorcedWomen who gave birth in the past 12 months Now married:
20.6% (10)Unmarried:
79.4% (39)
Women who did not give birth in the past 12 months Now married:
37.4% (1,747)Unmarried:
62.6% (2,928)
Marital status - White alone, not Hispanic / Latino population 15 years and over
Males 34.1% Never married50.9% Now married2.9% Separated0.9% Widowed11.3% DivorcedFemales 13.4% Never married71.2% Now married6.2% Separated2.0% Widowed7.2% DivorcedWomen who did not give birth in the past 12 months Now married:
81.2% (1,262)Unmarried:
18.8% (292)
Marital status - Hispanic or Latino population 15 years and over
Males 35.2% Never married54.0% Now married3.6% Separated1.5% Widowed5.7% DivorcedFemales 28.8% Never married47.4% Now married1.5% Separated4.6% Widowed17.7% DivorcedWomen who gave birth in the past 12 months Now married:
44.4% (89)Unmarried:
55.6% (111)
Women who did not give birth in the past 12 months Now married:
41.0% (2,649)Unmarried:
59.0% (3,814)
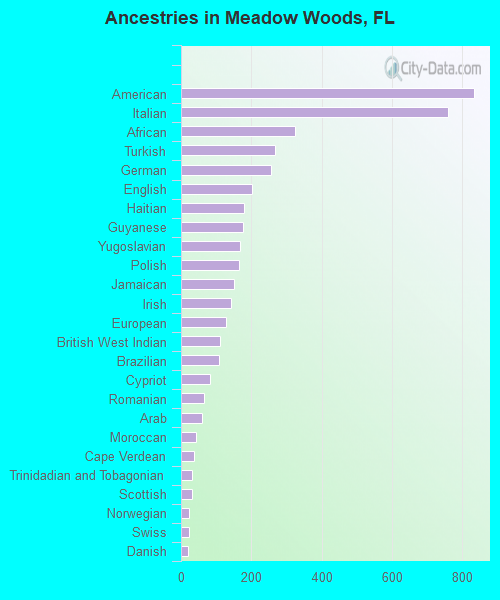
Ancestries in Meadow Woods
834 3.0% American758 2.7% Italian325 1.2% African268 0.9% Turkish257 0.9% German203 0.7% English179 0.6% Haitian177 0.6% Guyanese169 0.6% Yugoslavian166 0.6% Polish150 0.5% Jamaican141 0.5% Irish128 0.5% European112 0.4% British West Indian107 0.4% Brazilian83 0.3% Cypriot64 0.2% Romanian61 0.2% Arab43 0.2% Moroccan36 0.1% Cape Verdean32 0.1% Trinidadian and Tobagonian30 0.1% Scottish24 0.09% Norwegian24 0.09% Swiss20 0.07% Danish18 0.06% French Canadian18 0.06% Welsh16 0.06% Dutch15 0.05% Lebanese9 0.03% Eastern European9 0.03% Barbadian7 0.02% British7 0.02% Bulgarian3 0.01% Portuguese
Geographical mobility in Meadow Woods Same house 1 year ago 11,544 88.2% White (Caucasian)6,521 99.0% Black or African American19 100.0% American Indian / Alaska Native1,577 73.4% Asian5,106 87.5% Other race19,135 97.1% Two or more races5,098 85.7% White alone, not Hispanic / Latino25,171 92.4% Hispanic or LatinoMoved within same county 717 5.5% White / Caucasian10 0.2% Black or African American304 14.1% Asian292 5.0% Other race333 1.7% Two or more races442 7.4% White alone, not Hispanic / Latino838 3.1% Hispanic or LatinoMoved within same state 403 3.1% White / Caucasian29 1.3% Asian115 2.0% Other race301 1.5% Two or more races208 3.5% White alone, not Hispanic / Latino547 2.0% Hispanic or LatinoMoved from different state 206 1.6% White / Caucasian216 3.3% Black or African American16 0.1% Two or more races86 1.4% White alone, not Hispanic / Latino182 0.7% Hispanic or LatinoMoved from abroad 145 1.1% White140 6.5% Asian231 4.0% Other race243 1.2% Two or more races52 0.9% White alone, not Hispanic / Latino547 2.0% Hispanic or Latino
Children Nativity (place of birth) in Meadow Woods
Children under 6 years - Living with two parents Both parents native 857 100.0% NativeBoth parents foreign-born 1,373 93.4% Native96 6.6% Foreign-bornOne native, one foreign-born parent 280 100.0% NativeChildren under 6 years - Living with one parent Native parent 444 88.7% Native56 11.3% Foreign-bornForeign-born parent 369 100.0% NativeChildren 6 to 17 years - Living with two parents Both parents native 1,883 99.7% Native6 0.3% Foreign-bornBoth parents foreign-born 959 52.5% Native867 47.5% Foreign-bornOne native, one foreign-born parent 631 100.0% NativeChildren 6 to 17 years - Living with one parent Native parent 1,372 87.1% Native203 12.9% Foreign-bornForeign-born parent 522 79.1% Native138 20.9% Foreign-born
Grandparents responsible for own grandchildren in Meadow Woods
Grandparents (30 to 59 years) White / Caucasian 26 100.0% Not responsible for grandchildrenBlack or African American 120 59.6% Responsible for grandchildren81 40.4% Not responsible for grandchildrenTwo or more races 21 14.5% Responsible for grandchildren122 85.5% Not responsible for grandchildrenHispanic or Latino 18 7.5% Responsible for grandchildren224 92.5% Not responsible for grandchildrenGrandparents (60 years and over) White / Caucasian 4 1.1% Responsible for grandchildren397 98.9% Not responsible for grandchildrenBlack or African American 97 100.0% Not responsible for grandchildrenTwo or more races 18 9.0% Responsible for grandchildren183 91.0% Not responsible for grandchildrenHispanic or Latino 96 10.9% Responsible for grandchildren789 89.1% Not responsible for grandchildren