Races in McAlester, Oklahoma (OK) Detailed Stats
Ancestries, Foreign-born residents, place of birth
Settings
X


Recent posts about races in McAlester, Oklahoma on our local forum with over 2,400,000 registered users:
 | SE Oklahoma compared to East Tennessee (41 replies) |
| Ya'll Know What Happened To Them? (40 replies) |
| Where do we live?? Moving from WA (16 replies) |
| Okla. house members walk out during same sex marriage vote (118 replies) |
| Tell me about Mcalester and southeast Oklahoma (8 replies) |
| Question McCurtain county wilderness area? (19 replies) |
Latest news about races in McAlester, OK collected exclusively by city-data.com from local newspapers, TV, and radio stations
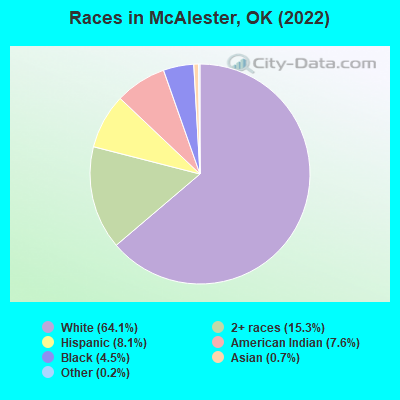
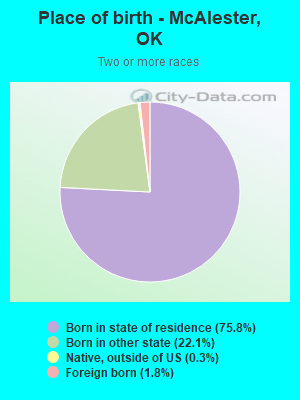
According to 2022 data, the most numerous races in McAlester, OK are White alone (11,747 residents), Hispanic (1,480 residents), and Two or more races (2,798 residents). 93.9% of McAlester residents speak English at home. 2.5% of McAlester, OK residents are foreign-born (2.0% born in Latin America, 0.3% born in Asia), which is 138.1% less than the foreign-born rate of 6.0% across the entire state of Oklahoma.
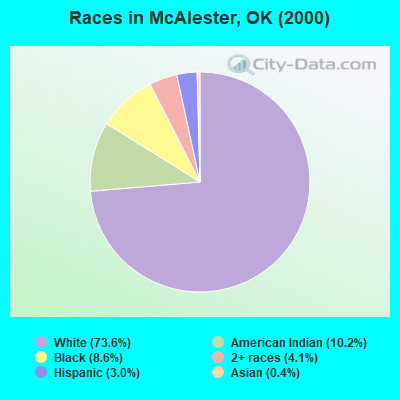
Race distribution in McAlester
2000
2022

- 13,08873.6%White alone
- 1,81810.2%American Indian alone
- 1,5298.6%Black alone
- 7214.1%Two or more races
- 5413.0%Hispanic
- 680.4%Asian alone
- 110.06%Other race alone
- 70.04%Native Hawaiian and Other
Pacific Islander alone
-
- 11,74764.1%White alone
- 2,79815.3%Two or more races
- 1,4808.1%Hispanic
- 1,4017.6%American Indian alone
- 8274.5%Black alone
- 1270.7%Asian alone
- 370.2%Other race alone
- 180.10%Native Hawaiian and Other
Pacific Islander alone
2000
2022
-
- 2,556,36874.1%White alone
- 266,1587.7%American Indian alone
- 257,9817.5%Black alone
- 179,3045.2%Hispanic
- 140,2494.1%Two or more races
- 46,1721.3%Asian alone
- 2,3220.07%Other race alone
- 2,1000.06%Native Hawaiian and Other
Pacific Islander alone

-
- 2,517,40362.6%White alone
- 486,69212.1%Hispanic
- 364,4539.1%Two or more races
- 273,6506.8%American Indian alone
- 268,5436.7%Black alone
- 92,6722.3%Asian alone
- 10,7860.3%Other race alone
- 5,6010.1%Native Hawaiian and Other
Pacific Islander alone

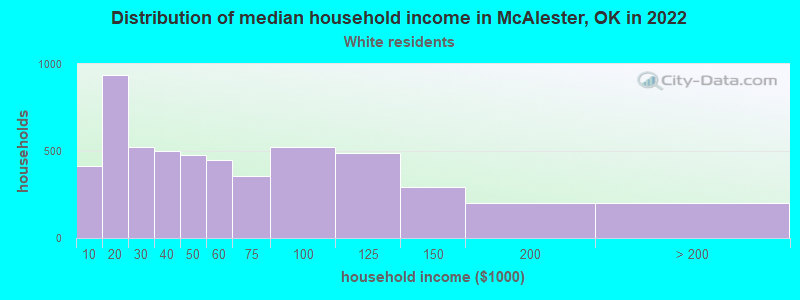
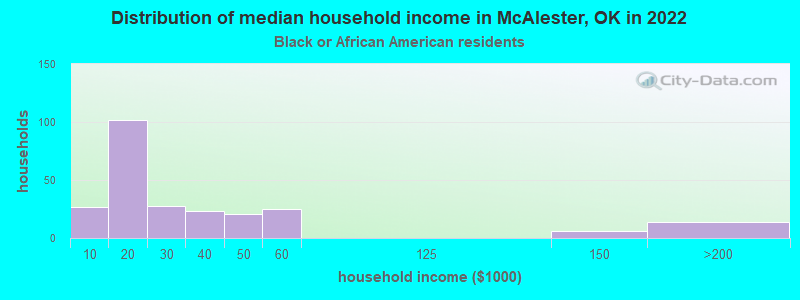
Income and house value in McAlester
- Median household income in 2022
- $45,186White non-Hispanic householders
- $18,571Black householders
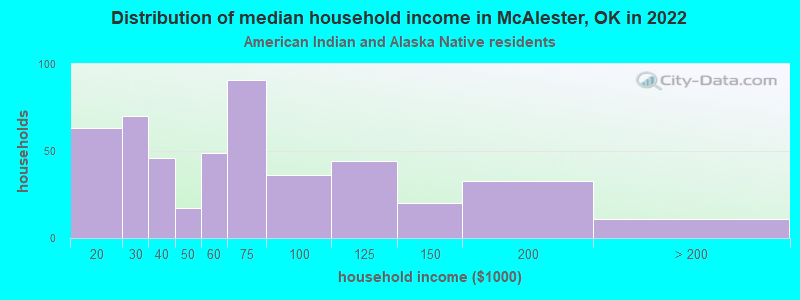
- $58,013American Indian and Alaska Native householders
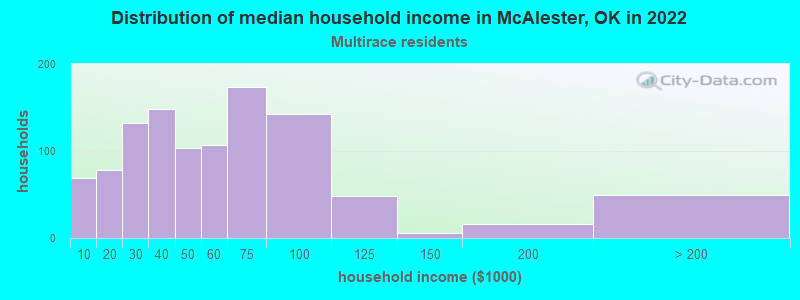
- $52,337Two or more races householders
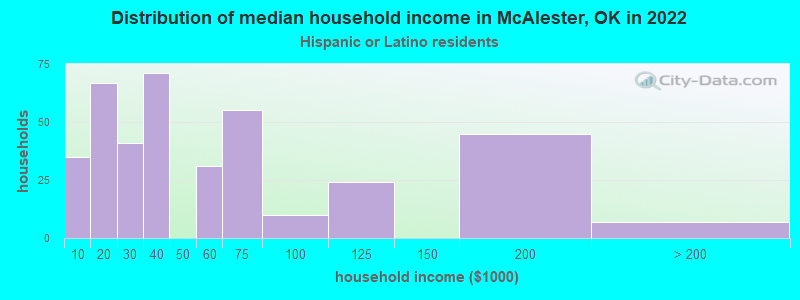
- $34,318Hispanic or Latino race householders
- Median 2022 house value
- $145,685White Non-Hispanic householders
- $103,610Black or African American householders
- $123,333American Indian or Alaska Native householders
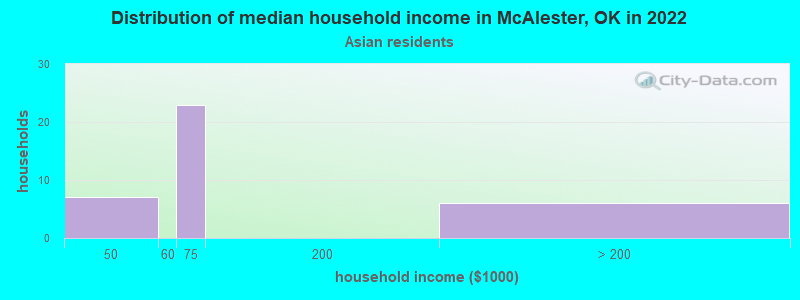
- $295,842Asian householders
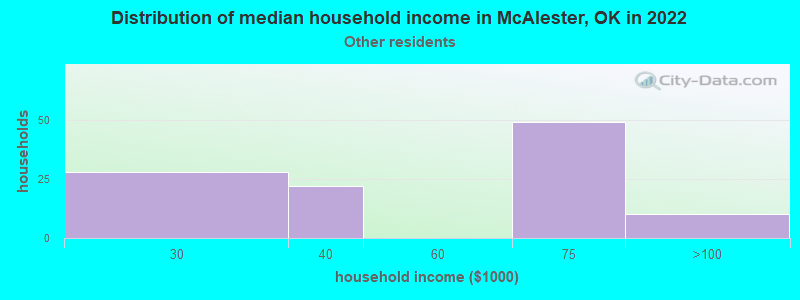
- $103,610Some other race householders
- $137,007Two or more races householders
- $152,785Hispanic or Latino householders
Household income for White non-Hispanic householders
Household income for Black householders
Household income for American Indian and Alaska Native householders
Household income for Asian householders
Household income for Some other race householders
Household income for Two or more races householders
Household income for Hispanic or Latino race householders
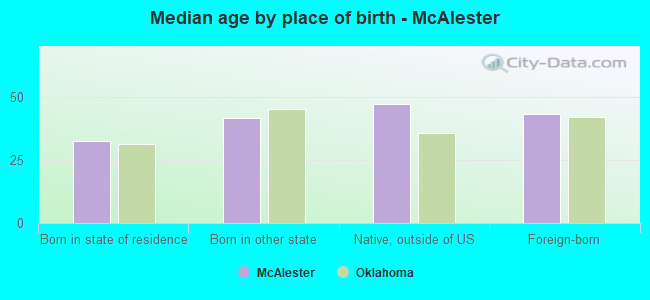
Median age by race in McAlester
- 39.7Median age for White residents
- 38.2Males
- 42.2Females
- 38.6Median age for Black or African American residents
- 35.1Males
- 57.7Females
- 33.6Median age for American Indian / Alaska Native residents
- 33.2Males
- 34.1Females
- 50.1Median age for Asian residents
- 49.8Males
- 59.1Females
- 17.7Median age for Native Hawaiian / Pacific Islander residents
- -675,324,674.6Males
- -767,251,461.2Females
- 38.9Median age for Other race residents
- 38.2Males
- 41.3Females
- 28.2Median age for Two or more races residents
- 27.0Males
- 31.1Females
- 40.3Median age for White alone residents
- 38.5Males
- 43.9Females
- 25.7Median age for Hispanic or Latino residents
- 26.7Males
- 20.8Females
Owner/renter occupied households by race in McAlester
- House owners and renters - White residents
- 3,30562.3%Owner occupied
- 1,99637.7%Renter occupied
- House owners and renters - Black or African American residents
- 6827.3%Owner occupied
- 18172.7%Renter occupied
- House owners and renters - American Indian / Alaska Native residents
- 31566.0%Owner occupied
- 16334.0%Renter occupied
- House owners and renters - Asian residents
- 28100.0%Owner occupied
- House owners and renters - Native Hawaiian / Pacific Islander residents
- 15100.0%Renter occupied
- House owners and renters - Other race residents
- 6252.5%Owner occupied
- 5647.5%Renter occupied
- House owners and renters - Two or more races residents
- 52949.9%Owner occupied
- 53150.1%Renter occupied
- House owners and renters - White alone residents
- 3,22361.9%Owner occupied
- 1,98638.1%Renter occupied
- House owners and renters - Hispanic or Latino residents
- 22056.7%Owner occupied
- 16843.3%Renter occupied
Language usage in McAlester
- English speakers - Total
- 93.9% of residents of McAlester speak English at home.
- 5.3% of residents speak Spanish at home
- 55460.3%Speak English very well
- 36539.7%Speak English less than very well
- 0.9% of residents speak other language at home
- 9564.6%Speak English very well
- 5235.4%Speak English less than very well
- English speakers - Born in the United States
- 93.4% of residents of McAlester speak English at home.
- 5.6% of residents speak Spanish at home
- 25778.1%Speak English very well
- 7221.9%Speak English less than very well
- 1.0% of residents speak other language at home
- 3865.5%Speak English very well
- 2034.5%Speak English less than very well
- English speakers - Native, born elsewhere
- 74.1% of residents of McAlester speak English at home.
- 22.4% of residents speak Spanish at home
- 19100.0%Speak English very well
- English speakers - Foreign-born
- 14.1% of residents of McAlester speak English at home.
- 76.4% of residents speak Spanish at home
- 10128.6%Speak English very well
- 25271.4%Speak English less than very well
- 9.7% of residents speak other language at home
- 2146.7%Speak English very well
- 2453.3%Speak English less than very well
White (Caucasian) - Speak only English
| Native: | 97.9% (11,215) |
| Foreign-born: | 32.3% (42) |
White (Caucasian) - Speak another language
| Native: | 2.2% (249) |
| Foreign-born: | 67.2% (87) |
Asian - Speak only English
| Native: | 57.8% (45) |
| Foreign-born: | 39.0% (21) |
Asian - Speak another language
| Native: | 42.2% (33) |
| Foreign-born: | 59.5% (32) |
Other race - Speak another language
| Native: | 40.6% (66) |
| Foreign-born: | 100.0% (166) |
Two or more races - Speak another language
| Native: | 7.3% (226) |
| Foreign-born: | 100.0% (62) |
White alone - Speak only English
| Native: | 98.8% (11,020) |
| Foreign-born: | 74.1% (34) |
White alone - Speak another language
| Native: | 1.2% (133) |
| Foreign-born: | 27.7% (13) |
Hispanic or Latino - Speak only English
| Native: | 55.2% (510) |
| Foreign-born: | 3.4% (13) |
Hispanic or Latino - Speak another language
| Native: | 44.9% (414) |
| Foreign-born: | 96.4% (360) |
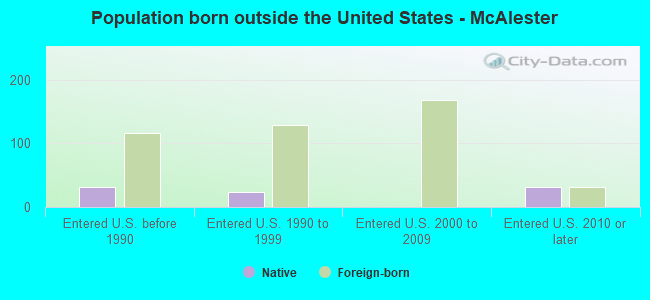
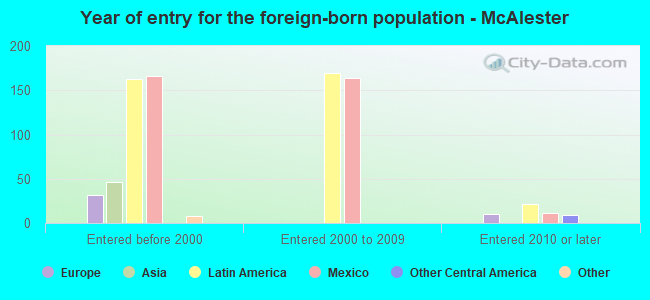
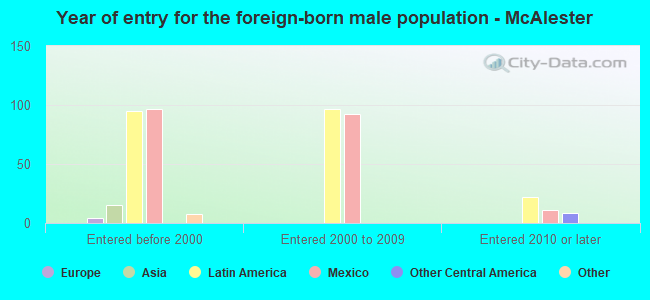
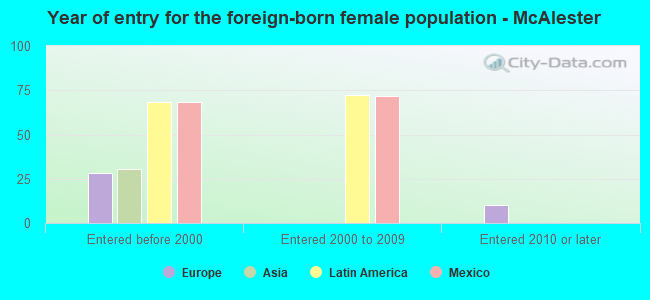
Foreign-born residents in McAlester
462 residents are foreign born (2.0% Latin America, 0.3% Asia).
| This city: | 2.5% |
| Oklahoma: | 6.1% |
Marital status for residents in McAlester
Marital status - White (Caucasian) population 15 years and over
- Males
- 32.7%Never married
- 47.9%Now married
- 2.3%Separated
- 2.8%Widowed
- 14.4%Divorced
- Females
- 21.1%Never married
- 43.7%Now married
- 2.0%Separated
- 18.4%Widowed
- 14.8%Divorced
Women who gave birth in the past 12 months
| Now married: | 71.9% (128) |
| Unmarried: | 28.1% (50) |
Women who did not give birth in the past 12 months
| Now married: | 46.1% (1,082) |
| Unmarried: | 53.9% (1,264) |
Marital status - Black or African American population 15 years and over
- Males
- 71.4%Never married
- 22.8%Now married
- 0.0%Separated
- 0.0%Widowed
- 5.7%Divorced
- Females
- 27.8%Never married
- 31.0%Now married
- 9.6%Separated
- 14.4%Widowed
- 17.1%Divorced
Women who did not give birth in the past 12 months
| Now married: | 55.4% (29) |
| Unmarried: | 44.6% (23) |
Marital status - American Indian / Alaska Native population 15 years and over
- Males
- 45.8%Never married
- 35.6%Now married
- 0.0%Separated
- 2.0%Widowed
- 16.5%Divorced
- Females
- 32.2%Never married
- 45.8%Now married
- 1.4%Separated
- 9.7%Widowed
- 11.0%Divorced
Women who gave birth in the past 12 months
| Now married: | 100.0% (23) |
| Unmarried: | 0.0% (0) |
Women who did not give birth in the past 12 months
| Now married: | 54.2% (209) |
| Unmarried: | 45.8% (176) |
Marital status - Asian population 15 years and over
- Males
- 44.4%Never married
- 55.6%Now married
- 0.0%Separated
- 0.0%Widowed
- 0.0%Divorced
- Females
- 36.3%Never married
- 35.0%Now married
- 0.0%Separated
- 21.2%Widowed
- 7.5%Divorced
Women who did not give birth in the past 12 months
| Now married: | 0.0% (0) |
| Unmarried: | 100.0% (35) |
Marital status - Native Hawaiian / Pacific Islander population 15 years and over
- Males
- 100.0%Never married
- 0.0%Now married
- 0.0%Separated
- 0.0%Widowed
- 0.0%Divorced
- Females
- 25.0%Never married
- 75.0%Now married
- 0.0%Separated
- 0.0%Widowed
- 0.0%Divorced
Women who did not give birth in the past 12 months
| Now married: | 0.0% (0) |
| Unmarried: | 100.0% (6) |
Marital status - Other race population 15 years and over
- Males
- 23.6%Never married
- 60.7%Now married
- 8.6%Separated
- 0.0%Widowed
- 7.1%Divorced
- Females
- 16.2%Never married
- 59.0%Now married
- 0.0%Separated
- 0.0%Widowed
- 24.8%Divorced
Women who did not give birth in the past 12 months
| Now married: | 54.1% (23) |
| Unmarried: | 45.9% (20) |
Marital status - Two or more races population 15 years and over
- Males
- 41.6%Never married
- 27.4%Now married
- 6.8%Separated
- 4.4%Widowed
- 19.9%Divorced
- Females
- 45.5%Never married
- 27.3%Now married
- 0.4%Separated
- 7.4%Widowed
- 19.5%Divorced
Women who gave birth in the past 12 months
| Now married: | 0.0% (0) |
| Unmarried: | 100.0% (64) |
Women who did not give birth in the past 12 months
| Now married: | 29.2% (208) |
| Unmarried: | 70.8% (505) |
Marital status - White alone, not Hispanic / Latino population 15 years and over
- Males
- 31.2%Never married
- 48.9%Now married
- 2.2%Separated
- 2.9%Widowed
- 14.7%Divorced
- Females
- 19.4%Never married
- 43.9%Now married
- 2.1%Separated
- 19.2%Widowed
- 15.4%Divorced
Women who gave birth in the past 12 months
| Now married: | 71.9% (133) |
| Unmarried: | 28.1% (52) |
Women who did not give birth in the past 12 months
| Now married: | 46.7% (1,029) |
| Unmarried: | 53.3% (1,177) |
Marital status - Hispanic or Latino population 15 years and over
- Males
- 53.0%Never married
- 33.6%Now married
- 4.0%Separated
- 0.0%Widowed
- 9.5%Divorced
- Females
- 48.7%Never married
- 45.5%Now married
- 0.0%Separated
- 0.9%Widowed
- 4.9%Divorced
Women who did not give birth in the past 12 months
| Now married: | 40.7% (127) |
| Unmarried: | 59.3% (185) |
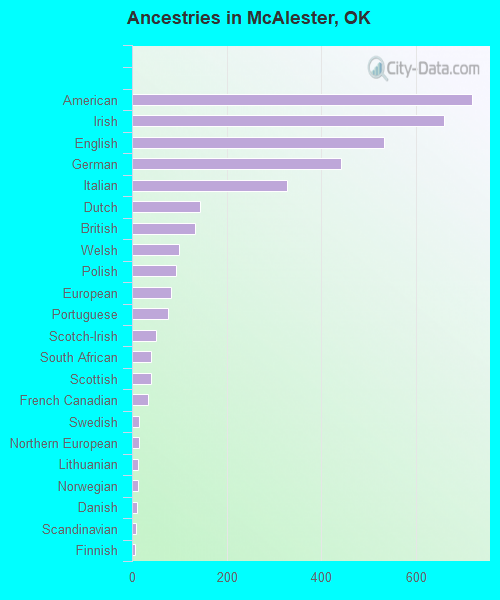
Ancestries in McAlester

- 7189.1%American
- 6598.3%Irish
- 5326.7%English
- 4415.6%German
- 3274.1%Italian
- 1431.8%Dutch
- 1341.7%British
- 991.2%Welsh
- 931.2%Polish
- 821.0%European
- 771.0%Portuguese
- 510.6%Scotch-Irish
- 410.5%South African
- 400.5%Scottish
- 330.4%French Canadian
- 150.2%Swedish
- 140.2%Northern European
- 130.2%Lithuanian
- 130.2%Norwegian
- 100.1%Danish
- 80.1%Scandinavian
- 70.09%Finnish
- 30.04%Ghanaian
- 20.03%Canadian
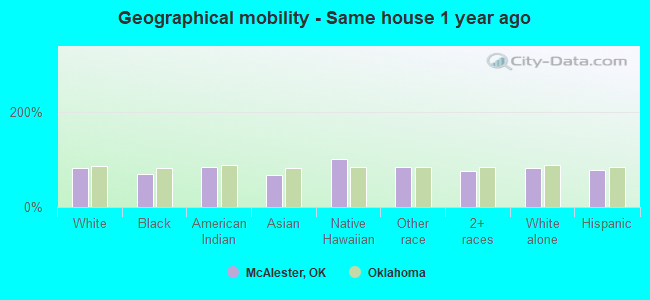
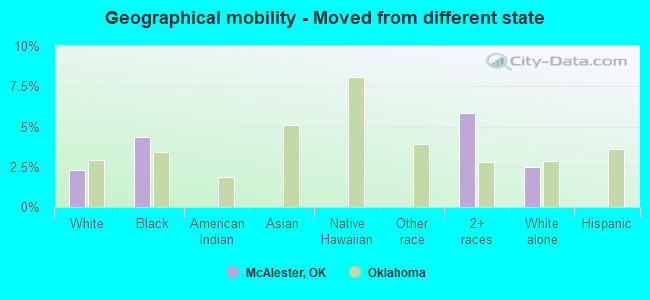
Geographical mobility in McAlester

- Same house 1 year ago
- 9,79182.1%White (Caucasian)
- 57769.6%Black or African American
- 1,18984.5%American Indian / Alaska Native
- 8667.6%Asian
- 44100.0%Native Hawaiian / Pacific Islander
- 28684.3%Other race
- 2,70776.1%Two or more races
- 9,57782.5%White alone, not Hispanic / Latino
- 1,12776.7%Hispanic or Latino
-
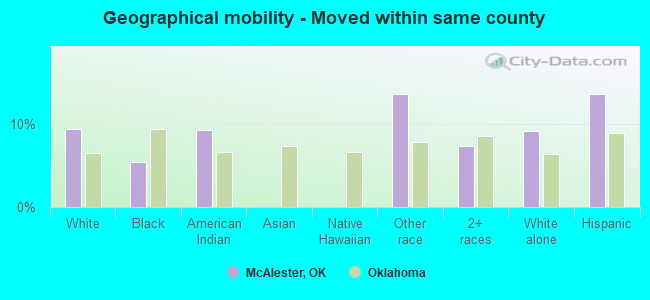
- Moved within same county
- 1,1309.5%White / Caucasian
- 455.5%Black or African American
- 1319.3%American Indian / Alaska Native
- 4613.7%Other race
- 2627.4%Two or more races
- 1,0669.2%White alone, not Hispanic / Latino
- 20213.7%Hispanic or Latino
-
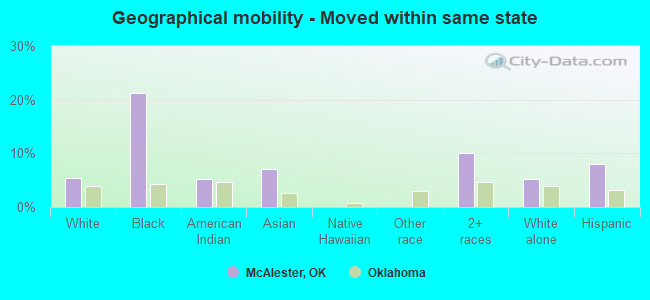
- Moved within same state
- 6515.5%White / Caucasian
- 17621.3%Black or African American
- 735.2%American Indian / Alaska Native
- 97.0%Asian
- 35610.0%Two or more races
- 6095.2%White alone, not Hispanic / Latino
- 1188.1%Hispanic or Latino
-
- Moved from different state
- 2732.3%White / Caucasian
- 364.3%Black or African American
- 2075.8%Two or more races
- 2862.5%White alone, not Hispanic / Latino
-
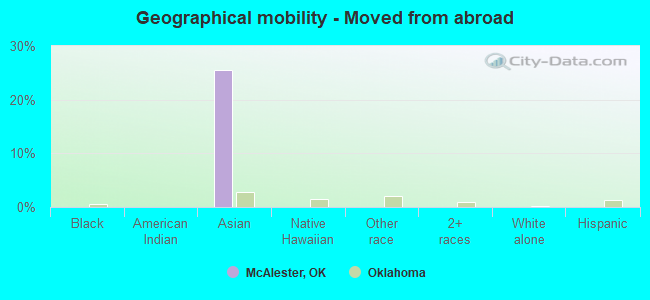
- Moved from abroad
- 80.1%White
- 3325.6%Asian
- 100.1%White alone, not Hispanic / Latino
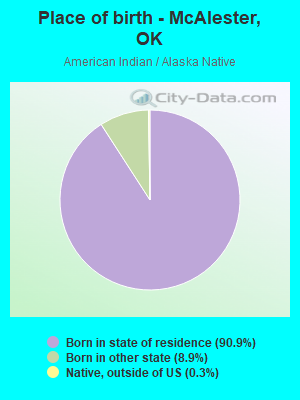
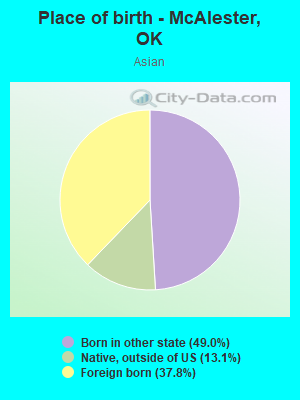
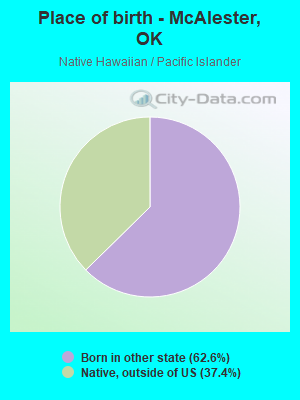
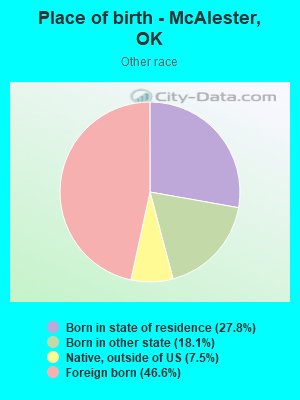
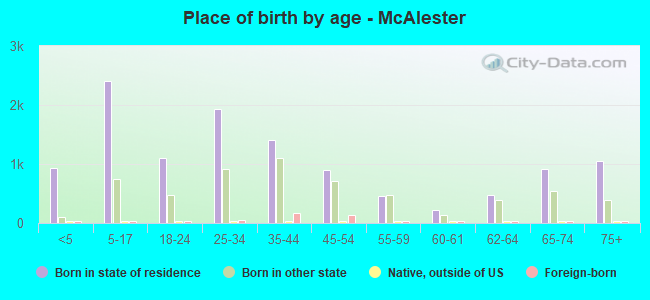
Children Nativity (place of birth) in McAlester
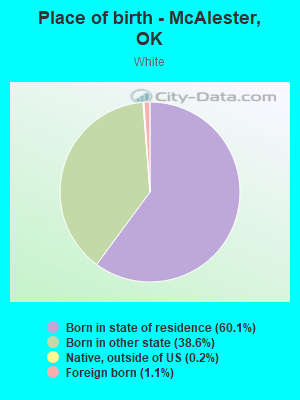
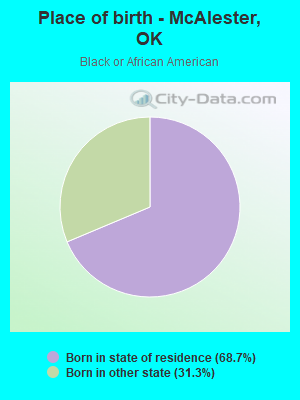
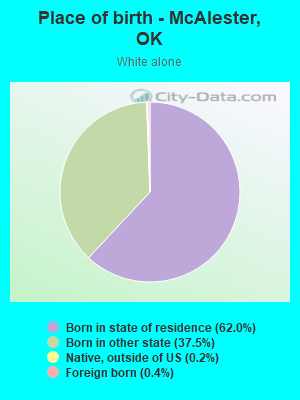
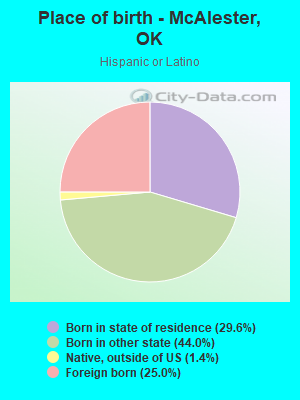
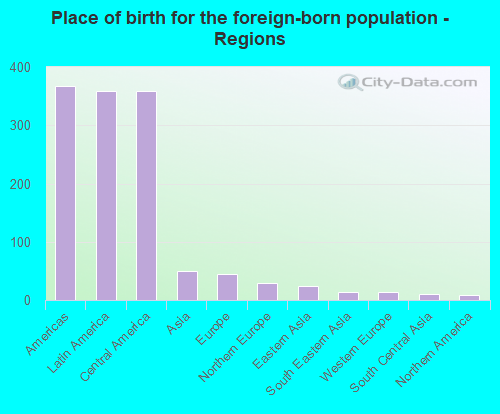
Place of birth for residents in McAlester
![Place of birth for the foreign-born population - Regions]()
- 367Americas
- 358Latin America
- 358Central America
- 50Asia
- 44Europe
- 30Northern Europe
- 24Eastern Asia
- 14South Eastern Asia
- 13Western Europe
- 10South Central Asia
- 8Northern America
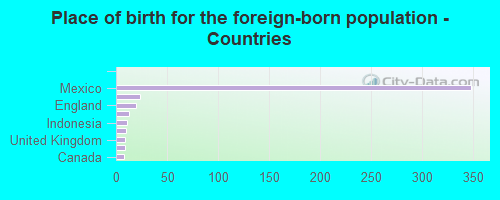
![Place of birth for the foreign-born population - Countries]()
- 348Mexico
- 24Korea
- 20England
- 13Germany
- 11Indonesia
- 10India
- 9United Kingdom
- 9Honduras
- 8Canada
- 2Philippines
Grandparents responsible for own grandchildren in McAlester
Zip codes: 74501.