Races in Maumee, Ohio (OH) Detailed Stats
Ancestries, Foreign-born residents, place of birth
Settings
X


Recent posts about races in Maumee, Ohio on our local forum with over 2,400,000 registered users:
 | Toledo or Cleveland (80 replies) |
| School,apartments near holland,maumee,waterville (5 replies) |
| Property taxes around Holland, Maumee, Sylvania (10 replies) |
| General Real Estate questions for Sylvania/Toledo (2 replies) |
| Toledo 2017 Population Estimate: 276,491 (10 replies) |
| How much of its formerly Hungarian character has the Birmingham neighborhood preserved ? (9 replies) |
Latest news about races in Maumee, OH collected exclusively by city-data.com from local newspapers, TV, and radio stations
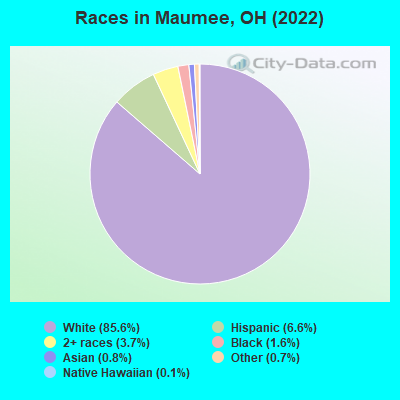
According to 2022 data, the most numerous races in Maumee, OH are White alone (11,739 residents), Black alone (220 residents), and Two or more races (508 residents). 95.6% of Maumee residents speak English at home. 2.3% of Maumee, OH residents are foreign-born (0.9% born in Asia, 0.5% born in North America, 0.4% born in Europe, 0.3% born in Latin America), which is 73.6% less than the foreign-born rate of 4.0% across the entire state of Ohio.
Race distribution in Maumee
2000
2022

- 14,56895.6%White alone
- 2771.8%Hispanic
- 1461.0%Black alone
- 1200.8%Two or more races
- 1090.7%Asian alone
- 70.05%American Indian alone
- 50.03%Other race alone
- 50.03%Native Hawaiian and Other
Pacific Islander alone

-
- 11,73985.6%White alone
- 9036.6%Hispanic
- 5083.7%Two or more races
- 2201.6%Black alone
- 1120.8%Asian alone
- 910.7%Other race alone
- 180.1%Native Hawaiian and Other
Pacific Islander alone - 40.03%American Indian alone
2000
2022
-
- 9,538,11184.0%White alone
- 1,290,66211.4%Black alone
- 217,1231.9%Hispanic
- 137,7701.2%Two or more races
- 131,6701.2%Asian alone
- 21,9850.2%American Indian alone
- 13,4830.1%Other race alone
- 2,3360.02%Native Hawaiian and Other
Pacific Islander alone

-
- 8,948,79376.1%White alone
- 1,401,40311.9%Black alone
- 529,2914.5%Two or more races
- 517,2324.4%Hispanic
- 293,3872.5%Asian alone
- 52,8050.4%Other race alone
- 9,7850.08%American Indian alone
- 3,3620.03%Native Hawaiian and Other
Pacific Islander alone

Income and house value in Maumee
- Median household income in 2022
- $74,181White non-Hispanic householders
- $124,289Black householders
- $58,357Asian householders
- $78,227Two or more races householders
- $91,737Hispanic or Latino race householders
- Median 2022 house value
- $176,580White Non-Hispanic householders
- $200,565Black or African American householders
- $109,356Asian householders
- $177,526Some other race householders
- $221,869Two or more races householders
- $198,830Hispanic or Latino householders
Household income for White non-Hispanic householders

Household income for Black householders

Household income for Asian householders

Household income for Some other race householders

Household income for Two or more races householders

Household income for Hispanic or Latino race householders

Median age by race in Maumee
- 41.7Median age for White residents
- 39.3Males
- 44.7Females
- 40.8Median age for Black or African American residents
- 29.4Males
- 62.5Females
- 25.6Median age for American Indian / Alaska Native residents
- -525,581,394.8Males
- 61.8Females
- 41.1Median age for Asian residents
- 26.2Males
- 45.2Females
- -800,387,596.1Median age for Native Hawaiian / Pacific Islander residents
- -750,242,953.6Males
- -805,394,989.6Females
- 41.5Median age for Other race residents
- 47.3Males
- 19.1Females
- 17.2Median age for Two or more races residents
- 22.6Males
- 15.9Females
- 42.3Median age for White alone residents
- 40.3Males
- 44.8Females
- 30.0Median age for Hispanic or Latino residents
- 31.9Males
- 23.6Females
Owner/renter occupied households by race in Maumee
- House owners and renters - White residents
- 4,26776.6%Owner occupied
- 1,30523.4%Renter occupied
- House owners and renters - Black or African American residents
- 20874.4%Owner occupied
- 7125.6%Renter occupied
- House owners and renters - American Indian / Alaska Native residents
- 13100.0%Owner occupied
- House owners and renters - Asian residents
- 510.7%Owner occupied
- 3889.3%Renter occupied
- House owners and renters - Native Hawaiian / Pacific Islander residents
- 10100.0%Owner occupied
- House owners and renters - Other race residents
- 4979.0%Owner occupied
- 1321.0%Renter occupied
- House owners and renters - Two or more races residents
- 10779.3%Owner occupied
- 2820.7%Renter occupied
- House owners and renters - White alone residents
- 4,11975.9%Owner occupied
- 1,30624.1%Renter occupied
- House owners and renters - Hispanic or Latino residents
- 25676.1%Owner occupied
- 8023.9%Renter occupied
Language usage in Maumee
- English speakers - Total
- 95.6% of residents of Maumee speak English at home.
- 2.0% of residents speak Spanish at home
- 19978.7%Speak English very well
- 5421.3%Speak English less than very well
- 2.3% of residents speak other language at home
- 21373.7%Speak English very well
- 7626.3%Speak English less than very well
- English speakers - Born in the United States
- 95.0% of residents of Maumee speak English at home.
- 2.9% of residents speak Spanish at home
- 6381.8%Speak English very well
- 1418.2%Speak English less than very well
- 1.3% of residents speak other language at home
- 34100.0%Speak English very well
All residents speak only English at home
- English speakers - Foreign-born
- 41.7% of residents of Maumee speak English at home.
- 4.5% of residents speak Spanish at home
- 746.7%Speak English very well
- 853.3%Speak English less than very well
- 52.6% of residents speak other language at home
- 12370.3%Speak English very well
- 5229.7%Speak English less than very well
White (Caucasian) - Speak only English
| Native: | 97.4% (10,726) |
| Foreign-born: | 61.8% (75) |
White (Caucasian) - Speak another language
| Native: | 2.6% (283) |
| Foreign-born: | 34.0% (41) |
Black or African American - Speak only English
| Native: | 100.0% (276) |
| Foreign-born: | 75.1% (14) |
Other race - Speak only English
| Native: | 100.0% (178) |
| Foreign-born: | 75.8% (7) |
Two or more races - Speak only English
| Native: | 94.3% (686) |
| Foreign-born: | 27.7% (11) |
Two or more races - Speak another language
| Native: | 5.7% (42) |
| Foreign-born: | 46.4% (19) |
White alone - Speak only English
| Native: | 97.8% (10,563) |
| Foreign-born: | 60.5% (75) |
White alone - Speak another language
| Native: | 2.2% (241) |
| Foreign-born: | 34.3% (43) |
Hispanic or Latino - Speak only English
| Native: | 86.0% (666) |
| Foreign-born: | 99.1% (49) |
Hispanic or Latino - Speak another language
| Native: | 14.7% (113) |
| Foreign-born: | 32.0% (16) |
Foreign-born residents in Maumee
316 residents are foreign born (0.9% Asia, 0.5% North America, 0.4% Europe, 0.3% Latin America).
| This city: | 2.3% |
| Ohio: | 4.9% |


Marital status for residents in Maumee
Marital status - White (Caucasian) population 15 years and over
- Males
- 31.7%Never married
- 54.0%Now married
- 1.2%Separated
- 2.6%Widowed
- 10.6%Divorced
- Females
- 25.5%Never married
- 54.5%Now married
- 0.6%Separated
- 7.4%Widowed
- 12.1%Divorced
Women who gave birth in the past 12 months
| Now married: | 80.1% (116) |
| Unmarried: | 19.9% (29) |
Women who did not give birth in the past 12 months
| Now married: | 48.7% (1,269) |
| Unmarried: | 51.3% (1,338) |
Marital status - Black or African American population 15 years and over
- Males
- 70.7%Never married
- 29.3%Now married
- 0.0%Separated
- 0.0%Widowed
- 0.0%Divorced
- Females
- 36.4%Never married
- 0.0%Now married
- 0.0%Separated
- 0.0%Widowed
- 63.6%Divorced
Women who did not give birth in the past 12 months
| Now married: | 0.0% (0) |
| Unmarried: | 100.0% (57) |
Marital status - American Indian / Alaska Native population 15 years and over
- Males
- 100.0%Never married
- 0.0%Now married
- 0.0%Separated
- 0.0%Widowed
- 0.0%Divorced
- Females
- 25.6%Never married
- 43.6%Now married
- 0.0%Separated
- 30.8%Widowed
- 0.0%Divorced
Women who did not give birth in the past 12 months
| Now married: | 0.0% (0) |
| Unmarried: | 100.0% (12) |
Marital status - Asian population 15 years and over
- Males
- 29.0%Never married
- 71.0%Now married
- 0.0%Separated
- 0.0%Widowed
- 0.0%Divorced
- Females
- 17.0%Never married
- 83.0%Now married
- 0.0%Separated
- 0.0%Widowed
- 0.0%Divorced
Women who did not give birth in the past 12 months
| Now married: | 69.0% (19) |
| Unmarried: | 31.0% (8) |
Marital status - Native Hawaiian / Pacific Islander population 15 years and over
- Males
- 0.0%Never married
- 100.0%Now married
- 0.0%Separated
- 0.0%Widowed
- 0.0%Divorced
- Females
- 0.0%Never married
- 100.0%Now married
- 0.0%Separated
- 0.0%Widowed
- 0.0%Divorced
Marital status - Other race population 15 years and over
- Males
- 11.3%Never married
- 74.2%Now married
- 0.0%Separated
- 0.0%Widowed
- 14.5%Divorced
- Females
- 72.9%Never married
- 11.9%Now married
- 0.0%Separated
- 15.3%Widowed
- 0.0%Divorced
Women who did not give birth in the past 12 months
| Now married: | 14.0% (9) |
| Unmarried: | 86.0% (58) |
Marital status - Two or more races population 15 years and over
- Males
- 37.7%Never married
- 57.8%Now married
- 0.0%Separated
- 0.0%Widowed
- 4.4%Divorced
- Females
- 63.1%Never married
- 27.8%Now married
- 0.0%Separated
- 9.1%Widowed
- 0.0%Divorced
Women who did not give birth in the past 12 months
| Now married: | 13.3% (23) |
| Unmarried: | 86.7% (150) |
Marital status - White alone, not Hispanic / Latino population 15 years and over
- Males
- 31.1%Never married
- 53.9%Now married
- 1.3%Separated
- 2.7%Widowed
- 11.0%Divorced
- Females
- 25.2%Never married
- 54.3%Now married
- 0.6%Separated
- 7.5%Widowed
- 12.3%Divorced
Women who gave birth in the past 12 months
| Now married: | 80.1% (118) |
| Unmarried: | 19.9% (29) |
Women who did not give birth in the past 12 months
| Now married: | 48.5% (1,236) |
| Unmarried: | 51.5% (1,310) |
Marital status - Hispanic or Latino population 15 years and over
- Males
- 49.2%Never married
- 48.7%Now married
- 0.0%Separated
- 0.0%Widowed
- 2.1%Divorced
- Females
- 55.0%Never married
- 37.4%Now married
- 0.0%Separated
- 7.6%Widowed
- 0.0%Divorced
Women who did not give birth in the past 12 months
| Now married: | 26.8% (58) |
| Unmarried: | 73.2% (159) |
Ancestries in Maumee

- 1,46026.5%German
- 81314.8%American
- 4588.3%Irish
- 4468.1%English
- 3756.8%Polish
- 1733.1%European
- 1382.5%French
- 1082.0%Italian
- 711.3%Scottish
- 671.2%Dutch
- 591.1%Lebanese
- 460.8%Norwegian
- 430.8%Greek
- 410.7%Romanian
- 370.7%French Canadian
- 300.5%Czech
- 290.5%Swedish
- 270.5%Hungarian
- 230.4%Austrian
- 210.4%Northern European
- 150.3%British
- 150.3%African
- 120.2%Finnish
- 110.2%Scandinavian
- 100.2%Ethiopian
- 90.2%Belgian
- 90.2%Welsh
- 80.1%Czechoslovakian
- 70.1%Eastern European
- 50.09%Croatian
- 50.09%Slovene
- 50.09%Swiss
- 40.07%Serbian
- 30.05%Canadian
- 30.05%Israeli
- 20.04%Palestinian
- 10.02%Lithuanian

Geographical mobility in Maumee

- Same house 1 year ago
- 10,89191.9%White (Caucasian)
- 311100.0%Black or African American
- 87100.0%American Indian / Alaska Native
- 9692.8%Asian
- 21100.0%Native Hawaiian / Pacific Islander
- 15492.0%Other race
- 71588.1%Two or more races
- 10,60391.4%White alone, not Hispanic / Latino
- 80289.9%Hispanic or Latino

-
- Moved within same county
- 4964.2%White / Caucasian
- 51.7%Black or African American
- 105.9%Other race
- 9611.8%Two or more races
- 4974.3%White alone, not Hispanic / Latino
- 9911.1%Hispanic or Latino

-
- Moved within same state
- 4113.5%White / Caucasian
- 1010.1%Asian
- 4253.7%White alone, not Hispanic / Latino

-
- Moved from different state
- 1341.1%White / Caucasian
- 50.6%Two or more races
- 1451.2%White alone, not Hispanic / Latino

-
- Moved from abroad
- 40.0%White
- 40.0%White alone, not Hispanic / Latino

Children Nativity (place of birth) in Maumee
Place of birth for residents in Maumee
![Place of birth for the foreign-born population - Regions]()
- 120Asia
- 118Americas
- 72Eastern Asia
- 71Northern America
- 62Europe
- 49Eastern Europe
- 47Latin America
- 39South Eastern Asia
- 39Central America
- 21China
- 14Africa
- 14Eastern Africa
- 13Northern Europe
- 7South America
- 4Western Asia

![Place of birth for the foreign-born population - Countries]()
- 67Canada
- 51Korea
- 39Philippines
- 35Romania
- 23Guatemala
- 21Hong Kong
- 16Mexico
- 14Ethiopia
- 9Scotland
- 7Ukraine
- 7Peru
- 6Russia
- 4England
- 4Israel
