Races in Matanzas, Florida (FL) Detailed Stats
Ancestries, Foreign-born residents, place of birth
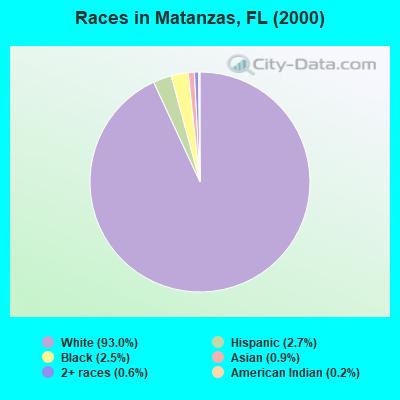
Race distribution in Matanzas

- 10,51093.0%White alone
- 3062.7%Hispanic
- 2802.5%Black alone
- 1030.9%Asian alone
- 730.6%Two or more races
- 240.2%American Indian alone
- 60.05%Native Hawaiian and Other
Pacific Islander alone - 40.04%Other race alone
2000
2022
-
- 10,458,50965.4%White alone
- 2,682,71516.8%Hispanic
- 2,264,26814.2%Black alone
- 261,6931.6%Asian alone
- 236,9541.5%Two or more races
- 42,3580.3%American Indian alone
- 28,9940.2%Other race alone
- 6,8870.04%Native Hawaiian and Other
Pacific Islander alone

-
- 11,309,40350.8%White alone
- 6,025,03927.1%Hispanic
- 3,241,01514.6%Black alone
- 861,6303.9%Two or more races
- 623,6922.8%Asian alone
- 152,0540.7%Other race alone
- 22,5040.1%American Indian alone
- 9,4860.04%Native Hawaiian and Other
Pacific Islander alone

Income and house value in Matanzas
- Median household income in 2022
- $78,686White non-Hispanic householders
- $174,758Black householders
- $5,306Asian householders
- $85,741Some other race householders
- over $200,000Two or more races householders
- $108,654Hispanic or Latino race householders
- Median 2022 house value
- $405,172White Non-Hispanic householders
- $243,033Black or African American householders
- $526,863Asian householders
- $392,270Some other race householders
- $191,776Two or more races householders
- $480,836Hispanic or Latino householders
Household income for White non-Hispanic householders

Household income for Black householders

Household income for Asian householders

Household income for Two or more races householders

Household income for Hispanic or Latino race householders

Zip code: 32086