Races in Marysville, Washington (WA) Detailed Stats
Data:
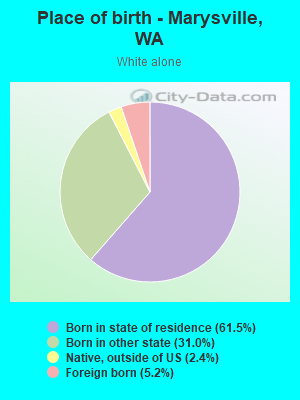
Races - White alone (%)
Races - White alone (% change since 2000)
Races - Black alone (%)
Races - Black alone (% change since 2000)
Races - American Indian alone (%)
Races - American Indian alone (% change since 2000)
Races - Asian alone (%)
Races - Asian alone (% change since 2000)
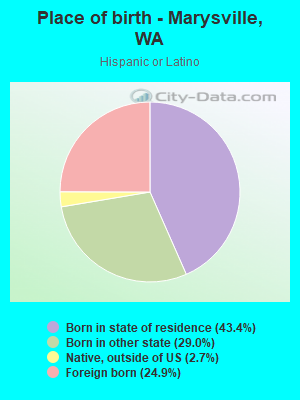
Races - Hispanic (%)
Races - Hispanic (% change since 2000)
Races - Native Hawaiian and Other Pacific Islander alone (%)
Races - Native Hawaiian and Other Pacific Islander alone (% change since 2000)
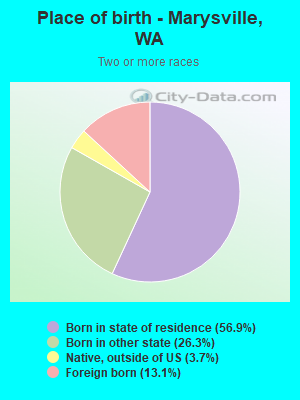
Races - Two or more races(%)
Races - Two or more races(% change since 2000)
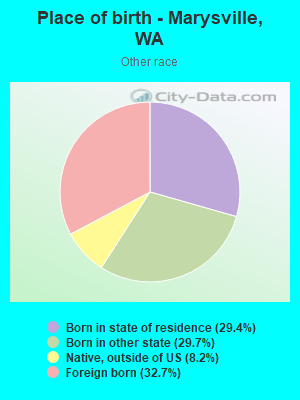
Races - Other race alone (%)
Races - Other race alone (% change since 2000)
Racial diversity
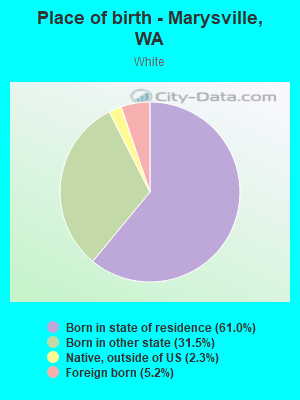
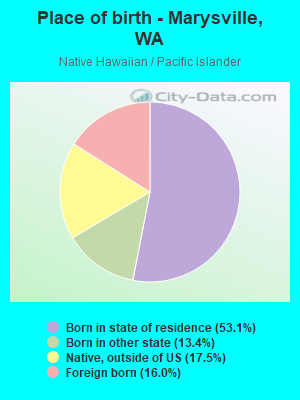
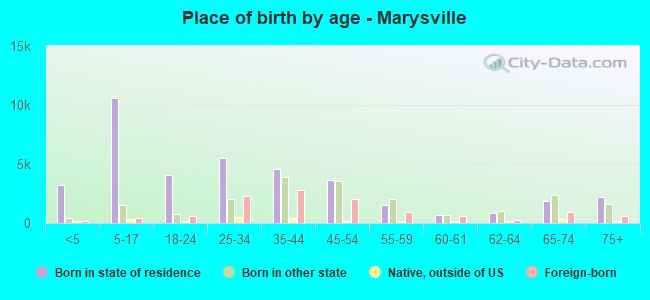
Place of birth - Born in state of residence (%)
Place of birth - Born in state of residence (%) - White
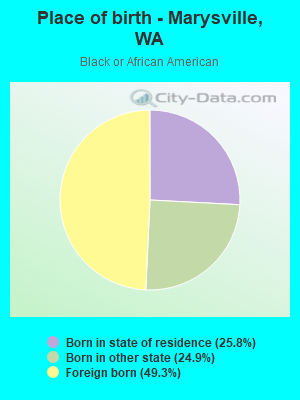
Place of birth - Born in state of residence (%) - Black or African American
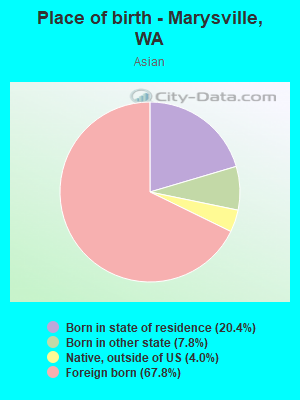
Place of birth - Born in state of residence (%) - Asian
Place of birth - Born in state of residence (%) - Hispanic or Latino
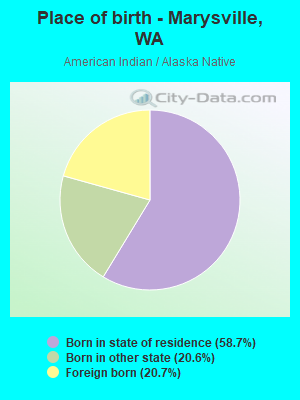
Place of birth - Born in state of residence (%) - American Indian and Alaska Native
Place of birth - Born in state of residence (%) - Multirace
Place of birth - Born in state of residence (%) - Other Race
Place of birth - Born in other state (%)
Place of birth - Born in other state (%) - White
Place of birth - Born in other state (%) - Black or African American
Place of birth - Born in other state (%) - Asian
Place of birth - Born in other state (%) - Hispanic or Latino
Place of birth - Born in other state (%) - American Indian and Alaska Native
Place of birth - Born in other state (%) - Multirace
Place of birth - Born in other state (%) - Other Race
Place of birth - Native, outside of US (%)
Place of birth - Native, outside of US (%) - White
Place of birth - Native, outside of US (%) - Black or African American
Place of birth - Native, outside of US (%) - Asian
Place of birth - Native, outside of US (%) - Hispanic or Latino
Place of birth - Native, outside of US (%) - American Indian and Alaska Native
Place of birth - Native, outside of US (%) - Multirace
Place of birth - Native, outside of US (%) - Other Race
Place of birth - Foreign born (%)
Place of birth - Foreign born (%) - White
Place of birth - Foreign born (%) - Black or African American
Place of birth - Foreign born (%) - Asian
Place of birth - Foreign born (%) - Hispanic or Latino
Place of birth - Foreign born (%) - American Indian and Alaska Native
Place of birth - Foreign born (%) - Multirace
Place of birth - Foreign born (%) - Other Race
Residents speaking English at home (%)
Residents speaking English at home - Born in the United States (%)
Residents speaking English at home - Native, born elsewhere (%)
Residents speaking English at home - Foreign born (%)
Residents speaking Spanish at home (%)
Residents speaking Spanish at home - Born in the United States (%)
Residents speaking Spanish at home - Native, born elsewhere (%)
Residents speaking Spanish at home - Foreign born (%)
Residents speaking other language at home (%)
Residents speaking other language at home - Born in the United States (%)
Residents speaking other language at home - Native, born elsewhere (%)
Residents speaking other language at home - Foreign born (%)
Marital status - Never married (%)
Marital status - Now married (%)
Marital status - Separated (%)
Marital status - Widowed (%)
Marital status - Divorced (%)
Ancestries Reported - Arab (%)
Ancestries Reported - Czech (%)
Ancestries Reported - Danish (%)
Ancestries Reported - Dutch (%)
Ancestries Reported - English (%)
Ancestries Reported - French (%)
Ancestries Reported - French Canadian (%)
Ancestries Reported - German (%)
Ancestries Reported - Greek (%)
Ancestries Reported - Hungarian (%)
Ancestries Reported - Irish (%)
Ancestries Reported - Italian (%)
Ancestries Reported - Lithuanian (%)
Ancestries Reported - Norwegian (%)
Ancestries Reported - Polish (%)
Ancestries Reported - Portuguese (%)
Ancestries Reported - Russian (%)
Ancestries Reported - Scotch-Irish (%)
Ancestries Reported - Scottish (%)
Ancestries Reported - Slovak (%)
Ancestries Reported - Subsaharan African (%)
Ancestries Reported - Swedish (%)
Ancestries Reported - Swiss (%)
Ancestries Reported - Ukrainian (%)
Ancestries Reported - United States (%)
Ancestries Reported - Welsh (%)
Ancestries Reported - West Indian (%)
Ancestries Reported - Other (%)
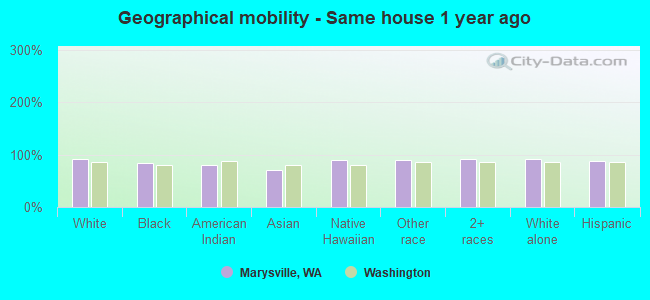
Geographical mobility - Same house 1 year ago (%)
Geographical mobility - Same house 1 year ago (%) - White
Geographical mobility - Same house 1 year ago (%) - Black or African American
Geographical mobility - Same house 1 year ago (%) - Asian
Geographical mobility - Same house 1 year ago (%) - Hispanic or Latino
Geographical mobility - Same house 1 year ago (%) - American Indian and Alaska Native
Geographical mobility - Same house 1 year ago (%) - Multirace
Geographical mobility - Same house 1 year ago (%) - Other Race
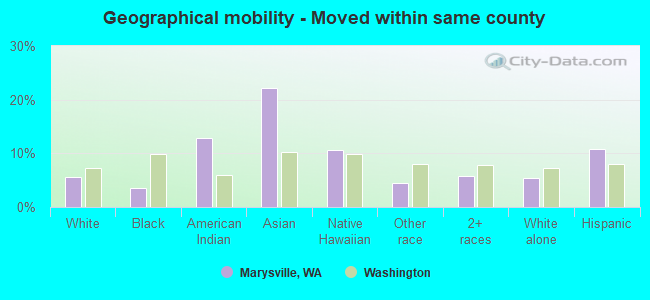
Geographical mobility - Moved within same county (%)
Geographical mobility - Moved within same county (%) - White
Geographical mobility - Moved within same county (%) - Black or African American
Geographical mobility - Moved within same county (%) - Asian
Geographical mobility - Moved within same county (%) - Hispanic or Latino
Geographical mobility - Moved within same county (%) - American Indian and Alaska Native
Geographical mobility - Moved within same county (%) - Multirace
Geographical mobility - Moved within same county (%) - Other Race
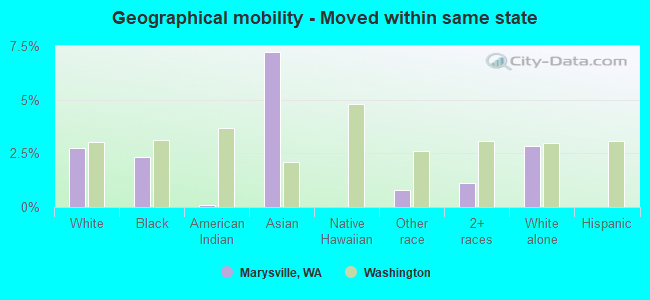
Geographical mobility - Moved from different county within same state (%)
Geographical mobility - Moved from different county within same state (%) - White
Geographical mobility - Moved from different county within same state (%) - Black or African American
Geographical mobility - Moved from different county within same state (%) - Asian
Geographical mobility - Moved from different county within same state (%) - Hispanic or Latino
Geographical mobility - Moved from different county within same state (%) - American Indian and Alaska Native
Geographical mobility - Moved from different county within same state (%) - Multirace
Geographical mobility - Moved from different county within same state (%) - Other Race
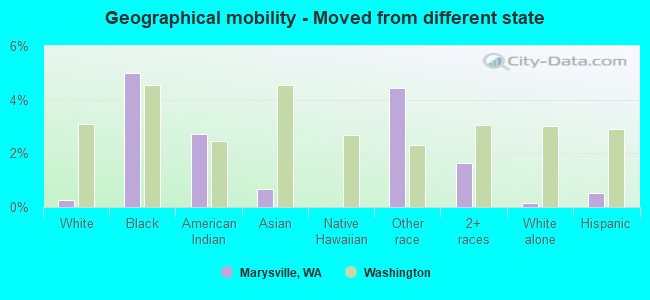
Geographical mobility - Moved from different state (%)
Geographical mobility - Moved from different state (%) - White
Geographical mobility - Moved from different state (%) - Black or African American
Geographical mobility - Moved from different state (%) - Asian
Geographical mobility - Moved from different state (%) - Hispanic or Latino
Geographical mobility - Moved from different state (%) - American Indian and Alaska Native
Geographical mobility - Moved from different state (%) - Multirace
Geographical mobility - Moved from different state (%) - Other Race
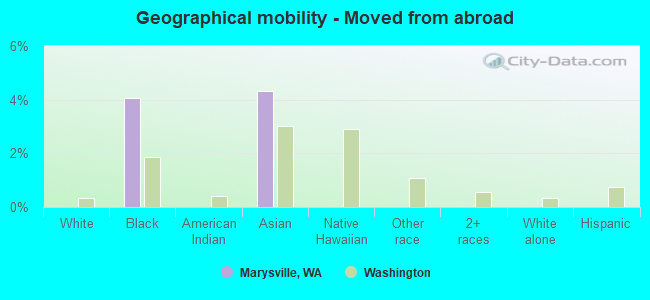
Geographical mobility - Moved from abroad (%)
Geographical mobility - Moved from abroad (%) - White
Geographical mobility - Moved from abroad (%) - Black or African American
Geographical mobility - Moved from abroad (%) - Asian
Geographical mobility - Moved from abroad (%) - Hispanic or Latino
Geographical mobility - Moved from abroad (%) - American Indian and Alaska Native
Geographical mobility - Moved from abroad (%) - Multirace
Geographical mobility - Moved from abroad (%) - Other Race
Place of birth for the foreign-born population - Ireland (%)
Place of birth for the foreign-born population - Denmark (%)
Place of birth for the foreign-born population - Norway (%)
Place of birth for the foreign-born population - Sweden (%)
Place of birth for the foreign-born population - United Kingdom (%)
Place of birth for the foreign-born population - England (%)
Place of birth for the foreign-born population - Scotland (%)
Place of birth for the foreign-born population - Other Northern Europe (%)
Place of birth for the foreign-born population - Austria (%)
Place of birth for the foreign-born population - Belgium (%)
Place of birth for the foreign-born population - France (%)
Place of birth for the foreign-born population - Germany (%)
Place of birth for the foreign-born population - Netherlands (%)
Place of birth for the foreign-born population - Switzerland (%)
Place of birth for the foreign-born population - Other Western Europe (%)
Place of birth for the foreign-born population - Greece (%)
Place of birth for the foreign-born population - Italy (%)
Place of birth for the foreign-born population - Portugal (%)
Place of birth for the foreign-born population - Spain (%)
Place of birth for the foreign-born population - Other Southern Europe (%)
Place of birth for the foreign-born population - Albania (%)
Place of birth for the foreign-born population - Belarus (%)
Place of birth for the foreign-born population - Bosnia and Herzegovina (%)
Place of birth for the foreign-born population - Bulgaria (%)
Place of birth for the foreign-born population - Croatia (%)
Place of birth for the foreign-born population - Czechoslovakia (%)
Place of birth for the foreign-born population - Hungary (%)
Place of birth for the foreign-born population - Latvia (%)
Place of birth for the foreign-born population - Lithuania (%)
Place of birth for the foreign-born population - North Macedonia (Macedonia) (%)
Place of birth for the foreign-born population - Moldova (%)
Place of birth for the foreign-born population - Poland (%)
Place of birth for the foreign-born population - Romania (%)
Place of birth for the foreign-born population - Russia (%)
Place of birth for the foreign-born population - Serbia (%)
Place of birth for the foreign-born population - Ukraine (%)
Place of birth for the foreign-born population - Other Eastern Europe (%)
Place of birth for the foreign-born population - China (%)
Place of birth for the foreign-born population - Hong Kong (%)
Place of birth for the foreign-born population - Taiwan (%)
Place of birth for the foreign-born population - Japan (%)
Place of birth for the foreign-born population - Korea (%)
Place of birth for the foreign-born population - Other Eastern Asia (%)
Place of birth for the foreign-born population - Afghanistan (%)
Place of birth for the foreign-born population - Bangladesh (%)
Place of birth for the foreign-born population - India (%)
Place of birth for the foreign-born population - Iran (%)
Place of birth for the foreign-born population - Kazakhstan (%)
Place of birth for the foreign-born population - Nepal (%)
Place of birth for the foreign-born population - Pakistan (%)
Place of birth for the foreign-born population - Sri Lanka (%)
Place of birth for the foreign-born population - Uzbekistan (%)
Place of birth for the foreign-born population - Other South Central Asia (%)
Place of birth for the foreign-born population - Burma (%)
Place of birth for the foreign-born population - Cambodia (%)
Place of birth for the foreign-born population - Indonesia (%)
Place of birth for the foreign-born population - Laos (%)
Place of birth for the foreign-born population - Malaysia (%)
Place of birth for the foreign-born population - Philippines (%)
Place of birth for the foreign-born population - Singapore (%)
Place of birth for the foreign-born population - Thailand (%)
Place of birth for the foreign-born population - Vietnam (%)
Place of birth for the foreign-born population - Other South Eastern Asia (%)
Place of birth for the foreign-born population - Armenia (%)
Place of birth for the foreign-born population - Iraq (%)
Place of birth for the foreign-born population - Israel (%)
Place of birth for the foreign-born population - Jordan (%)
Place of birth for the foreign-born population - Kuwait (%)
Place of birth for the foreign-born population - Lebanon (%)
Place of birth for the foreign-born population - Saudi Arabia (%)
Place of birth for the foreign-born population - Syria (%)
Place of birth for the foreign-born population - Turkey (%)
Place of birth for the foreign-born population - Yemen (%)
Place of birth for the foreign-born population - Other Western Asia (%)
Place of birth for the foreign-born population - Eritrea (%)
Place of birth for the foreign-born population - Ethiopia (%)
Place of birth for the foreign-born population - Kenya (%)
Place of birth for the foreign-born population - Somalia (%)
Place of birth for the foreign-born population - Uganda (%)
Place of birth for the foreign-born population - Zimbabwe (%)
Place of birth for the foreign-born population - Other Eastern Africa (%)
Place of birth for the foreign-born population - Cameroon (%)
Place of birth for the foreign-born population - Congo (%)
Place of birth for the foreign-born population - Democratic Republic of Congo (Zaire) (%)
Place of birth for the foreign-born population - Other Middle Africa (%)
Place of birth for the foreign-born population - Egypt (%)
Place of birth for the foreign-born population - Morocco (%)
Place of birth for the foreign-born population - Sudan (%)
Place of birth for the foreign-born population - Other Northern Africa (%)
Place of birth for the foreign-born population - South Africa (%)
Place of birth for the foreign-born population - Other Southern Africa (%)
Place of birth for the foreign-born population - Cabo Verde (%)
Place of birth for the foreign-born population - Ghana (%)
Place of birth for the foreign-born population - Liberia (%)
Place of birth for the foreign-born population - Nigeria (%)
Place of birth for the foreign-born population - Senegal (%)
Place of birth for the foreign-born population - Sierra Leone (%)
Place of birth for the foreign-born population - Other Western Africa (%)
Place of birth for the foreign-born population - Australia (%)
Place of birth for the foreign-born population - New Zealand (%)
Place of birth for the foreign-born population - Fiji (%)
Place of birth for the foreign-born population - Micronesia (%)
Place of birth for the foreign-born population - Bahamas (%)
Place of birth for the foreign-born population - Barbados (%)
Place of birth for the foreign-born population - Cuba (%)
Place of birth for the foreign-born population - Dominica (%)
Place of birth for the foreign-born population - Dominican Republic (%)
Place of birth for the foreign-born population - Grenada (%)
Place of birth for the foreign-born population - Haiti (%)
Place of birth for the foreign-born population - Jamaica (%)
Place of birth for the foreign-born population - St. Vincent and the Grenadines (%)
Place of birth for the foreign-born population - Trinidad and Tobago (%)
Place of birth for the foreign-born population - West Indies (%)
Place of birth for the foreign-born population - Other Caribbean (%)
Place of birth for the foreign-born population - Belize (%)
Place of birth for the foreign-born population - Costa Rica (%)
Place of birth for the foreign-born population - El Salvador (%)
Place of birth for the foreign-born population - Guatemala (%)
Place of birth for the foreign-born population - Honduras (%)
Place of birth for the foreign-born population - Mexico (%)
Place of birth for the foreign-born population - Nicaragua (%)
Place of birth for the foreign-born population - Panama (%)
Place of birth for the foreign-born population - Other Central America (%)
Place of birth for the foreign-born population - Argentina (%)
Place of birth for the foreign-born population - Bolivia (%)
Place of birth for the foreign-born population - Brazil (%)
Place of birth for the foreign-born population - Chile (%)
Place of birth for the foreign-born population - Colombia (%)
Place of birth for the foreign-born population - Ecuador (%)
Place of birth for the foreign-born population - Guyana (%)
Place of birth for the foreign-born population - Peru (%)
Place of birth for the foreign-born population - Uruguay (%)
Place of birth for the foreign-born population - Venezuela (%)
Place of birth for the foreign-born population - Other South America (%)
Place of birth for the foreign-born population - Canada (%)
Place of birth for the foreign-born population - Other Northern America (%)
Place of birth for the foreign-born population - Other (%)
Latest news about races in Marysville, WA collected exclusively by city-data.com from local newspapers, TV, and radio stations
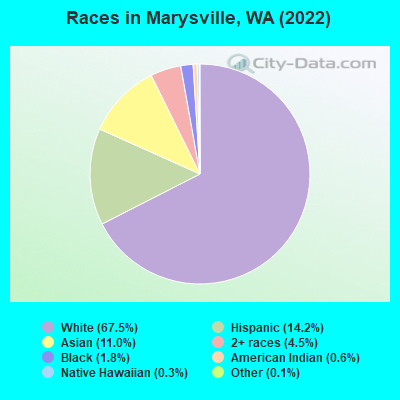
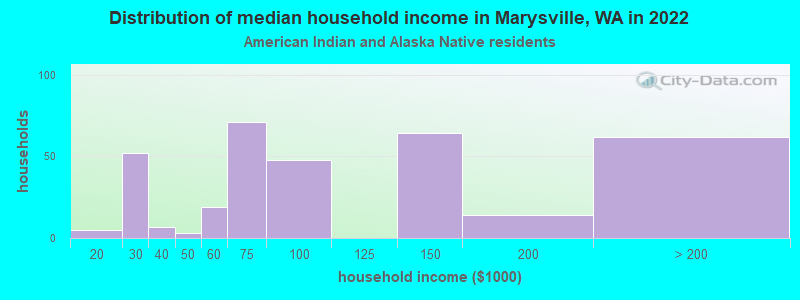
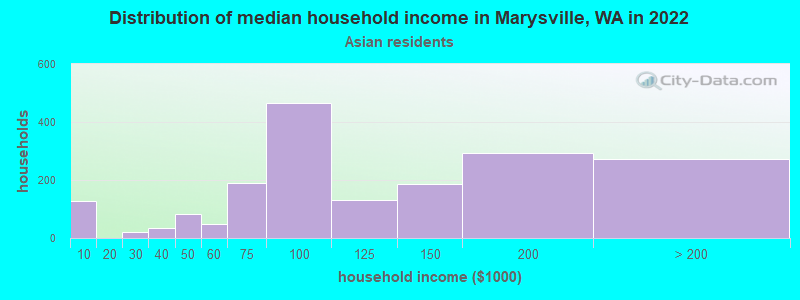
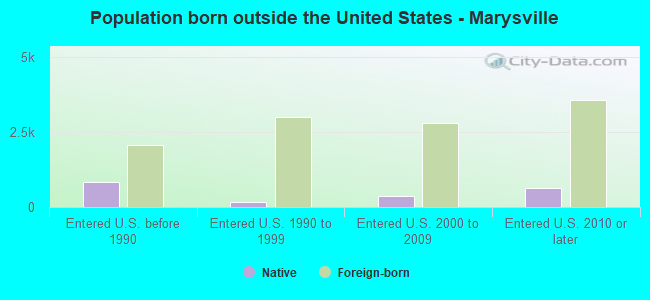
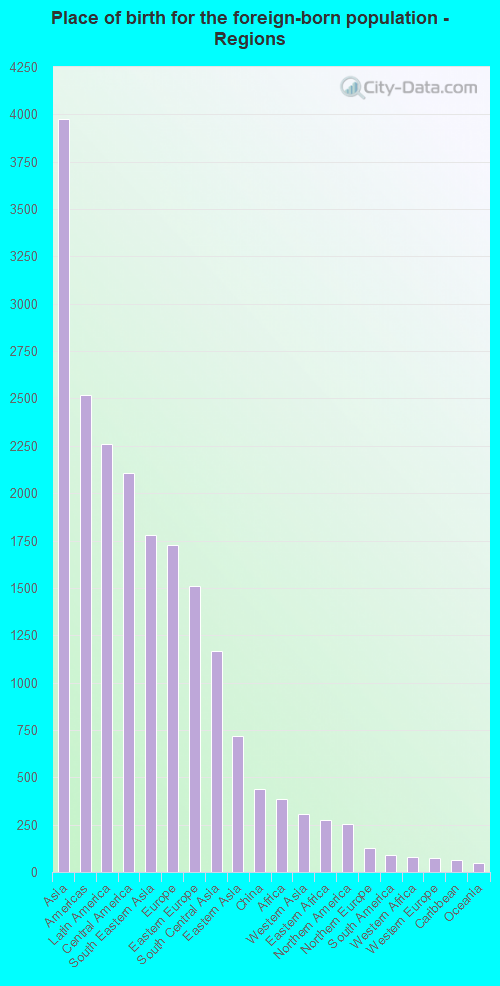
According to 2022 data, the most numerous races in Marysville, WA are White alone (48,806 residents), Hispanic (10,281 residents), and Asian alone (7,944 residents). 79.2% of Marysville residents speak English at home. 12.0% of Marysville, WA residents are foreign-born (5.4% born in Asia, 3.1% born in Latin America, 2.3% born in Europe), which is 24.5% less than the foreign-born rate of 15.0% across the entire state of Washington.
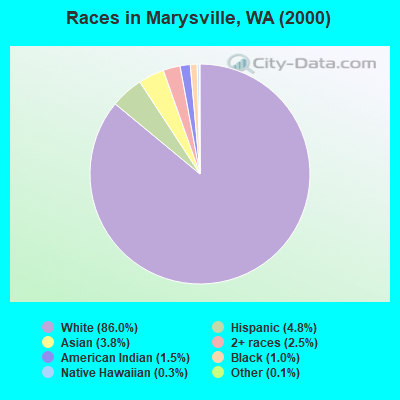
Race distribution in Marysville
2000 2022
4,652,490 78.9% White alone 441,509 7.5% Hispanic 319,401 5.4% Asian alone 184,631 3.1% Black alone 175,926 3.0% Two or more races 85,396 1.4% American Indian alone 22,779 0.4% Native Hawaiian and Other 11,989 0.2% Other race alone
4,941,456 63.5% White alone 1,093,313 14.0% Hispanic 755,832 9.7% Asian alone 523,448 6.7% Two or more races 299,537 3.8% Black alone 69,024 0.9% American Indian alone 52,231 0.7% Native Hawaiian and Other 50,945 0.7% Other race alone
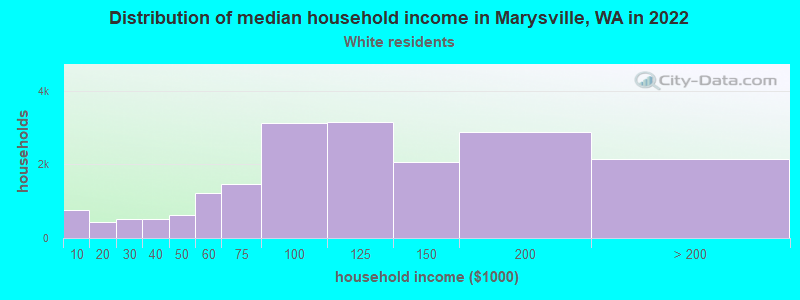
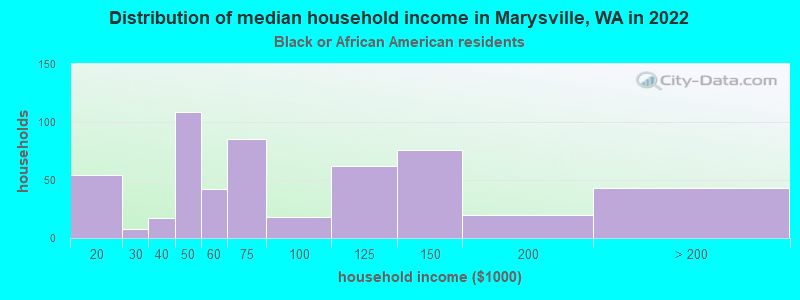
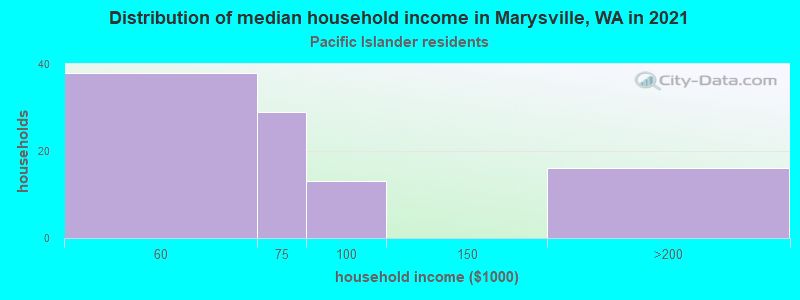
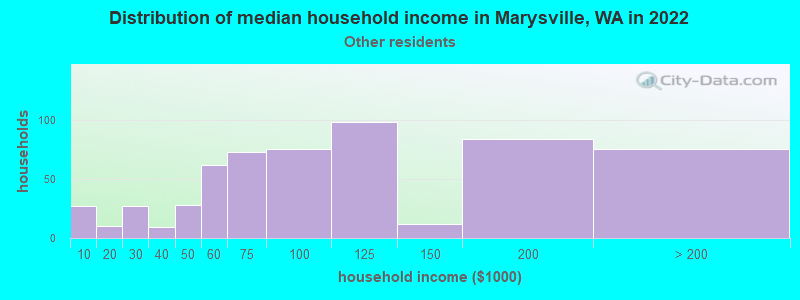
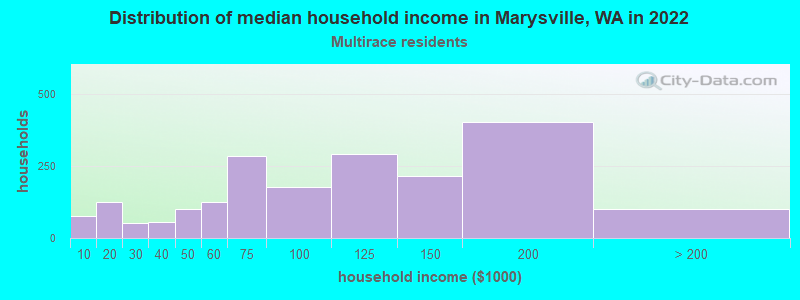
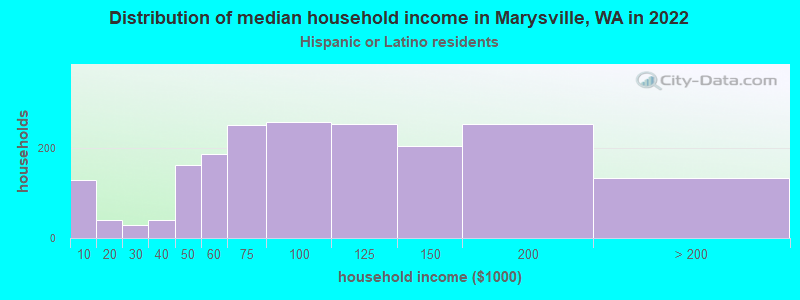
Income and house value in Marysville Median household income in 2022 $104,375 White non-Hispanic householders$103,961 Black householders$89,837 American Indian and Alaska Native householders$89,263 Asian householders$58,806 Some other race householders$119,864 Two or more races householders$118,024 Hispanic or Latino race householdersMedian 2022 house value $618,031 White Non-Hispanic householders$806,459 Black or African American householders$563,897 American Indian or Alaska Native householders $687,433 Asian householders$499,005 Some other race householders$629,829 Two or more races householders$519,132 Hispanic or Latino householders
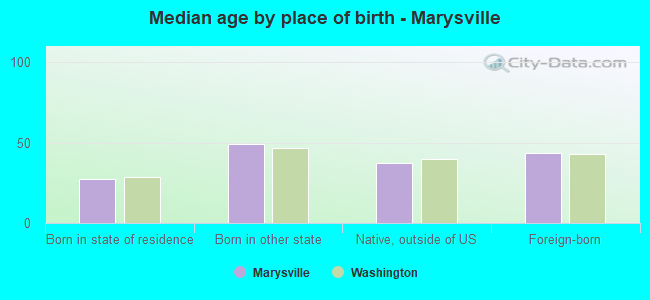
Median age by race in Marysville
39.9 Median age for White residents39.0 42.2 41.5 Median age for Black or African American residents40.5 44.8 28.9 Median age for American Indian / Alaska Native residents34.5 22.4 38.7 Median age for Asian residents35.9 45.4 46.1 Median age for Native Hawaiian / Pacific Islander residents-666,666,666.0 -666,666,666.0 32.7 Median age for Other race residents31.6 35.1 21.4 Median age for Two or more races residents21.4 21.5 40.1 Median age for White alone residents39.2 42.4 27.1 Median age for Hispanic or Latino residents28.1 22.4
Owner/renter occupied households by race in Marysville
House owners and renters - White residents 14,090 74.6% Owner occupied4,785 25.4% Renter occupiedHouse owners and renters - Black or African American residents 330 64.9% Owner occupied178 35.1% Renter occupiedHouse owners and renters - American Indian / Alaska Native residents 155 48.2% Owner occupied167 51.8% Renter occupiedHouse owners and renters - Asian residents 1,994 79.7% Owner occupied509 20.3% Renter occupiedHouse owners and renters - Native Hawaiian / Pacific Islander residents 8 13.2% Owner occupied54 86.8% Renter occupiedHouse owners and renters - Other race residents 220 48.4% Owner occupied235 51.6% Renter occupiedHouse owners and renters - Two or more races residents 1,143 64.0% Owner occupied644 36.0% Renter occupiedHouse owners and renters - White alone residents 14,011 74.8% Owner occupied4,732 25.2% Renter occupiedHouse owners and renters - Hispanic or Latino residents 1,093 62.1% Owner occupied668 37.9% Renter occupied
Language usage in Marysville
English speakers - Total 79.2% of residents of Marysville speak English at home.
7.3% of residents speak Spanish at home 3,350 67.3% Speak English very well1,629 32.7% Speak English less than very well13.5% of residents speak other language at home 4,620 49.9% Speak English very well4,638 50.1% Speak English less than very well
English speakers - Born in the United States 93.4% of residents of Marysville speak English at home.
6.6% of residents speak Spanish at home 941 73.1% Speak English very well346 26.9% Speak English less than very well
English speakers - Native, born elsewhere 68.3% of residents of Marysville speak English at home.
6.5% of residents speak Spanish at home 126 100.0% Speak English very well25.3% of residents speak other language at home 335 68.1% Speak English very well157 31.9% Speak English less than very well
English speakers - Foreign-born 18.6% of residents of Marysville speak English at home.
20.9% of residents speak Spanish at home 1,472 62.0% Speak English very well903 38.0% Speak English less than very well60.5% of residents speak other language at home 3,521 51.2% Speak English very well3,350 48.8% Speak English less than very well
White (Caucasian) - Speak only English Native:
96.3% (43,440)Foreign-born:
27.5% (709)
White (Caucasian) - Speak another language Native:
3.7% (1,678)Foreign-born:
72.5% (1,871)
Black or African American - Speak only English Native:
100.0% (1,135)Foreign-born:
54.5% (245)
Black or African American - Speak another language Native:
1.1% (12)Foreign-born:
59.0% (265)
American Indian / Alaska Native - Speak only English Native:
59.1% (488)Foreign-born:
5.1% (11)
American Indian / Alaska Native - Speak another language Native:
45.6% (376)Foreign-born:
97.7% (212)
Asian - Speak only English Native:
51.9% (1,096)Foreign-born:
17.9% (961)
Asian - Speak another language Native:
48.1% (1,015)Foreign-born:
82.1% (4,418)
Native Hawaiian / Pacific Islander - Speak only English Native:
57.0% (131)Foreign-born:
28.1% (15)
Other race - Speak only English Native:
64.2% (1,145)Foreign-born:
8.7% (82)
Other race - Speak another language Native:
35.8% (639)Foreign-born:
91.3% (858)
Two or more races - Speak only English Native:
82.7% (5,519)Foreign-born:
9.6% (107)
Two or more races - Speak another language Native:
17.3% (1,157)Foreign-born:
90.4% (1,007)
White alone - Speak only English Native:
96.9% (42,905)Foreign-born:
28.1% (709)
White alone - Speak another language Native:
3.1% (1,371)Foreign-born:
71.9% (1,818)
Hispanic or Latino - Speak only English Native:
65.2% (4,581)Foreign-born:
7.4% (189)
Hispanic or Latino - Speak another language Native:
34.8% (2,445)Foreign-born:
92.6% (2,375)
Foreign-born residents in Marysville 8,657 residents are foreign born (5.4% Asia , 3.1% Latin America , 2.3% Europe ).
This city:
12.0%Washington:
14.9%
Marital status for residents in Marysville Marital status - White (Caucasian) population 15 years and over
Males 33.3% Never married50.9% Now married0.0% Separated1.9% Widowed14.0% DivorcedFemales 28.0% Never married50.6% Now married1.1% Separated6.5% Widowed13.9% DivorcedWomen who gave birth in the past 12 months Now married:
50.0% (55)Unmarried:
50.0% (55)
Women who did not give birth in the past 12 months Now married:
46.2% (5,392)Unmarried:
53.8% (6,291)
Marital status - Black or African American population 15 years and over
Males 35.6% Never married50.3% Now married3.0% Separated0.0% Widowed11.1% DivorcedFemales 25.8% Never married57.4% Now married5.8% Separated10.4% Widowed0.6% DivorcedWomen who did not give birth in the past 12 months Now married:
70.5% (205)Unmarried:
29.5% (86)
Marital status - American Indian / Alaska Native population 15 years and over
Males 53.5% Never married39.3% Now married0.0% Separated1.7% Widowed5.5% DivorcedFemales 59.9% Never married32.8% Now married0.0% Separated0.0% Widowed7.3% DivorcedWomen who gave birth in the past 12 months Now married:
73.9% (25)Unmarried:
26.1% (9)
Women who did not give birth in the past 12 months Now married:
25.6% (107)Unmarried:
74.4% (311)
Marital status - Asian population 15 years and over
Males 26.1% Never married54.6% Now married0.0% Separated0.0% Widowed19.3% DivorcedFemales 11.8% Never married63.1% Now married0.0% Separated12.1% Widowed13.0% DivorcedWomen who gave birth in the past 12 months Now married:
100.0% (280)Unmarried:
0.0% (0)
Women who did not give birth in the past 12 months Now married:
62.3% (822)Unmarried:
37.7% (497)
Marital status - Native Hawaiian / Pacific Islander population 15 years and over
Males 88.1% Never married11.9% Now married0.0% Separated0.0% Widowed0.0% DivorcedFemales 17.6% Never married40.1% Now married0.0% Separated21.8% Widowed20.4% DivorcedWomen who did not give birth in the past 12 months Now married:
21.2% (12)Unmarried:
78.8% (44)
Marital status - Other race population 15 years and over
Males 31.6% Never married65.6% Now married0.9% Separated0.8% Widowed1.1% DivorcedFemales 34.0% Never married53.5% Now married0.0% Separated3.5% Widowed8.9% DivorcedWomen who gave birth in the past 12 months Now married:
58.7% (38)Unmarried:
41.3% (27)
Women who did not give birth in the past 12 months Now married:
53.9% (550)Unmarried:
46.1% (471)
Marital status - Two or more races population 15 years and over
Males 37.1% Never married50.6% Now married1.9% Separated1.9% Widowed8.5% DivorcedFemales 32.6% Never married47.0% Now married0.0% Separated11.0% Widowed9.4% DivorcedWomen who gave birth in the past 12 months Now married:
49.3% (119)Unmarried:
50.7% (122)
Women who did not give birth in the past 12 months Now married:
35.0% (670)Unmarried:
65.0% (1,245)
Marital status - White alone, not Hispanic / Latino population 15 years and over
Males 32.6% Never married51.1% Now married0.0% Separated2.0% Widowed14.3% DivorcedFemales 27.3% Never married50.8% Now married1.1% Separated6.6% Widowed14.2% DivorcedWomen who gave birth in the past 12 months Now married:
50.0% (55)Unmarried:
50.0% (55)
Women who did not give birth in the past 12 months Now married:
46.9% (5,346)Unmarried:
53.1% (6,052)
Marital status - Hispanic or Latino population 15 years and over
Males 45.6% Never married46.6% Now married0.3% Separated1.6% Widowed5.9% DivorcedFemales 31.7% Never married49.9% Now married1.7% Separated10.3% Widowed6.4% DivorcedWomen who gave birth in the past 12 months Now married:
65.8% (103)Unmarried:
34.2% (54)
Women who did not give birth in the past 12 months Now married:
50.9% (1,238)Unmarried:
49.1% (1,195)
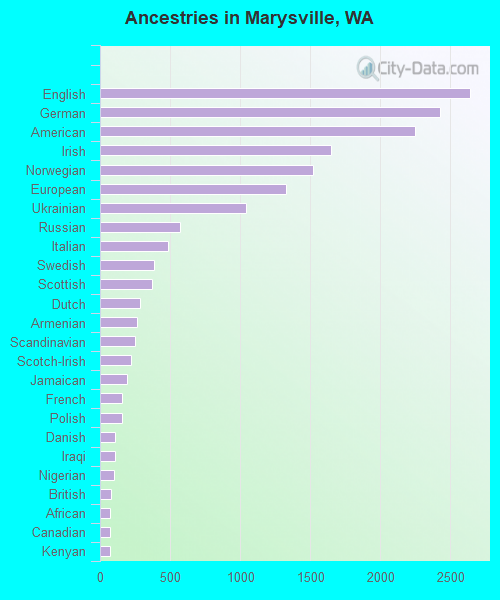
Ancestries in Marysville
2,646 8.2% English2,427 7.5% German2,248 6.9% American1,653 5.1% Irish1,522 4.7% Norwegian1,325 4.1% European1,041 3.2% Ukrainian570 1.8% Russian483 1.5% Italian384 1.2% Swedish373 1.2% Scottish287 0.9% Dutch266 0.8% Armenian247 0.8% Scandinavian222 0.7% Scotch-Irish196 0.6% Jamaican159 0.5% French155 0.5% Polish107 0.3% Danish104 0.3% Iraqi97 0.3% Nigerian82 0.3% British74 0.2% African72 0.2% Canadian72 0.2% Kenyan59 0.2% Romanian47 0.1% Finnish45 0.1% French Canadian42 0.1% Greek39 0.1% Czech34 0.1% Icelander33 0.1% Yugoslavian28 0.09% Portuguese26 0.08% Slovak22 0.07% Welsh21 0.06% Austrian16 0.05% Eastern European14 0.04% Swiss12 0.04% Syrian12 0.04% Latvian11 0.03% Maltese11 0.03% Hungarian10 0.03% Czechoslovakian9 0.03% Celtic9 0.03% Serbian8 0.02% Croatian8 0.02% Egyptian8 0.02% Ethiopian6 0.02% Brazilian6 0.02% Slavic5 0.02% Ugandan5 0.02% Northern European2 0.01% Pennsylvania German
Geographical mobility in Marysville Same house 1 year ago 45,406 91.3% White (Caucasian)1,391 83.9% Black or African American880 80.7% American Indian / Alaska Native4,096 70.3% Asian227 90.2% Native Hawaiian / Pacific Islander3,414 89.7% Other race8,538 91.7% Two or more races44,705 91.7% White alone, not Hispanic / Latino8,980 88.6% Hispanic or LatinoMoved within same county 2,810 5.7% White / Caucasian58 3.5% Black or African American140 12.8% American Indian / Alaska Native1,292 22.2% Asian27 10.7% Native Hawaiian / Pacific Islander167 4.4% Other race533 5.7% Two or more races2,609 5.4% White alone, not Hispanic / Latino1,103 10.9% Hispanic or LatinoMoved within same state 1,377 2.8% White / Caucasian39 2.3% Black or African American1 0.1% American Indian / Alaska Native419 7.2% Asian31 0.8% Other race102 1.1% Two or more races1,377 2.8% White alone, not Hispanic / LatinoMoved from different state 123 0.2% White / Caucasian83 5.0% Black or African American30 2.7% American Indian / Alaska Native38 0.7% Asian169 4.5% Other race153 1.6% Two or more races70 0.1% White alone, not Hispanic / Latino53 0.5% Hispanic or LatinoMoved from abroad 68 4.1% Black or African American252 4.3% Asian
Children Nativity (place of birth) in Marysville
Children under 6 years - Living with two parents Both parents native 2,283 100.0% NativeBoth parents foreign-born 986 94.9% Native53 5.1% Foreign-bornOne native, one foreign-born parent 756 100.0% NativeChildren under 6 years - Living with one parent Native parent 527 100.0% NativeForeign-born parent 133 100.0% NativeChildren 6 to 17 years - Living with two parents Both parents native 4,137 100.0% NativeBoth parents foreign-born 2,092 83.8% Native405 16.2% Foreign-bornOne native, one foreign-born parent 1,777 100.0% NativeChildren 6 to 17 years - Living with one parent Native parent 3,006 100.0% NativeForeign-born parent 243 55.1% Native198 44.9% Foreign-born
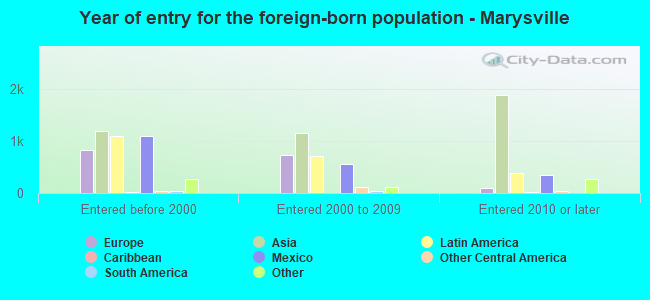
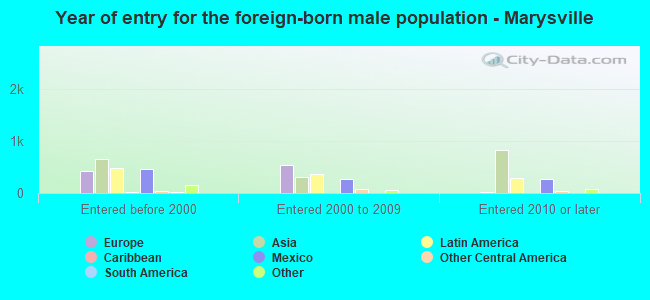
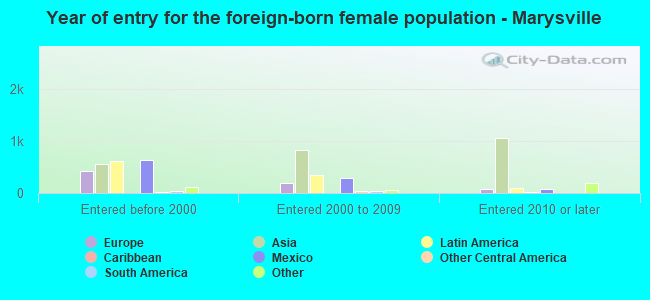
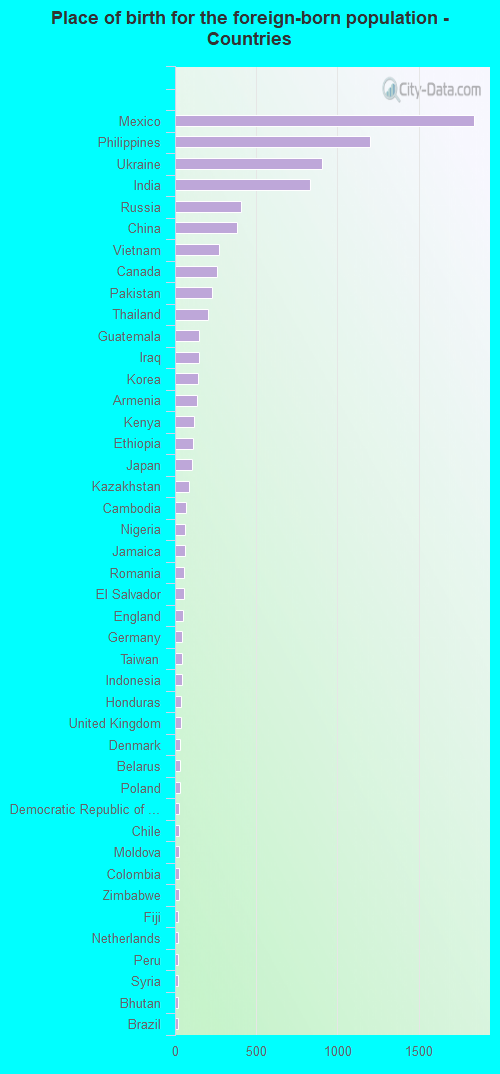
Place of birth for residents in Marysville 3,976 Asia2,519 Americas2,262 Latin America2,106 Central America1,781 South Eastern Asia1,725 Europe1,511 Eastern Europe1,169 South Central Asia718 Eastern Asia438 China388 Africa307 Western Asia272 Eastern Africa256 Northern America129 Northern Europe90 South America77 Western Africa72 Western Europe65 Caribbean47 Oceania27 Middle Africa11 Southern Europe6 Northern Africa5 Southern Africa1,842 Mexico1,199 Philippines907 Ukraine834 India407 Russia383 China272 Vietnam256 Canada230 Pakistan202 Thailand149 Guatemala147 Iraq141 Korea134 Armenia116 Kenya109 Ethiopia104 Japan86 Kazakhstan65 Cambodia62 Nigeria59 Jamaica58 Romania55 El Salvador51 England46 Germany46 Taiwan41 Indonesia39 Honduras36 United Kingdom33 Denmark31 Belarus30 Poland27 Democratic Republic of Congo (Zaire)27 Chile24 Moldova24 Colombia23 Zimbabwe21 Fiji20 Netherlands20 Peru18 Syria17 Bhutan17 Brazil10 Panama9 Nicaragua8 Hong Kong7 Israel6 Egypt6 Cuba5 South Africa5 France4 Uganda
Grandparents responsible for own grandchildren in Marysville
Grandparents (30 to 59 years) White / Caucasian 112 21.4% Responsible for grandchildren410 78.6% Not responsible for grandchildrenBlack or African American 76 100.0% Not responsible for grandchildrenAmerican Indian / Alaska Native 10 100.0% Responsible for grandchildrenAsian 113 100.0% Not responsible for grandchildrenTwo or more races 13 100.0% Responsible for grandchildrenWhite alone, not Hispanic / Latino 119 23.0% Responsible for grandchildren398 77.0% Not responsible for grandchildrenHispanic or Latino 24 100.0% Not responsible for grandchildrenGrandparents (60 years and over) White / Caucasian 18 3.9% Responsible for grandchildren450 96.1% Not responsible for grandchildrenBlack or African American 20 100.0% Not responsible for grandchildrenAsian 17 27.8% Responsible for grandchildren45 72.2% Not responsible for grandchildrenTwo or more races 8 16.0% Responsible for grandchildren43 84.0% Not responsible for grandchildrenWhite alone, not Hispanic / Latino 18 4.0% Responsible for grandchildren432 96.0% Not responsible for grandchildrenHispanic or Latino 5 3.9% Responsible for grandchildren121 96.1% Not responsible for grandchildren