Races in Marysville, Ohio (OH) Detailed Stats
Data:
Races - White alone (%)
Races - White alone (% change since 2000)
Races - Black alone (%)
Races - Black alone (% change since 2000)
Races - American Indian alone (%)
Races - American Indian alone (% change since 2000)
Races - Asian alone (%)
Races - Asian alone (% change since 2000)
Races - Hispanic (%)
Races - Hispanic (% change since 2000)
Races - Native Hawaiian and Other Pacific Islander alone (%)
Races - Native Hawaiian and Other Pacific Islander alone (% change since 2000)
Races - Two or more races(%)
Races - Two or more races(% change since 2000)
Races - Other race alone (%)
Races - Other race alone (% change since 2000)
Racial diversity
Place of birth - Born in state of residence (%)
Place of birth - Born in state of residence (%) - White
Place of birth - Born in state of residence (%) - Black or African American
Place of birth - Born in state of residence (%) - Asian
Place of birth - Born in state of residence (%) - Hispanic or Latino
Place of birth - Born in state of residence (%) - American Indian and Alaska Native
Place of birth - Born in state of residence (%) - Multirace
Place of birth - Born in state of residence (%) - Other Race
Place of birth - Born in other state (%)
Place of birth - Born in other state (%) - White
Place of birth - Born in other state (%) - Black or African American
Place of birth - Born in other state (%) - Asian
Place of birth - Born in other state (%) - Hispanic or Latino
Place of birth - Born in other state (%) - American Indian and Alaska Native
Place of birth - Born in other state (%) - Multirace
Place of birth - Born in other state (%) - Other Race
Place of birth - Native, outside of US (%)
Place of birth - Native, outside of US (%) - White
Place of birth - Native, outside of US (%) - Black or African American
Place of birth - Native, outside of US (%) - Asian
Place of birth - Native, outside of US (%) - Hispanic or Latino
Place of birth - Native, outside of US (%) - American Indian and Alaska Native
Place of birth - Native, outside of US (%) - Multirace
Place of birth - Native, outside of US (%) - Other Race
Place of birth - Foreign born (%)
Place of birth - Foreign born (%) - White
Place of birth - Foreign born (%) - Black or African American
Place of birth - Foreign born (%) - Asian
Place of birth - Foreign born (%) - Hispanic or Latino
Place of birth - Foreign born (%) - American Indian and Alaska Native
Place of birth - Foreign born (%) - Multirace
Place of birth - Foreign born (%) - Other Race
Residents speaking English at home (%)
Residents speaking English at home - Born in the United States (%)
Residents speaking English at home - Native, born elsewhere (%)
Residents speaking English at home - Foreign born (%)
Residents speaking Spanish at home (%)
Residents speaking Spanish at home - Born in the United States (%)
Residents speaking Spanish at home - Native, born elsewhere (%)
Residents speaking Spanish at home - Foreign born (%)
Residents speaking other language at home (%)
Residents speaking other language at home - Born in the United States (%)
Residents speaking other language at home - Native, born elsewhere (%)
Residents speaking other language at home - Foreign born (%)
Marital status - Never married (%)
Marital status - Now married (%)
Marital status - Separated (%)
Marital status - Widowed (%)
Marital status - Divorced (%)
Ancestries Reported - Arab (%)
Ancestries Reported - Czech (%)
Ancestries Reported - Danish (%)
Ancestries Reported - Dutch (%)
Ancestries Reported - English (%)
Ancestries Reported - French (%)
Ancestries Reported - French Canadian (%)
Ancestries Reported - German (%)
Ancestries Reported - Greek (%)
Ancestries Reported - Hungarian (%)
Ancestries Reported - Irish (%)
Ancestries Reported - Italian (%)
Ancestries Reported - Lithuanian (%)
Ancestries Reported - Norwegian (%)
Ancestries Reported - Polish (%)
Ancestries Reported - Portuguese (%)
Ancestries Reported - Russian (%)
Ancestries Reported - Scotch-Irish (%)
Ancestries Reported - Scottish (%)
Ancestries Reported - Slovak (%)
Ancestries Reported - Subsaharan African (%)
Ancestries Reported - Swedish (%)
Ancestries Reported - Swiss (%)
Ancestries Reported - Ukrainian (%)
Ancestries Reported - United States (%)
Ancestries Reported - Welsh (%)
Ancestries Reported - West Indian (%)
Ancestries Reported - Other (%)
Geographical mobility - Same house 1 year ago (%)
Geographical mobility - Same house 1 year ago (%) - White
Geographical mobility - Same house 1 year ago (%) - Black or African American
Geographical mobility - Same house 1 year ago (%) - Asian
Geographical mobility - Same house 1 year ago (%) - Hispanic or Latino
Geographical mobility - Same house 1 year ago (%) - American Indian and Alaska Native
Geographical mobility - Same house 1 year ago (%) - Multirace
Geographical mobility - Same house 1 year ago (%) - Other Race
Geographical mobility - Moved within same county (%)
Geographical mobility - Moved within same county (%) - White
Geographical mobility - Moved within same county (%) - Black or African American
Geographical mobility - Moved within same county (%) - Asian
Geographical mobility - Moved within same county (%) - Hispanic or Latino
Geographical mobility - Moved within same county (%) - American Indian and Alaska Native
Geographical mobility - Moved within same county (%) - Multirace
Geographical mobility - Moved within same county (%) - Other Race
Geographical mobility - Moved from different county within same state (%)
Geographical mobility - Moved from different county within same state (%) - White
Geographical mobility - Moved from different county within same state (%) - Black or African American
Geographical mobility - Moved from different county within same state (%) - Asian
Geographical mobility - Moved from different county within same state (%) - Hispanic or Latino
Geographical mobility - Moved from different county within same state (%) - American Indian and Alaska Native
Geographical mobility - Moved from different county within same state (%) - Multirace
Geographical mobility - Moved from different county within same state (%) - Other Race
Geographical mobility - Moved from different state (%)
Geographical mobility - Moved from different state (%) - White
Geographical mobility - Moved from different state (%) - Black or African American
Geographical mobility - Moved from different state (%) - Asian
Geographical mobility - Moved from different state (%) - Hispanic or Latino
Geographical mobility - Moved from different state (%) - American Indian and Alaska Native
Geographical mobility - Moved from different state (%) - Multirace
Geographical mobility - Moved from different state (%) - Other Race
Geographical mobility - Moved from abroad (%)
Geographical mobility - Moved from abroad (%) - White
Geographical mobility - Moved from abroad (%) - Black or African American
Geographical mobility - Moved from abroad (%) - Asian
Geographical mobility - Moved from abroad (%) - Hispanic or Latino
Geographical mobility - Moved from abroad (%) - American Indian and Alaska Native
Geographical mobility - Moved from abroad (%) - Multirace
Geographical mobility - Moved from abroad (%) - Other Race
Place of birth for the foreign-born population - Ireland (%)
Place of birth for the foreign-born population - Denmark (%)
Place of birth for the foreign-born population - Norway (%)
Place of birth for the foreign-born population - Sweden (%)
Place of birth for the foreign-born population - United Kingdom (%)
Place of birth for the foreign-born population - England (%)
Place of birth for the foreign-born population - Scotland (%)
Place of birth for the foreign-born population - Other Northern Europe (%)
Place of birth for the foreign-born population - Austria (%)
Place of birth for the foreign-born population - Belgium (%)
Place of birth for the foreign-born population - France (%)
Place of birth for the foreign-born population - Germany (%)
Place of birth for the foreign-born population - Netherlands (%)
Place of birth for the foreign-born population - Switzerland (%)
Place of birth for the foreign-born population - Other Western Europe (%)
Place of birth for the foreign-born population - Greece (%)
Place of birth for the foreign-born population - Italy (%)
Place of birth for the foreign-born population - Portugal (%)
Place of birth for the foreign-born population - Spain (%)
Place of birth for the foreign-born population - Other Southern Europe (%)
Place of birth for the foreign-born population - Albania (%)
Place of birth for the foreign-born population - Belarus (%)
Place of birth for the foreign-born population - Bosnia and Herzegovina (%)
Place of birth for the foreign-born population - Bulgaria (%)
Place of birth for the foreign-born population - Croatia (%)
Place of birth for the foreign-born population - Czechoslovakia (%)
Place of birth for the foreign-born population - Hungary (%)
Place of birth for the foreign-born population - Latvia (%)
Place of birth for the foreign-born population - Lithuania (%)
Place of birth for the foreign-born population - North Macedonia (Macedonia) (%)
Place of birth for the foreign-born population - Moldova (%)
Place of birth for the foreign-born population - Poland (%)
Place of birth for the foreign-born population - Romania (%)
Place of birth for the foreign-born population - Russia (%)
Place of birth for the foreign-born population - Serbia (%)
Place of birth for the foreign-born population - Ukraine (%)
Place of birth for the foreign-born population - Other Eastern Europe (%)
Place of birth for the foreign-born population - China (%)
Place of birth for the foreign-born population - Hong Kong (%)
Place of birth for the foreign-born population - Taiwan (%)
Place of birth for the foreign-born population - Japan (%)
Place of birth for the foreign-born population - Korea (%)
Place of birth for the foreign-born population - Other Eastern Asia (%)
Place of birth for the foreign-born population - Afghanistan (%)
Place of birth for the foreign-born population - Bangladesh (%)
Place of birth for the foreign-born population - India (%)
Place of birth for the foreign-born population - Iran (%)
Place of birth for the foreign-born population - Kazakhstan (%)
Place of birth for the foreign-born population - Nepal (%)
Place of birth for the foreign-born population - Pakistan (%)
Place of birth for the foreign-born population - Sri Lanka (%)
Place of birth for the foreign-born population - Uzbekistan (%)
Place of birth for the foreign-born population - Other South Central Asia (%)
Place of birth for the foreign-born population - Burma (%)
Place of birth for the foreign-born population - Cambodia (%)
Place of birth for the foreign-born population - Indonesia (%)
Place of birth for the foreign-born population - Laos (%)
Place of birth for the foreign-born population - Malaysia (%)
Place of birth for the foreign-born population - Philippines (%)
Place of birth for the foreign-born population - Singapore (%)
Place of birth for the foreign-born population - Thailand (%)
Place of birth for the foreign-born population - Vietnam (%)
Place of birth for the foreign-born population - Other South Eastern Asia (%)
Place of birth for the foreign-born population - Armenia (%)
Place of birth for the foreign-born population - Iraq (%)
Place of birth for the foreign-born population - Israel (%)
Place of birth for the foreign-born population - Jordan (%)
Place of birth for the foreign-born population - Kuwait (%)
Place of birth for the foreign-born population - Lebanon (%)
Place of birth for the foreign-born population - Saudi Arabia (%)
Place of birth for the foreign-born population - Syria (%)
Place of birth for the foreign-born population - Turkey (%)
Place of birth for the foreign-born population - Yemen (%)
Place of birth for the foreign-born population - Other Western Asia (%)
Place of birth for the foreign-born population - Eritrea (%)
Place of birth for the foreign-born population - Ethiopia (%)
Place of birth for the foreign-born population - Kenya (%)
Place of birth for the foreign-born population - Somalia (%)
Place of birth for the foreign-born population - Uganda (%)
Place of birth for the foreign-born population - Zimbabwe (%)
Place of birth for the foreign-born population - Other Eastern Africa (%)
Place of birth for the foreign-born population - Cameroon (%)
Place of birth for the foreign-born population - Congo (%)
Place of birth for the foreign-born population - Democratic Republic of Congo (Zaire) (%)
Place of birth for the foreign-born population - Other Middle Africa (%)
Place of birth for the foreign-born population - Egypt (%)
Place of birth for the foreign-born population - Morocco (%)
Place of birth for the foreign-born population - Sudan (%)
Place of birth for the foreign-born population - Other Northern Africa (%)
Place of birth for the foreign-born population - South Africa (%)
Place of birth for the foreign-born population - Other Southern Africa (%)
Place of birth for the foreign-born population - Cabo Verde (%)
Place of birth for the foreign-born population - Ghana (%)
Place of birth for the foreign-born population - Liberia (%)
Place of birth for the foreign-born population - Nigeria (%)
Place of birth for the foreign-born population - Senegal (%)
Place of birth for the foreign-born population - Sierra Leone (%)
Place of birth for the foreign-born population - Other Western Africa (%)
Place of birth for the foreign-born population - Australia (%)
Place of birth for the foreign-born population - New Zealand (%)
Place of birth for the foreign-born population - Fiji (%)
Place of birth for the foreign-born population - Micronesia (%)
Place of birth for the foreign-born population - Bahamas (%)
Place of birth for the foreign-born population - Barbados (%)
Place of birth for the foreign-born population - Cuba (%)
Place of birth for the foreign-born population - Dominica (%)
Place of birth for the foreign-born population - Dominican Republic (%)
Place of birth for the foreign-born population - Grenada (%)
Place of birth for the foreign-born population - Haiti (%)
Place of birth for the foreign-born population - Jamaica (%)
Place of birth for the foreign-born population - St. Vincent and the Grenadines (%)
Place of birth for the foreign-born population - Trinidad and Tobago (%)
Place of birth for the foreign-born population - West Indies (%)
Place of birth for the foreign-born population - Other Caribbean (%)
Place of birth for the foreign-born population - Belize (%)
Place of birth for the foreign-born population - Costa Rica (%)
Place of birth for the foreign-born population - El Salvador (%)
Place of birth for the foreign-born population - Guatemala (%)
Place of birth for the foreign-born population - Honduras (%)
Place of birth for the foreign-born population - Mexico (%)
Place of birth for the foreign-born population - Nicaragua (%)
Place of birth for the foreign-born population - Panama (%)
Place of birth for the foreign-born population - Other Central America (%)
Place of birth for the foreign-born population - Argentina (%)
Place of birth for the foreign-born population - Bolivia (%)
Place of birth for the foreign-born population - Brazil (%)
Place of birth for the foreign-born population - Chile (%)
Place of birth for the foreign-born population - Colombia (%)
Place of birth for the foreign-born population - Ecuador (%)
Place of birth for the foreign-born population - Guyana (%)
Place of birth for the foreign-born population - Peru (%)
Place of birth for the foreign-born population - Uruguay (%)
Place of birth for the foreign-born population - Venezuela (%)
Place of birth for the foreign-born population - Other South America (%)
Place of birth for the foreign-born population - Canada (%)
Place of birth for the foreign-born population - Other Northern America (%)
Place of birth for the foreign-born population - Other (%)
Latest news about races in Marysville, OH collected exclusively by city-data.com from local newspapers, TV, and radio stations
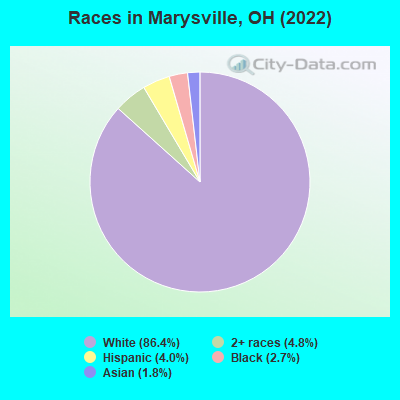
According to 2022 data, the most numerous races in Marysville, OH are White alone (22,263 residents), Black alone (700 residents), and Two or more races (1,234 residents). 94.0% of Marysville residents speak English at home. 4.1% of Marysville, OH residents are foreign-born (2.4% born in Asia, 1.0% born in Latin America), which is about the same as the foreign-born rate of 4.0% across the entire state of Ohio.
Race distribution in Marysville
2000 2022
9,538,111 84.0% White alone 1,290,662 11.4% Black alone 217,123 1.9% Hispanic 137,770 1.2% Two or more races 131,670 1.2% Asian alone 21,985 0.2% American Indian alone 13,483 0.1% Other race alone 2,336 0.02% Native Hawaiian and Other
8,948,793 76.1% White alone 1,401,403 11.9% Black alone 529,291 4.5% Two or more races 517,232 4.4% Hispanic 293,387 2.5% Asian alone 52,805 0.4% Other race alone 9,785 0.08% American Indian alone 3,362 0.03% Native Hawaiian and Other
Income and house value in Marysville Median household income in 2022 $88,323 White non-Hispanic householders$198,063 Black householders$70,999 Asian householders$127,819 Two or more races householders$160,395 Hispanic or Latino race householdersMedian 2022 house value $330,241 White Non-Hispanic householders$222,819 Black or African American householders $396,539 Asian householders$322,764 Two or more races householders$244,503 Hispanic or Latino householders
Median age by race in Marysville
38.8 Median age for White residents37.6 39.2 55.4 Median age for Black or African American residents72.1 57.0 71.2 Median age for American Indian / Alaska Native residents-685,185,184.5 78.1 38.3 Median age for Asian residents36.4 38.6 -666,666,666.0 Median age for Native Hawaiian / Pacific Islander residents-666,666,666.0 -666,666,666.0 12.2 Median age for Other race residents31.9 16.9 32.6 Median age for Two or more races residents24.4 36.1 38.9 Median age for White alone residents37.7 39.2 33.5 Median age for Hispanic or Latino residents32.4 21.1
Owner/renter occupied households by race in Marysville
House owners and renters - White residents 6,802 73.2% Owner occupied2,495 26.8% Renter occupiedHouse owners and renters - Black or African American residents 61 68.8% Owner occupied28 31.2% Renter occupiedHouse owners and renters - Asian residents 73 46.6% Owner occupied84 53.4% Renter occupiedHouse owners and renters - Other race residents 73 89.3% Owner occupied9 10.7% Renter occupiedHouse owners and renters - Two or more races residents 243 33.9% Owner occupied475 66.1% Renter occupiedHouse owners and renters - White alone residents 6,794 73.3% Owner occupied2,478 26.7% Renter occupiedHouse owners and renters - Hispanic or Latino residents 218 77.6% Owner occupied63 22.4% Renter occupied
Language usage in Marysville
English speakers - Total 94.0% of residents of Marysville speak English at home.
1.8% of residents speak Spanish at home 254 58.9% Speak English very well177 41.1% Speak English less than very well4.2% of residents speak other language at home 839 80.8% Speak English very well199 19.2% Speak English less than very well
English speakers - Born in the United States 98.1% of residents of Marysville speak English at home.
1.3% of residents speak Spanish at home 58 100.0% Speak English very well0.5% of residents speak other language at home 25 100.0% Speak English very well
English speakers - Native, born elsewhere 43.6% of residents of Marysville speak English at home.
27.0% of residents speak Spanish at home 12 27.3% Speak English very well32 72.7% Speak English less than very well28.8% of residents speak other language at home 47 100.0% Speak English very well
English speakers - Foreign-born 9.9% of residents of Marysville speak English at home.
19.6% of residents speak Spanish at home 128 60.4% Speak English very well84 39.6% Speak English less than very well71.0% of residents speak other language at home 613 79.7% Speak English very well156 20.3% Speak English less than very well
White (Caucasian) - Speak only English Native:
98.6% (20,767)Foreign-born:
13.3% (45)
White (Caucasian) - Speak another language Native:
1.5% (308)Foreign-born:
84.0% (282)
Black or African American - Speak only English Native:
98.3% (616)Foreign-born:
47.0% (35)
Black or African American - Speak another language Native:
1.7% (10)Foreign-born:
55.0% (41)
Asian - Speak only English Native:
87.1% (69)Foreign-born:
4.0% (17)
Asian - Speak another language Native:
16.2% (13)Foreign-born:
95.2% (394)
Other race - Speak only English Native:
30.2% (17)Foreign-born:
8.5% (12)
Other race - Speak another language Native:
71.9% (40)Foreign-born:
91.6% (134)
Two or more races - Speak only English Native:
93.9% (1,550)Foreign-born:
3.8% (6)
Two or more races - Speak another language Native:
5.6% (93)Foreign-born:
98.8% (156)
White alone - Speak only English Native:
98.6% (20,643)Foreign-born:
12.9% (46)
White alone - Speak another language Native:
1.4% (295)Foreign-born:
86.6% (309)
Hispanic or Latino - Speak only English Native:
78.3% (547)Foreign-born:
5.7% (13)
Hispanic or Latino - Speak another language Native:
20.9% (146)Foreign-born:
94.5% (218)
Foreign-born residents in Marysville 1,106 residents are foreign born (2.4% Asia , 1.0% Latin America ).
Marital status for residents in Marysville Marital status - White (Caucasian) population 15 years and over
Males 32.6% Never married53.3% Now married1.1% Separated1.4% Widowed11.6% DivorcedFemales 31.9% Never married43.7% Now married1.3% Separated6.8% Widowed16.3% DivorcedWomen who gave birth in the past 12 months Now married:
36.1% (103)Unmarried:
63.9% (182)
Women who did not give birth in the past 12 months Now married:
39.4% (2,608)Unmarried:
60.6% (4,017)
Marital status - Black or African American population 15 years and over
Males 20.0% Never married75.4% Now married0.0% Separated0.0% Widowed4.6% DivorcedFemales 59.5% Never married29.2% Now married2.3% Separated0.6% Widowed8.3% DivorcedWomen who gave birth in the past 12 months Now married:
0.0% (0)Unmarried:
100.0% (10)
Women who did not give birth in the past 12 months Now married:
16.6% (64)Unmarried:
83.4% (323)
Marital status - Asian population 15 years and over
Males 0.0% Never married100.0% Now married0.0% Separated0.0% Widowed0.0% DivorcedFemales 20.4% Never married71.0% Now married0.0% Separated8.6% Widowed0.0% DivorcedWomen who gave birth in the past 12 months Now married:
100.0% (9)Unmarried:
0.0% (0)
Women who did not give birth in the past 12 months Now married:
73.9% (102)Unmarried:
26.1% (36)
Marital status - Other race population 15 years and over
Males 20.5% Never married79.5% Now married0.0% Separated0.0% Widowed0.0% DivorcedFemales 23.3% Never married76.7% Now married0.0% Separated0.0% Widowed0.0% DivorcedWomen who gave birth in the past 12 months Now married:
100.0% (8)Unmarried:
0.0% (0)
Women who did not give birth in the past 12 months Now married:
64.1% (33)Unmarried:
35.9% (18)
Marital status - Two or more races population 15 years and over
Males 56.7% Never married32.6% Now married4.6% Separated0.0% Widowed6.1% DivorcedFemales 40.8% Never married43.2% Now married6.6% Separated0.7% Widowed8.8% DivorcedWomen who gave birth in the past 12 months Now married:
0.0% (0)Unmarried:
100.0% (73)
Women who did not give birth in the past 12 months Now married:
51.6% (398)Unmarried:
48.4% (374)
Marital status - White alone, not Hispanic / Latino population 15 years and over
Males 31.8% Never married54.1% Now married1.1% Separated1.4% Widowed11.5% DivorcedFemales 31.7% Never married43.7% Now married1.3% Separated6.9% Widowed16.4% DivorcedWomen who gave birth in the past 12 months Now married:
36.1% (103)Unmarried:
63.9% (183)
Women who did not give birth in the past 12 months Now married:
39.4% (2,601)Unmarried:
60.6% (3,993)
Marital status - Hispanic or Latino population 15 years and over
Males 45.4% Never married40.1% Now married4.1% Separated0.0% Widowed10.4% DivorcedFemales 34.5% Never married63.2% Now married1.8% Separated0.0% Widowed0.6% DivorcedWomen who gave birth in the past 12 months Now married:
13.0% (6)Unmarried:
87.0% (42)
Women who did not give birth in the past 12 months Now married:
71.4% (212)Unmarried:
28.6% (85)
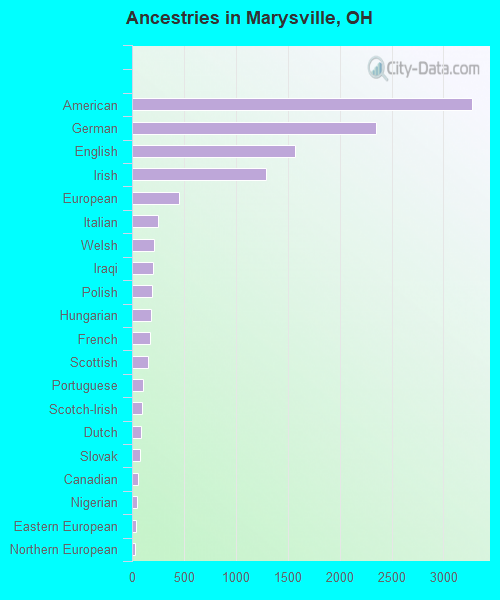
Ancestries in Marysville
3,275 25.1% American2,346 18.0% German1,569 12.0% English1,295 9.9% Irish455 3.5% European251 1.9% Italian209 1.6% Welsh205 1.6% Iraqi189 1.4% Polish185 1.4% Hungarian174 1.3% French155 1.2% Scottish105 0.8% Portuguese98 0.8% Scotch-Irish85 0.7% Dutch80 0.6% Slovak56 0.4% Canadian47 0.4% Nigerian41 0.3% Eastern European32 0.2% Northern European27 0.2% Scandinavian24 0.2% Danish22 0.2% British21 0.2% Czech19 0.1% Greek17 0.1% Norwegian16 0.1% Ukrainian15 0.1% Jamaican14 0.1% African12 0.09% Finnish10 0.08% Swiss8 0.06% Lebanese8 0.06% Swedish7 0.05% Somali5 0.04% Czechoslovakian
Geographical mobility in Marysville Same house 1 year ago 19,265 82.9% White (Caucasian)556 79.6% Black or African American12 38.3% American Indian / Alaska Native394 84.0% Asian147 68.0% Other race1,723 85.7% Two or more races19,170 82.8% White alone, not Hispanic / Latino847 84.3% Hispanic or LatinoMoved within same county 936 4.0% White / Caucasian8 1.1% Black or African American42 9.0% Asian45 20.8% Other race25 1.2% Two or more races933 4.0% White alone, not Hispanic / Latino71 7.1% Hispanic or LatinoMoved within same state 2,468 10.6% White / Caucasian148 21.2% Black or African American11 34.4% American Indian / Alaska Native33 7.1% Asian162 8.1% Two or more races2,468 10.7% White alone, not Hispanic / Latino68 6.7% Hispanic or LatinoMoved from different state 372 1.6% White / Caucasian10 1.4% Black or African American6 19.1% American Indian / Alaska Native5 1.1% Asian99 4.9% Two or more races378 1.6% White alone, not Hispanic / Latino7 0.7% Hispanic or LatinoMoved from abroad 19 0.1% White28 13.2% Other race2 0.1% Two or more races19 0.1% White alone, not Hispanic / Latino21 2.1% Hispanic or Latino
Children Nativity (place of birth) in Marysville
Children under 6 years - Living with two parents Both parents native 997 100.0% NativeBoth parents foreign-born 41 58.4% Native29 41.6% Foreign-bornOne native, one foreign-born parent 75 100.0% NativeChildren under 6 years - Living with one parent Native parent 282 100.0% NativeChildren 6 to 17 years - Living with two parents Both parents native 2,183 100.0% NativeBoth parents foreign-born 9 9.4% Native84 90.6% Foreign-bornOne native, one foreign-born parent 39 100.0% NativeChildren 6 to 17 years - Living with one parent Native parent 989 97.9% Native21 2.1% Foreign-bornForeign-born parent 25 95.9% Native1 4.1% Foreign-born
Grandparents responsible for own grandchildren in Marysville
Grandparents (30 to 59 years) White / Caucasian 44 100.0% Not responsible for grandchildrenWhite alone, not Hispanic / Latino 45 100.0% Not responsible for grandchildrenGrandparents (60 years and over) White / Caucasian 117 51.0% Responsible for grandchildren113 49.0% Not responsible for grandchildrenWhite alone, not Hispanic / Latino 117 50.8% Responsible for grandchildren114 49.2% Not responsible for grandchildren