Races in Marumsco, Virginia (VA) Detailed Stats
Data:
Races - White alone (%)
Races - White alone (% change since 2000)
Races - Black alone (%)
Races - Black alone (% change since 2000)
Races - American Indian alone (%)
Races - American Indian alone (% change since 2000)
Races - Asian alone (%)
Races - Asian alone (% change since 2000)
Races - Hispanic (%)
Races - Hispanic (% change since 2000)
Races - Native Hawaiian and Other Pacific Islander alone (%)
Races - Native Hawaiian and Other Pacific Islander alone (% change since 2000)
Races - Two or more races(%)
Races - Two or more races(% change since 2000)
Races - Other race alone (%)
Races - Other race alone (% change since 2000)
Racial diversity
Place of birth - Born in state of residence (%)
Place of birth - Born in state of residence (%) - White
Place of birth - Born in state of residence (%) - Black or African American
Place of birth - Born in state of residence (%) - Asian
Place of birth - Born in state of residence (%) - Hispanic or Latino
Place of birth - Born in state of residence (%) - American Indian and Alaska Native
Place of birth - Born in state of residence (%) - Multirace
Place of birth - Born in state of residence (%) - Other Race
Place of birth - Born in other state (%)
Place of birth - Born in other state (%) - White
Place of birth - Born in other state (%) - Black or African American
Place of birth - Born in other state (%) - Asian
Place of birth - Born in other state (%) - Hispanic or Latino
Place of birth - Born in other state (%) - American Indian and Alaska Native
Place of birth - Born in other state (%) - Multirace
Place of birth - Born in other state (%) - Other Race
Place of birth - Native, outside of US (%)
Place of birth - Native, outside of US (%) - White
Place of birth - Native, outside of US (%) - Black or African American
Place of birth - Native, outside of US (%) - Asian
Place of birth - Native, outside of US (%) - Hispanic or Latino
Place of birth - Native, outside of US (%) - American Indian and Alaska Native
Place of birth - Native, outside of US (%) - Multirace
Place of birth - Native, outside of US (%) - Other Race
Place of birth - Foreign born (%)
Place of birth - Foreign born (%) - White
Place of birth - Foreign born (%) - Black or African American
Place of birth - Foreign born (%) - Asian
Place of birth - Foreign born (%) - Hispanic or Latino
Place of birth - Foreign born (%) - American Indian and Alaska Native
Place of birth - Foreign born (%) - Multirace
Place of birth - Foreign born (%) - Other Race
Residents speaking English at home (%)
Residents speaking English at home - Born in the United States (%)
Residents speaking English at home - Native, born elsewhere (%)
Residents speaking English at home - Foreign born (%)
Residents speaking Spanish at home (%)
Residents speaking Spanish at home - Born in the United States (%)
Residents speaking Spanish at home - Native, born elsewhere (%)
Residents speaking Spanish at home - Foreign born (%)
Residents speaking other language at home (%)
Residents speaking other language at home - Born in the United States (%)
Residents speaking other language at home - Native, born elsewhere (%)
Residents speaking other language at home - Foreign born (%)
Marital status - Never married (%)
Marital status - Now married (%)
Marital status - Separated (%)
Marital status - Widowed (%)
Marital status - Divorced (%)
Ancestries Reported - Arab (%)
Ancestries Reported - Czech (%)
Ancestries Reported - Danish (%)
Ancestries Reported - Dutch (%)
Ancestries Reported - English (%)
Ancestries Reported - French (%)
Ancestries Reported - French Canadian (%)
Ancestries Reported - German (%)
Ancestries Reported - Greek (%)
Ancestries Reported - Hungarian (%)
Ancestries Reported - Irish (%)
Ancestries Reported - Italian (%)
Ancestries Reported - Lithuanian (%)
Ancestries Reported - Norwegian (%)
Ancestries Reported - Polish (%)
Ancestries Reported - Portuguese (%)
Ancestries Reported - Russian (%)
Ancestries Reported - Scotch-Irish (%)
Ancestries Reported - Scottish (%)
Ancestries Reported - Slovak (%)
Ancestries Reported - Subsaharan African (%)
Ancestries Reported - Swedish (%)
Ancestries Reported - Swiss (%)
Ancestries Reported - Ukrainian (%)
Ancestries Reported - United States (%)
Ancestries Reported - Welsh (%)
Ancestries Reported - West Indian (%)
Ancestries Reported - Other (%)
Geographical mobility - Same house 1 year ago (%)
Geographical mobility - Same house 1 year ago (%) - White
Geographical mobility - Same house 1 year ago (%) - Black or African American
Geographical mobility - Same house 1 year ago (%) - Asian
Geographical mobility - Same house 1 year ago (%) - Hispanic or Latino
Geographical mobility - Same house 1 year ago (%) - American Indian and Alaska Native
Geographical mobility - Same house 1 year ago (%) - Multirace
Geographical mobility - Same house 1 year ago (%) - Other Race
Geographical mobility - Moved within same county (%)
Geographical mobility - Moved within same county (%) - White
Geographical mobility - Moved within same county (%) - Black or African American
Geographical mobility - Moved within same county (%) - Asian
Geographical mobility - Moved within same county (%) - Hispanic or Latino
Geographical mobility - Moved within same county (%) - American Indian and Alaska Native
Geographical mobility - Moved within same county (%) - Multirace
Geographical mobility - Moved within same county (%) - Other Race
Geographical mobility - Moved from different county within same state (%)
Geographical mobility - Moved from different county within same state (%) - White
Geographical mobility - Moved from different county within same state (%) - Black or African American
Geographical mobility - Moved from different county within same state (%) - Asian
Geographical mobility - Moved from different county within same state (%) - Hispanic or Latino
Geographical mobility - Moved from different county within same state (%) - American Indian and Alaska Native
Geographical mobility - Moved from different county within same state (%) - Multirace
Geographical mobility - Moved from different county within same state (%) - Other Race
Geographical mobility - Moved from different state (%)
Geographical mobility - Moved from different state (%) - White
Geographical mobility - Moved from different state (%) - Black or African American
Geographical mobility - Moved from different state (%) - Asian
Geographical mobility - Moved from different state (%) - Hispanic or Latino
Geographical mobility - Moved from different state (%) - American Indian and Alaska Native
Geographical mobility - Moved from different state (%) - Multirace
Geographical mobility - Moved from different state (%) - Other Race
Geographical mobility - Moved from abroad (%)
Geographical mobility - Moved from abroad (%) - White
Geographical mobility - Moved from abroad (%) - Black or African American
Geographical mobility - Moved from abroad (%) - Asian
Geographical mobility - Moved from abroad (%) - Hispanic or Latino
Geographical mobility - Moved from abroad (%) - American Indian and Alaska Native
Geographical mobility - Moved from abroad (%) - Multirace
Geographical mobility - Moved from abroad (%) - Other Race
Place of birth for the foreign-born population - Ireland (%)
Place of birth for the foreign-born population - Denmark (%)
Place of birth for the foreign-born population - Norway (%)
Place of birth for the foreign-born population - Sweden (%)
Place of birth for the foreign-born population - United Kingdom (%)
Place of birth for the foreign-born population - England (%)
Place of birth for the foreign-born population - Scotland (%)
Place of birth for the foreign-born population - Other Northern Europe (%)
Place of birth for the foreign-born population - Austria (%)
Place of birth for the foreign-born population - Belgium (%)
Place of birth for the foreign-born population - France (%)
Place of birth for the foreign-born population - Germany (%)
Place of birth for the foreign-born population - Netherlands (%)
Place of birth for the foreign-born population - Switzerland (%)
Place of birth for the foreign-born population - Other Western Europe (%)
Place of birth for the foreign-born population - Greece (%)
Place of birth for the foreign-born population - Italy (%)
Place of birth for the foreign-born population - Portugal (%)
Place of birth for the foreign-born population - Spain (%)
Place of birth for the foreign-born population - Other Southern Europe (%)
Place of birth for the foreign-born population - Albania (%)
Place of birth for the foreign-born population - Belarus (%)
Place of birth for the foreign-born population - Bosnia and Herzegovina (%)
Place of birth for the foreign-born population - Bulgaria (%)
Place of birth for the foreign-born population - Croatia (%)
Place of birth for the foreign-born population - Czechoslovakia (%)
Place of birth for the foreign-born population - Hungary (%)
Place of birth for the foreign-born population - Latvia (%)
Place of birth for the foreign-born population - Lithuania (%)
Place of birth for the foreign-born population - North Macedonia (Macedonia) (%)
Place of birth for the foreign-born population - Moldova (%)
Place of birth for the foreign-born population - Poland (%)
Place of birth for the foreign-born population - Romania (%)
Place of birth for the foreign-born population - Russia (%)
Place of birth for the foreign-born population - Serbia (%)
Place of birth for the foreign-born population - Ukraine (%)
Place of birth for the foreign-born population - Other Eastern Europe (%)
Place of birth for the foreign-born population - China (%)
Place of birth for the foreign-born population - Hong Kong (%)
Place of birth for the foreign-born population - Taiwan (%)
Place of birth for the foreign-born population - Japan (%)
Place of birth for the foreign-born population - Korea (%)
Place of birth for the foreign-born population - Other Eastern Asia (%)
Place of birth for the foreign-born population - Afghanistan (%)
Place of birth for the foreign-born population - Bangladesh (%)
Place of birth for the foreign-born population - India (%)
Place of birth for the foreign-born population - Iran (%)
Place of birth for the foreign-born population - Kazakhstan (%)
Place of birth for the foreign-born population - Nepal (%)
Place of birth for the foreign-born population - Pakistan (%)
Place of birth for the foreign-born population - Sri Lanka (%)
Place of birth for the foreign-born population - Uzbekistan (%)
Place of birth for the foreign-born population - Other South Central Asia (%)
Place of birth for the foreign-born population - Burma (%)
Place of birth for the foreign-born population - Cambodia (%)
Place of birth for the foreign-born population - Indonesia (%)
Place of birth for the foreign-born population - Laos (%)
Place of birth for the foreign-born population - Malaysia (%)
Place of birth for the foreign-born population - Philippines (%)
Place of birth for the foreign-born population - Singapore (%)
Place of birth for the foreign-born population - Thailand (%)
Place of birth for the foreign-born population - Vietnam (%)
Place of birth for the foreign-born population - Other South Eastern Asia (%)
Place of birth for the foreign-born population - Armenia (%)
Place of birth for the foreign-born population - Iraq (%)
Place of birth for the foreign-born population - Israel (%)
Place of birth for the foreign-born population - Jordan (%)
Place of birth for the foreign-born population - Kuwait (%)
Place of birth for the foreign-born population - Lebanon (%)
Place of birth for the foreign-born population - Saudi Arabia (%)
Place of birth for the foreign-born population - Syria (%)
Place of birth for the foreign-born population - Turkey (%)
Place of birth for the foreign-born population - Yemen (%)
Place of birth for the foreign-born population - Other Western Asia (%)
Place of birth for the foreign-born population - Eritrea (%)
Place of birth for the foreign-born population - Ethiopia (%)
Place of birth for the foreign-born population - Kenya (%)
Place of birth for the foreign-born population - Somalia (%)
Place of birth for the foreign-born population - Uganda (%)
Place of birth for the foreign-born population - Zimbabwe (%)
Place of birth for the foreign-born population - Other Eastern Africa (%)
Place of birth for the foreign-born population - Cameroon (%)
Place of birth for the foreign-born population - Congo (%)
Place of birth for the foreign-born population - Democratic Republic of Congo (Zaire) (%)
Place of birth for the foreign-born population - Other Middle Africa (%)
Place of birth for the foreign-born population - Egypt (%)
Place of birth for the foreign-born population - Morocco (%)
Place of birth for the foreign-born population - Sudan (%)
Place of birth for the foreign-born population - Other Northern Africa (%)
Place of birth for the foreign-born population - South Africa (%)
Place of birth for the foreign-born population - Other Southern Africa (%)
Place of birth for the foreign-born population - Cabo Verde (%)
Place of birth for the foreign-born population - Ghana (%)
Place of birth for the foreign-born population - Liberia (%)
Place of birth for the foreign-born population - Nigeria (%)
Place of birth for the foreign-born population - Senegal (%)
Place of birth for the foreign-born population - Sierra Leone (%)
Place of birth for the foreign-born population - Other Western Africa (%)
Place of birth for the foreign-born population - Australia (%)
Place of birth for the foreign-born population - New Zealand (%)
Place of birth for the foreign-born population - Fiji (%)
Place of birth for the foreign-born population - Micronesia (%)
Place of birth for the foreign-born population - Bahamas (%)
Place of birth for the foreign-born population - Barbados (%)
Place of birth for the foreign-born population - Cuba (%)
Place of birth for the foreign-born population - Dominica (%)
Place of birth for the foreign-born population - Dominican Republic (%)
Place of birth for the foreign-born population - Grenada (%)
Place of birth for the foreign-born population - Haiti (%)
Place of birth for the foreign-born population - Jamaica (%)
Place of birth for the foreign-born population - St. Vincent and the Grenadines (%)
Place of birth for the foreign-born population - Trinidad and Tobago (%)
Place of birth for the foreign-born population - West Indies (%)
Place of birth for the foreign-born population - Other Caribbean (%)
Place of birth for the foreign-born population - Belize (%)
Place of birth for the foreign-born population - Costa Rica (%)
Place of birth for the foreign-born population - El Salvador (%)
Place of birth for the foreign-born population - Guatemala (%)
Place of birth for the foreign-born population - Honduras (%)
Place of birth for the foreign-born population - Mexico (%)
Place of birth for the foreign-born population - Nicaragua (%)
Place of birth for the foreign-born population - Panama (%)
Place of birth for the foreign-born population - Other Central America (%)
Place of birth for the foreign-born population - Argentina (%)
Place of birth for the foreign-born population - Bolivia (%)
Place of birth for the foreign-born population - Brazil (%)
Place of birth for the foreign-born population - Chile (%)
Place of birth for the foreign-born population - Colombia (%)
Place of birth for the foreign-born population - Ecuador (%)
Place of birth for the foreign-born population - Guyana (%)
Place of birth for the foreign-born population - Peru (%)
Place of birth for the foreign-born population - Uruguay (%)
Place of birth for the foreign-born population - Venezuela (%)
Place of birth for the foreign-born population - Other South America (%)
Place of birth for the foreign-born population - Canada (%)
Place of birth for the foreign-born population - Other Northern America (%)
Place of birth for the foreign-born population - Other (%)
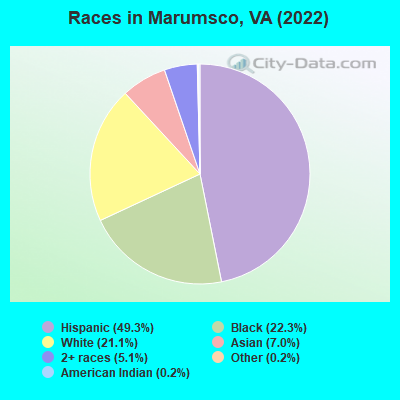
According to 2022 data, the most numerous races in Marumsco, VA are White alone (8,301 residents), Black alone (8,774 residents), and Hispanic (19,367 residents). 44.9% of Marumsco residents speak English at home.
Race distribution in Marumsco 19,367 49.3% Hispanic 8,774 22.3% Black alone 8,301 21.1% White alone 2,735 7.0% Asian alone 2,017 5.1% Two or more races 87 0.2% Other race alone 62 0.2% American Indian alone 35 0.09% Native Hawaiian and Other
2000 2022
4,965,637 70.2% White alone 1,376,378 19.4% Black alone 329,540 4.7% Hispanic 259,277 3.7% Asian alone 114,022 1.6% Two or more races 18,596 0.3% American Indian alone 11,685 0.2% Other race alone 3,380 0.05% Native Hawaiian and Other
5,095,130 58.7% White alone 1,594,785 18.4% Black alone 905,750 10.4% Hispanic 602,881 6.9% Asian alone 406,047 4.7% Two or more races 60,419 0.7% Other race alone 11,738 0.1% American Indian alone 6,869 0.08% Native Hawaiian and Other
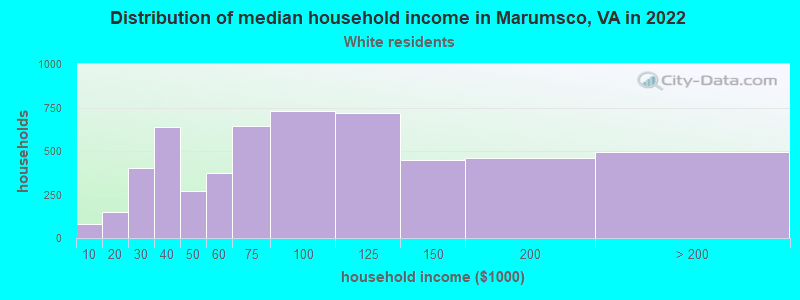
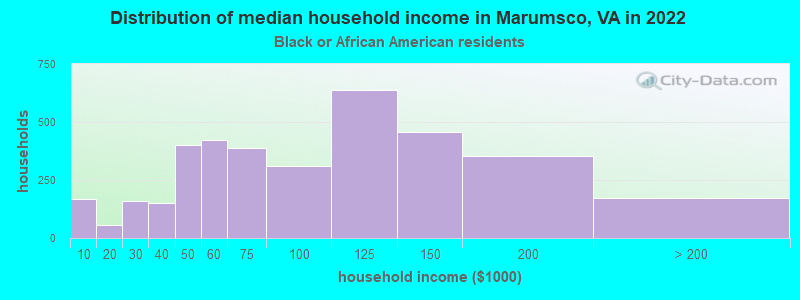
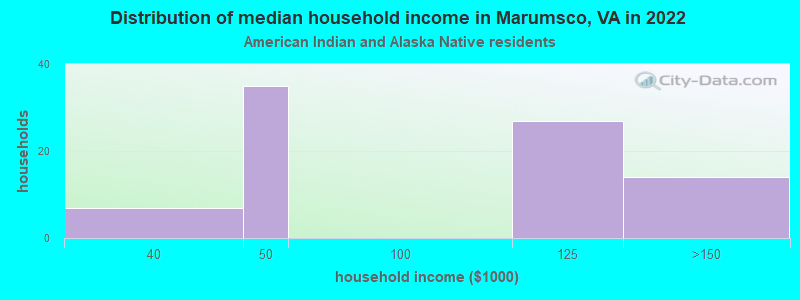
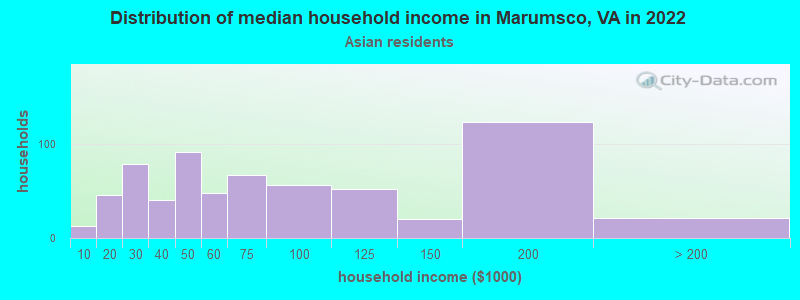
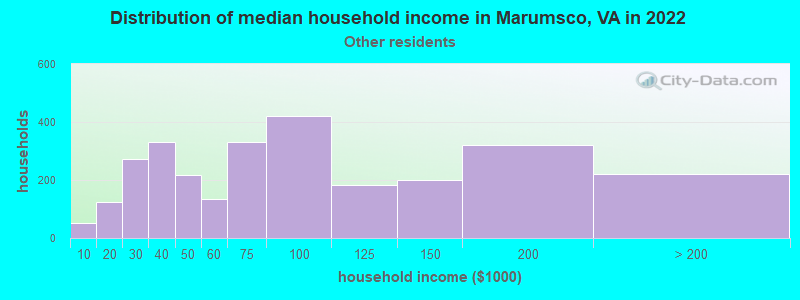
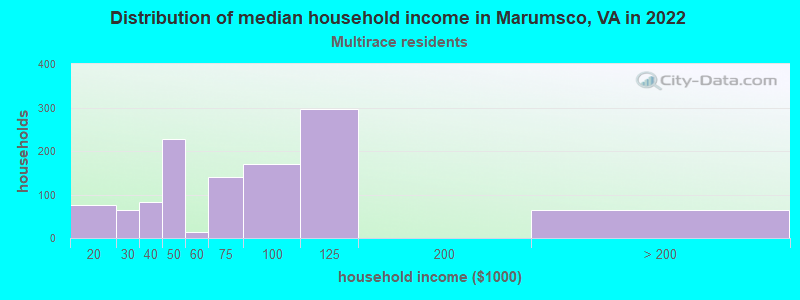
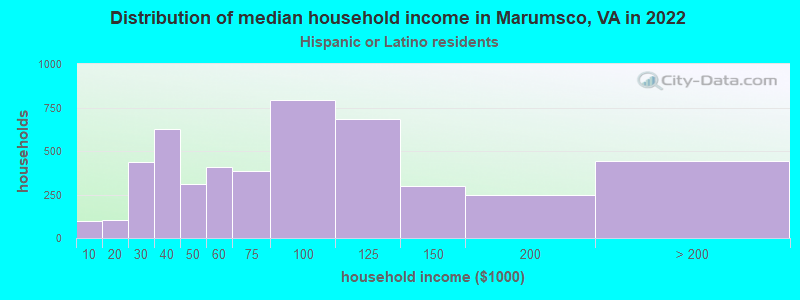
Income and house value in Marumsco Median household income in 2022 $92,555 White non-Hispanic householders$79,970 Black householders$65,686 Asian householders$67,170 Some other race householders$79,171 Two or more races householders$73,568 Hispanic or Latino race householders
Median age by race in Marumsco
35.4 Median age for White residents37.7 32.8 31.5 Median age for Black or African American residents32.3 30.6 32.2 Median age for American Indian / Alaska Native residents39.7 Median age for Asian residents45.2 38.3 28.8 Median age for Native Hawaiian / Pacific Islander residents35.3 Median age for Other race residents30.3 35.2 30.8 Median age for Two or more races residents28.2 31.3 41.9 Median age for White alone residents42.2 41.9 30.8 Median age for Hispanic or Latino residents34.5 28.7
Owner/renter occupied households by race in Marumsco
House owners and renters - White residents 3,622 66.0% Owner occupied1,862 34.0% Renter occupiedHouse owners and renters - Black or African American residents 1,243 37.0% Owner occupied2,114 63.0% Renter occupiedHouse owners and renters - American Indian / Alaska Native residents 31 57.6% Owner occupied23 42.4% Renter occupiedHouse owners and renters - Asian residents 542 63.4% Owner occupied312 36.6% Renter occupiedHouse owners and renters - Native Hawaiian / Pacific Islander residents 45 100.0% Owner occupiedHouse owners and renters - Other race residents 1,593 74.2% Owner occupied554 25.8% Renter occupiedHouse owners and renters - Two or more races residents 308 33.9% Owner occupied600 66.1% Renter occupiedHouse owners and renters - White alone residents 2,208 64.3% Owner occupied1,226 35.7% Renter occupiedHouse owners and renters - Hispanic or Latino residents 3,682 71.1% Owner occupied1,500 28.9% Renter occupied
Language usage in Marumsco
English speakers - Total 44.9% of residents of Marumsco speak English at home.
40.3% of residents speak Spanish at home 6,185 43.2% Speak English very well8,124 56.8% Speak English less than very well15.2% of residents speak other language at home 2,959 54.7% Speak English very well2,451 45.3% Speak English less than very well
English speakers - Born in the United States 91.6% of residents of Marumsco speak English at home.
5.4% of residents speak Spanish at home 454 91.3% Speak English very well43 8.7% Speak English less than very well3.1% of residents speak other language at home 269 96.1% Speak English very well11 3.9% Speak English less than very well
English speakers - Native, born elsewhere 68.6% of residents of Marumsco speak English at home.
28.2% of residents speak Spanish at home 106 47.1% Speak English very well119 52.9% Speak English less than very well2.4% of residents speak other language at home 19 100.0% Speak English very well
English speakers - Foreign-born 8.1% of residents of Marumsco speak English at home.
59.7% of residents speak Spanish at home 2,536 26.6% Speak English very well6,983 73.4% Speak English less than very well30.4% of residents speak other language at home 2,407 49.7% Speak English very well2,433 50.3% Speak English less than very well
White (Caucasian) - Speak only English Native:
72.7% (6,900)Foreign-born:
6.4% (327)
White (Caucasian) - Speak another language Native:
23.1% (2,188)Foreign-born:
89.9% (4,589)
Black or African American - Speak only English Native:
93.5% (5,741)Foreign-born:
25.4% (669)
Black or African American - Speak another language Native:
6.4% (395)Foreign-born:
74.7% (1,966)
Asian - Speak only English Native:
74.9% (462)Foreign-born:
9.9% (199)
Asian - Speak another language Native:
23.7% (146)Foreign-born:
90.1% (1,814)
Other race - Speak only English Native:
11.6% (282)Foreign-born:
2.6% (130)
Other race - Speak another language Native:
81.2% (1,979)Foreign-born:
97.1% (4,887)
Two or more races - Speak only English Native:
64.6% (1,332)Foreign-born:
3.2% (73)
Two or more races - Speak another language Native:
53.0% (1,094)Foreign-born:
99.1% (2,282)
White alone - Speak only English Native:
92.3% (5,895)Foreign-born:
14.7% (220)
White alone - Speak another language Native:
7.2% (460)Foreign-born:
84.5% (1,267)
Hispanic or Latino - Speak only English Native:
28.1% (1,888)Foreign-born:
3.0% (322)
Hispanic or Latino - Speak another language Native:
70.6% (4,733)Foreign-born:
96.6% (10,236)
Foreign-born residents in Marumsco
Marital status for residents in Marumsco Marital status - White (Caucasian) population 15 years and over
Males 34.7% Never married50.2% Now married3.8% Separated1.4% Widowed9.9% DivorcedFemales 28.5% Never married47.3% Now married2.0% Separated9.0% Widowed13.1% DivorcedWomen who gave birth in the past 12 months Now married:
76.6% (145)Unmarried:
23.4% (44)
Women who did not give birth in the past 12 months Now married:
47.9% (1,685)Unmarried:
52.1% (1,831)
Marital status - Black or African American population 15 years and over
Males 44.6% Never married42.9% Now married1.1% Separated0.2% Widowed11.3% DivorcedFemales 38.4% Never married32.8% Now married7.5% Separated4.7% Widowed16.7% DivorcedWomen who gave birth in the past 12 months Now married:
86.2% (128)Unmarried:
13.8% (20)
Women who did not give birth in the past 12 months Now married:
33.9% (831)Unmarried:
66.1% (1,623)
Marital status - American Indian / Alaska Native population 15 years and over
Males 53.2% Never married27.7% Now married0.0% Separated0.0% Widowed19.1% DivorcedFemales 70.9% Never married29.1% Now married0.0% Separated0.0% Widowed0.0% DivorcedWomen who did not give birth in the past 12 months Now married:
0.0% (0)Unmarried:
100.0% (32)
Marital status - Asian population 15 years and over
Males 26.7% Never married61.5% Now married1.6% Separated2.5% Widowed7.6% DivorcedFemales 21.2% Never married60.3% Now married0.0% Separated6.9% Widowed11.6% DivorcedWomen who gave birth in the past 12 months Now married:
100.0% (4)Unmarried:
0.0% (0)
Women who did not give birth in the past 12 months Now married:
55.4% (420)Unmarried:
44.6% (338)
Marital status - Other race population 15 years and over
Males 46.4% Never married44.9% Now married2.3% Separated1.6% Widowed4.9% DivorcedFemales 37.4% Never married46.8% Now married8.5% Separated1.9% Widowed5.3% DivorcedWomen who gave birth in the past 12 months Now married:
48.5% (33)Unmarried:
51.5% (35)
Women who did not give birth in the past 12 months Now married:
53.0% (1,183)Unmarried:
47.0% (1,051)
Marital status - Two or more races population 15 years and over
Males 51.4% Never married46.4% Now married0.0% Separated0.0% Widowed2.2% DivorcedFemales 43.4% Never married40.4% Now married10.6% Separated0.0% Widowed5.6% DivorcedWomen who gave birth in the past 12 months Now married:
35.3% (32)Unmarried:
64.7% (59)
Women who did not give birth in the past 12 months Now married:
34.6% (317)Unmarried:
65.4% (598)
Marital status - White alone, not Hispanic / Latino population 15 years and over
Males 31.8% Never married50.0% Now married3.4% Separated1.6% Widowed13.3% DivorcedFemales 22.2% Never married44.9% Now married2.0% Separated11.7% Widowed19.3% DivorcedWomen who gave birth in the past 12 months Now married:
100.0% (81)Unmarried:
0.0% (0)
Women who did not give birth in the past 12 months Now married:
49.8% (878)Unmarried:
50.2% (887)
Marital status - Hispanic or Latino population 15 years and over
Males 40.9% Never married47.7% Now married3.1% Separated1.3% Widowed7.0% DivorcedFemales 37.9% Never married48.1% Now married6.0% Separated3.3% Widowed4.8% DivorcedWomen who gave birth in the past 12 months Now married:
59.7% (135)Unmarried:
40.3% (91)
Women who did not give birth in the past 12 months Now married:
48.9% (2,391)Unmarried:
51.1% (2,494)
Ancestries in Marumsco
1,184 4.7% Ghanaian862 3.4% Iraqi747 3.0% Irish712 2.8% Afghan669 2.7% American469 1.9% Ethiopian450 1.8% Ugandan445 1.8% German400 1.6% Egyptian317 1.3% Liberian300 1.2% Italian295 1.2% African283 1.1% English260 1.0% Sierra Leonean170 0.7% Polish147 0.6% Iranian129 0.5% Bulgarian121 0.5% Moroccan106 0.4% Russian89 0.4% Ukrainian53 0.2% West Indian50 0.2% Scotch-Irish49 0.2% Lebanese38 0.2% European37 0.1% Scottish35 0.1% French27 0.1% Scandinavian25 0.10% Brazilian25 0.10% Norwegian24 0.10% Jamaican23 0.09% British18 0.07% Greek16 0.06% French Canadian11 0.04% Swedish10 0.04% Portuguese10 0.04% Slovak7 0.03% Croatian
Geographical mobility in Marumsco Same house 1 year ago 13,268 80.0% White (Caucasian)7,939 85.4% Black or African American94 89.5% American Indian / Alaska Native2,436 88.2% Asian52 99.8% Native Hawaiian / Pacific Islander9,666 89.4% Other race3,054 83.2% Two or more races6,861 81.4% White alone, not Hispanic / Latino15,358 84.6% Hispanic or LatinoMoved within same county 1,177 7.1% White / Caucasian345 3.7% Black or African American5 4.5% American Indian / Alaska Native50 1.8% Asian264 2.4% Other race321 8.7% Two or more races524 6.2% White alone, not Hispanic / Latino834 4.6% Hispanic or LatinoMoved within same state 1,289 7.8% White / Caucasian375 4.0% Black or African American140 5.1% Asian920 8.5% Other race12 0.3% Two or more races654 7.8% White alone, not Hispanic / Latino1,550 8.5% Hispanic or LatinoMoved from different state 487 2.9% White / Caucasian169 1.8% Black or African American105 3.8% Asian16 0.2% Other race257 7.0% Two or more races217 2.6% White alone, not Hispanic / Latino216 1.2% Hispanic or LatinoMoved from abroad 236 1.4% White284 3.0% Black or African American57 2.1% Asian246 2.3% Other race116 1.4% White alone, not Hispanic / Latino273 1.5% Hispanic or Latino
Children Nativity (place of birth) in Marumsco
Children under 6 years - Living with two parents Both parents native 508 100.0% NativeBoth parents foreign-born 1,145 87.3% Native166 12.7% Foreign-bornOne native, one foreign-born parent 271 100.0% NativeChildren under 6 years - Living with one parent Native parent 444 100.0% NativeForeign-born parent 658 97.2% Native19 2.8% Foreign-bornChildren 6 to 17 years - Living with two parents Both parents native 535 100.0% NativeBoth parents foreign-born 1,972 74.4% Native680 25.6% Foreign-bornOne native, one foreign-born parent 240 100.0% NativeChildren 6 to 17 years - Living with one parent Native parent 572 100.0% NativeForeign-born parent 1,479 57.5% Native1,093 42.5% Foreign-born
Place of birth for residents in Marumsco 10,223 Americas10,223 Latin America8,653 Central America3,042 Asia2,232 Africa1,687 South Central Asia1,396 South America1,275 Western Africa623 Western Asia622 South Eastern Asia544 Europe462 Eastern Africa391 Northern Africa342 Eastern Europe173 Caribbean108 Eastern Asia81 Western Europe70 Northern Europe68 Middle Africa49 Southern Europe34 China5,189 El Salvador1,399 Honduras908 Ghana724 Mexico704 Peru592 Nicaragua573 Guatemala561 Afghanistan510 Iraq469 Bolivia368 Pakistan322 Bangladesh319 Ethiopia273 Egypt273 Philippines247 Liberia200 India188 Nepal132 Uganda131 Bulgaria130 Panama119 Sierra Leone116 Vietnam109 Thailand107 Laos95 Ukraine94 Dominican Republic89 Colombia82 Morocco63 Korea60 Germany49 Venezuela47 Saudi Arabia46 Iran45 Russia43 Belize37 England36 Brazil34 China33 Cuba31 Italy29 Lebanon28 Jamaica23 Ecuador21 France21 Ireland20 Democratic Republic of Congo (Zaire)18 Yemen14 Singapore11 United Kingdom11 Japan10 Kenya9 Portugal9 Spain7 Trinidad and Tobago
Grandparents responsible for own grandchildren in Marumsco
Grandparents (30 to 59 years) White / Caucasian 37 13.2% Responsible for grandchildren243 86.8% Not responsible for grandchildrenBlack or African American 178 100.0% Responsible for grandchildrenAsian 2 4.2% Responsible for grandchildren44 95.8% Not responsible for grandchildrenOther race 100 36.1% Responsible for grandchildren176 63.9% Not responsible for grandchildrenTwo or more races 107 100.0% Responsible for grandchildrenWhite alone, not Hispanic / Latino 20 18.5% Responsible for grandchildren90 81.5% Not responsible for grandchildrenHispanic or Latino 122 27.5% Responsible for grandchildren321 72.5% Not responsible for grandchildrenGrandparents (60 years and over) White / Caucasian 6 1.7% Responsible for grandchildren370 98.3% Not responsible for grandchildrenBlack or African American 83 100.0% Not responsible for grandchildrenAsian 8 6.9% Responsible for grandchildren101 93.1% Not responsible for grandchildrenOther race 150 100.0% Not responsible for grandchildrenWhite alone, not Hispanic / Latino 6 2.9% Responsible for grandchildren212 97.1% Not responsible for grandchildrenHispanic or Latino 354 100.0% Not responsible for grandchildren