Races in Marshalltown, Iowa (IA) Detailed Stats
Data:
Races - White alone (%)
Races - White alone (% change since 2000)
Races - Black alone (%)
Races - Black alone (% change since 2000)
Races - American Indian alone (%)
Races - American Indian alone (% change since 2000)
Races - Asian alone (%)
Races - Asian alone (% change since 2000)
Races - Hispanic (%)
Races - Hispanic (% change since 2000)
Races - Native Hawaiian and Other Pacific Islander alone (%)
Races - Native Hawaiian and Other Pacific Islander alone (% change since 2000)
Races - Two or more races(%)
Races - Two or more races(% change since 2000)
Races - Other race alone (%)
Races - Other race alone (% change since 2000)
Racial diversity
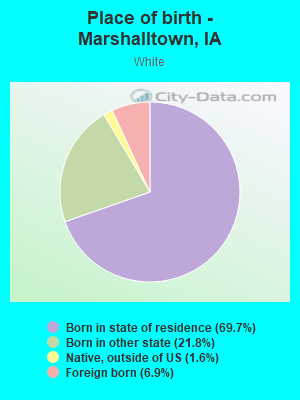
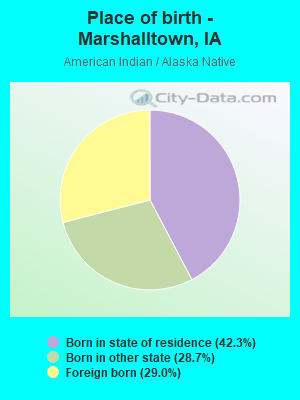
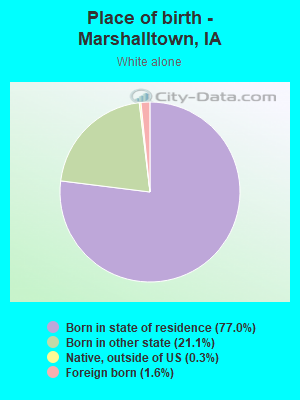
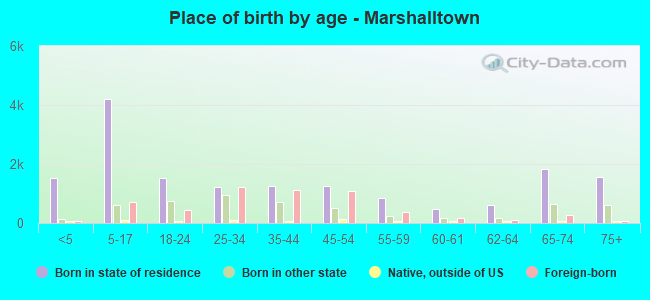
Place of birth - Born in state of residence (%)
Place of birth - Born in state of residence (%) - White
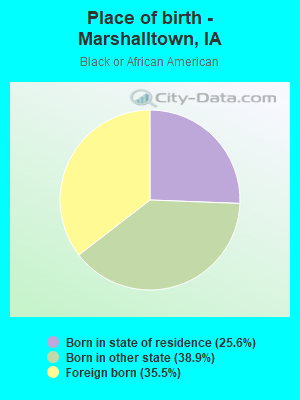
Place of birth - Born in state of residence (%) - Black or African American
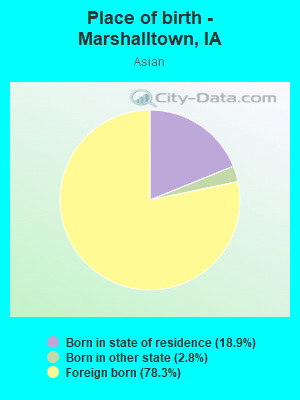
Place of birth - Born in state of residence (%) - Asian
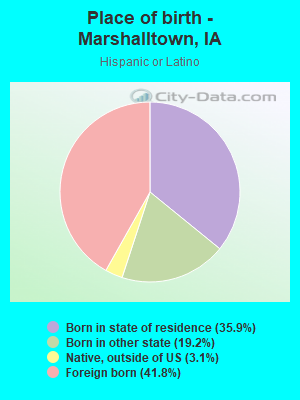
Place of birth - Born in state of residence (%) - Hispanic or Latino
Place of birth - Born in state of residence (%) - American Indian and Alaska Native
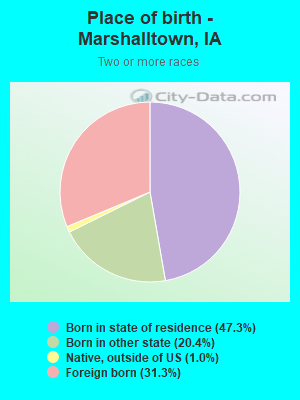
Place of birth - Born in state of residence (%) - Multirace
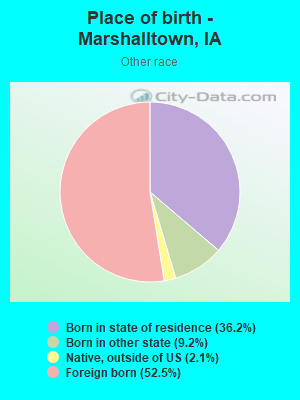
Place of birth - Born in state of residence (%) - Other Race
Place of birth - Born in other state (%)
Place of birth - Born in other state (%) - White
Place of birth - Born in other state (%) - Black or African American
Place of birth - Born in other state (%) - Asian
Place of birth - Born in other state (%) - Hispanic or Latino
Place of birth - Born in other state (%) - American Indian and Alaska Native
Place of birth - Born in other state (%) - Multirace
Place of birth - Born in other state (%) - Other Race
Place of birth - Native, outside of US (%)
Place of birth - Native, outside of US (%) - White
Place of birth - Native, outside of US (%) - Black or African American
Place of birth - Native, outside of US (%) - Asian
Place of birth - Native, outside of US (%) - Hispanic or Latino
Place of birth - Native, outside of US (%) - American Indian and Alaska Native
Place of birth - Native, outside of US (%) - Multirace
Place of birth - Native, outside of US (%) - Other Race
Place of birth - Foreign born (%)
Place of birth - Foreign born (%) - White
Place of birth - Foreign born (%) - Black or African American
Place of birth - Foreign born (%) - Asian
Place of birth - Foreign born (%) - Hispanic or Latino
Place of birth - Foreign born (%) - American Indian and Alaska Native
Place of birth - Foreign born (%) - Multirace
Place of birth - Foreign born (%) - Other Race
Residents speaking English at home (%)
Residents speaking English at home - Born in the United States (%)
Residents speaking English at home - Native, born elsewhere (%)
Residents speaking English at home - Foreign born (%)
Residents speaking Spanish at home (%)
Residents speaking Spanish at home - Born in the United States (%)
Residents speaking Spanish at home - Native, born elsewhere (%)
Residents speaking Spanish at home - Foreign born (%)
Residents speaking other language at home (%)
Residents speaking other language at home - Born in the United States (%)
Residents speaking other language at home - Native, born elsewhere (%)
Residents speaking other language at home - Foreign born (%)
Marital status - Never married (%)
Marital status - Now married (%)
Marital status - Separated (%)
Marital status - Widowed (%)
Marital status - Divorced (%)
Ancestries Reported - Arab (%)
Ancestries Reported - Czech (%)
Ancestries Reported - Danish (%)
Ancestries Reported - Dutch (%)
Ancestries Reported - English (%)
Ancestries Reported - French (%)
Ancestries Reported - French Canadian (%)
Ancestries Reported - German (%)
Ancestries Reported - Greek (%)
Ancestries Reported - Hungarian (%)
Ancestries Reported - Irish (%)
Ancestries Reported - Italian (%)
Ancestries Reported - Lithuanian (%)
Ancestries Reported - Norwegian (%)
Ancestries Reported - Polish (%)
Ancestries Reported - Portuguese (%)
Ancestries Reported - Russian (%)
Ancestries Reported - Scotch-Irish (%)
Ancestries Reported - Scottish (%)
Ancestries Reported - Slovak (%)
Ancestries Reported - Subsaharan African (%)
Ancestries Reported - Swedish (%)
Ancestries Reported - Swiss (%)
Ancestries Reported - Ukrainian (%)
Ancestries Reported - United States (%)
Ancestries Reported - Welsh (%)
Ancestries Reported - West Indian (%)
Ancestries Reported - Other (%)
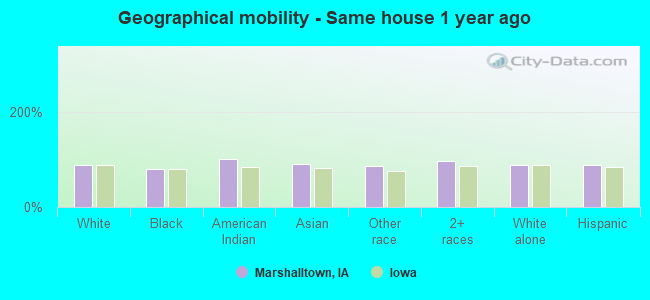
Geographical mobility - Same house 1 year ago (%)
Geographical mobility - Same house 1 year ago (%) - White
Geographical mobility - Same house 1 year ago (%) - Black or African American
Geographical mobility - Same house 1 year ago (%) - Asian
Geographical mobility - Same house 1 year ago (%) - Hispanic or Latino
Geographical mobility - Same house 1 year ago (%) - American Indian and Alaska Native
Geographical mobility - Same house 1 year ago (%) - Multirace
Geographical mobility - Same house 1 year ago (%) - Other Race
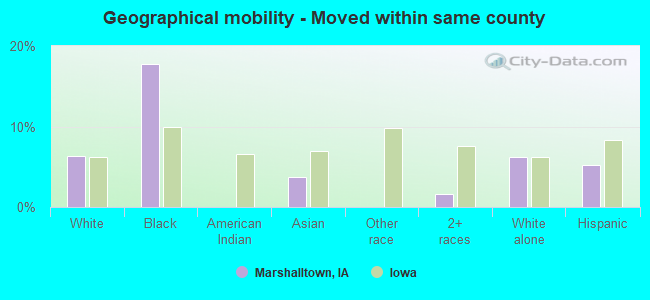
Geographical mobility - Moved within same county (%)
Geographical mobility - Moved within same county (%) - White
Geographical mobility - Moved within same county (%) - Black or African American
Geographical mobility - Moved within same county (%) - Asian
Geographical mobility - Moved within same county (%) - Hispanic or Latino
Geographical mobility - Moved within same county (%) - American Indian and Alaska Native
Geographical mobility - Moved within same county (%) - Multirace
Geographical mobility - Moved within same county (%) - Other Race
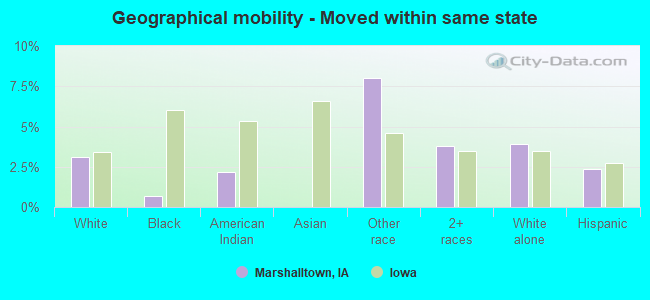
Geographical mobility - Moved from different county within same state (%)
Geographical mobility - Moved from different county within same state (%) - White
Geographical mobility - Moved from different county within same state (%) - Black or African American
Geographical mobility - Moved from different county within same state (%) - Asian
Geographical mobility - Moved from different county within same state (%) - Hispanic or Latino
Geographical mobility - Moved from different county within same state (%) - American Indian and Alaska Native
Geographical mobility - Moved from different county within same state (%) - Multirace
Geographical mobility - Moved from different county within same state (%) - Other Race
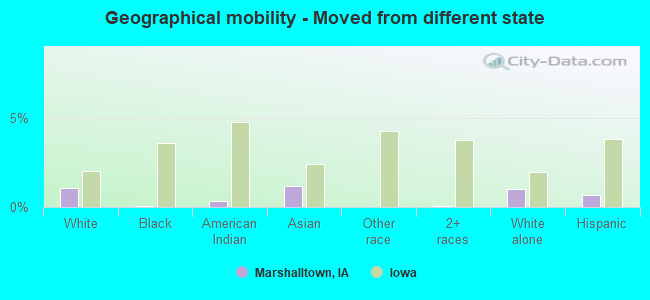
Geographical mobility - Moved from different state (%)
Geographical mobility - Moved from different state (%) - White
Geographical mobility - Moved from different state (%) - Black or African American
Geographical mobility - Moved from different state (%) - Asian
Geographical mobility - Moved from different state (%) - Hispanic or Latino
Geographical mobility - Moved from different state (%) - American Indian and Alaska Native
Geographical mobility - Moved from different state (%) - Multirace
Geographical mobility - Moved from different state (%) - Other Race
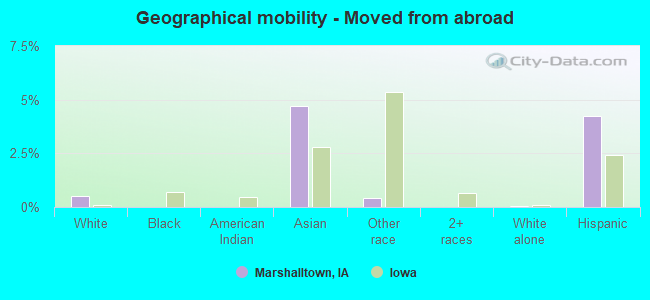
Geographical mobility - Moved from abroad (%)
Geographical mobility - Moved from abroad (%) - White
Geographical mobility - Moved from abroad (%) - Black or African American
Geographical mobility - Moved from abroad (%) - Asian
Geographical mobility - Moved from abroad (%) - Hispanic or Latino
Geographical mobility - Moved from abroad (%) - American Indian and Alaska Native
Geographical mobility - Moved from abroad (%) - Multirace
Geographical mobility - Moved from abroad (%) - Other Race
Place of birth for the foreign-born population - Ireland (%)
Place of birth for the foreign-born population - Denmark (%)
Place of birth for the foreign-born population - Norway (%)
Place of birth for the foreign-born population - Sweden (%)
Place of birth for the foreign-born population - United Kingdom (%)
Place of birth for the foreign-born population - England (%)
Place of birth for the foreign-born population - Scotland (%)
Place of birth for the foreign-born population - Other Northern Europe (%)
Place of birth for the foreign-born population - Austria (%)
Place of birth for the foreign-born population - Belgium (%)
Place of birth for the foreign-born population - France (%)
Place of birth for the foreign-born population - Germany (%)
Place of birth for the foreign-born population - Netherlands (%)
Place of birth for the foreign-born population - Switzerland (%)
Place of birth for the foreign-born population - Other Western Europe (%)
Place of birth for the foreign-born population - Greece (%)
Place of birth for the foreign-born population - Italy (%)
Place of birth for the foreign-born population - Portugal (%)
Place of birth for the foreign-born population - Spain (%)
Place of birth for the foreign-born population - Other Southern Europe (%)
Place of birth for the foreign-born population - Albania (%)
Place of birth for the foreign-born population - Belarus (%)
Place of birth for the foreign-born population - Bosnia and Herzegovina (%)
Place of birth for the foreign-born population - Bulgaria (%)
Place of birth for the foreign-born population - Croatia (%)
Place of birth for the foreign-born population - Czechoslovakia (%)
Place of birth for the foreign-born population - Hungary (%)
Place of birth for the foreign-born population - Latvia (%)
Place of birth for the foreign-born population - Lithuania (%)
Place of birth for the foreign-born population - North Macedonia (Macedonia) (%)
Place of birth for the foreign-born population - Moldova (%)
Place of birth for the foreign-born population - Poland (%)
Place of birth for the foreign-born population - Romania (%)
Place of birth for the foreign-born population - Russia (%)
Place of birth for the foreign-born population - Serbia (%)
Place of birth for the foreign-born population - Ukraine (%)
Place of birth for the foreign-born population - Other Eastern Europe (%)
Place of birth for the foreign-born population - China (%)
Place of birth for the foreign-born population - Hong Kong (%)
Place of birth for the foreign-born population - Taiwan (%)
Place of birth for the foreign-born population - Japan (%)
Place of birth for the foreign-born population - Korea (%)
Place of birth for the foreign-born population - Other Eastern Asia (%)
Place of birth for the foreign-born population - Afghanistan (%)
Place of birth for the foreign-born population - Bangladesh (%)
Place of birth for the foreign-born population - India (%)
Place of birth for the foreign-born population - Iran (%)
Place of birth for the foreign-born population - Kazakhstan (%)
Place of birth for the foreign-born population - Nepal (%)
Place of birth for the foreign-born population - Pakistan (%)
Place of birth for the foreign-born population - Sri Lanka (%)
Place of birth for the foreign-born population - Uzbekistan (%)
Place of birth for the foreign-born population - Other South Central Asia (%)
Place of birth for the foreign-born population - Burma (%)
Place of birth for the foreign-born population - Cambodia (%)
Place of birth for the foreign-born population - Indonesia (%)
Place of birth for the foreign-born population - Laos (%)
Place of birth for the foreign-born population - Malaysia (%)
Place of birth for the foreign-born population - Philippines (%)
Place of birth for the foreign-born population - Singapore (%)
Place of birth for the foreign-born population - Thailand (%)
Place of birth for the foreign-born population - Vietnam (%)
Place of birth for the foreign-born population - Other South Eastern Asia (%)
Place of birth for the foreign-born population - Armenia (%)
Place of birth for the foreign-born population - Iraq (%)
Place of birth for the foreign-born population - Israel (%)
Place of birth for the foreign-born population - Jordan (%)
Place of birth for the foreign-born population - Kuwait (%)
Place of birth for the foreign-born population - Lebanon (%)
Place of birth for the foreign-born population - Saudi Arabia (%)
Place of birth for the foreign-born population - Syria (%)
Place of birth for the foreign-born population - Turkey (%)
Place of birth for the foreign-born population - Yemen (%)
Place of birth for the foreign-born population - Other Western Asia (%)
Place of birth for the foreign-born population - Eritrea (%)
Place of birth for the foreign-born population - Ethiopia (%)
Place of birth for the foreign-born population - Kenya (%)
Place of birth for the foreign-born population - Somalia (%)
Place of birth for the foreign-born population - Uganda (%)
Place of birth for the foreign-born population - Zimbabwe (%)
Place of birth for the foreign-born population - Other Eastern Africa (%)
Place of birth for the foreign-born population - Cameroon (%)
Place of birth for the foreign-born population - Congo (%)
Place of birth for the foreign-born population - Democratic Republic of Congo (Zaire) (%)
Place of birth for the foreign-born population - Other Middle Africa (%)
Place of birth for the foreign-born population - Egypt (%)
Place of birth for the foreign-born population - Morocco (%)
Place of birth for the foreign-born population - Sudan (%)
Place of birth for the foreign-born population - Other Northern Africa (%)
Place of birth for the foreign-born population - South Africa (%)
Place of birth for the foreign-born population - Other Southern Africa (%)
Place of birth for the foreign-born population - Cabo Verde (%)
Place of birth for the foreign-born population - Ghana (%)
Place of birth for the foreign-born population - Liberia (%)
Place of birth for the foreign-born population - Nigeria (%)
Place of birth for the foreign-born population - Senegal (%)
Place of birth for the foreign-born population - Sierra Leone (%)
Place of birth for the foreign-born population - Other Western Africa (%)
Place of birth for the foreign-born population - Australia (%)
Place of birth for the foreign-born population - New Zealand (%)
Place of birth for the foreign-born population - Fiji (%)
Place of birth for the foreign-born population - Micronesia (%)
Place of birth for the foreign-born population - Bahamas (%)
Place of birth for the foreign-born population - Barbados (%)
Place of birth for the foreign-born population - Cuba (%)
Place of birth for the foreign-born population - Dominica (%)
Place of birth for the foreign-born population - Dominican Republic (%)
Place of birth for the foreign-born population - Grenada (%)
Place of birth for the foreign-born population - Haiti (%)
Place of birth for the foreign-born population - Jamaica (%)
Place of birth for the foreign-born population - St. Vincent and the Grenadines (%)
Place of birth for the foreign-born population - Trinidad and Tobago (%)
Place of birth for the foreign-born population - West Indies (%)
Place of birth for the foreign-born population - Other Caribbean (%)
Place of birth for the foreign-born population - Belize (%)
Place of birth for the foreign-born population - Costa Rica (%)
Place of birth for the foreign-born population - El Salvador (%)
Place of birth for the foreign-born population - Guatemala (%)
Place of birth for the foreign-born population - Honduras (%)
Place of birth for the foreign-born population - Mexico (%)
Place of birth for the foreign-born population - Nicaragua (%)
Place of birth for the foreign-born population - Panama (%)
Place of birth for the foreign-born population - Other Central America (%)
Place of birth for the foreign-born population - Argentina (%)
Place of birth for the foreign-born population - Bolivia (%)
Place of birth for the foreign-born population - Brazil (%)
Place of birth for the foreign-born population - Chile (%)
Place of birth for the foreign-born population - Colombia (%)
Place of birth for the foreign-born population - Ecuador (%)
Place of birth for the foreign-born population - Guyana (%)
Place of birth for the foreign-born population - Peru (%)
Place of birth for the foreign-born population - Uruguay (%)
Place of birth for the foreign-born population - Venezuela (%)
Place of birth for the foreign-born population - Other South America (%)
Place of birth for the foreign-born population - Canada (%)
Place of birth for the foreign-born population - Other Northern America (%)
Place of birth for the foreign-born population - Other (%)
Latest news about races in Marshalltown, IA collected exclusively by city-data.com from local newspapers, TV, and radio stations
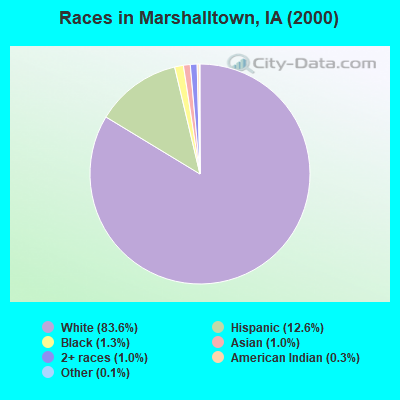
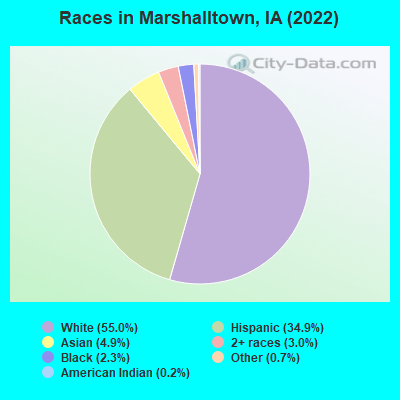
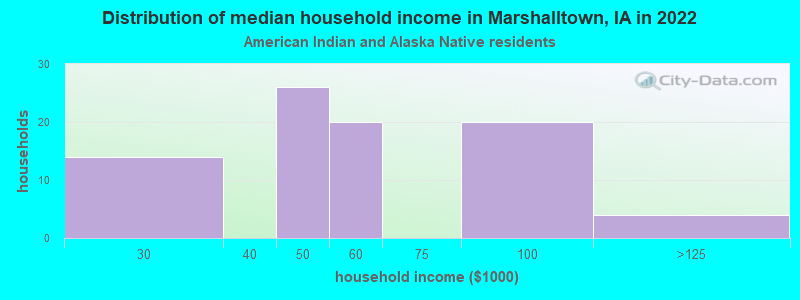
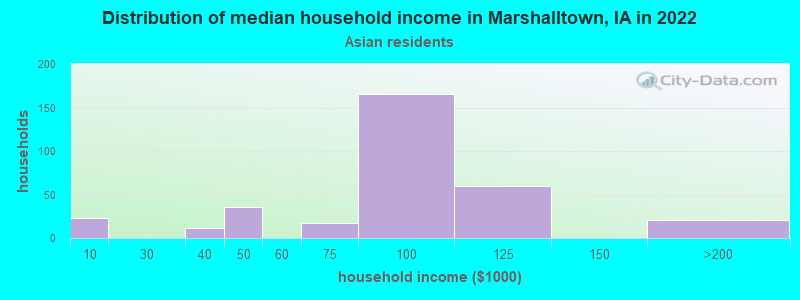
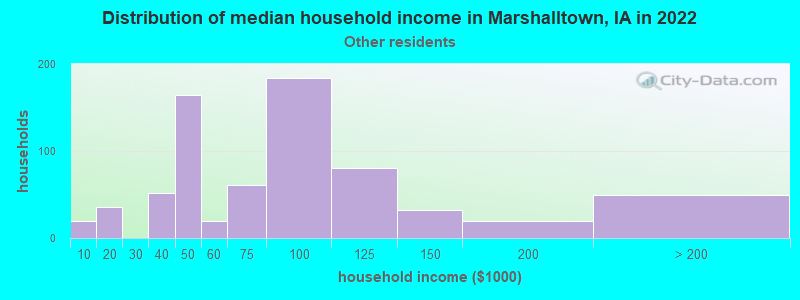
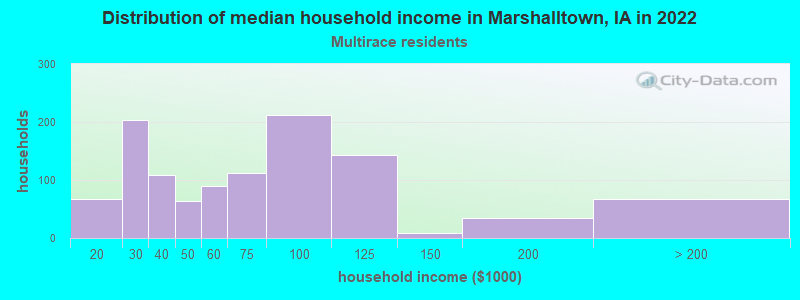
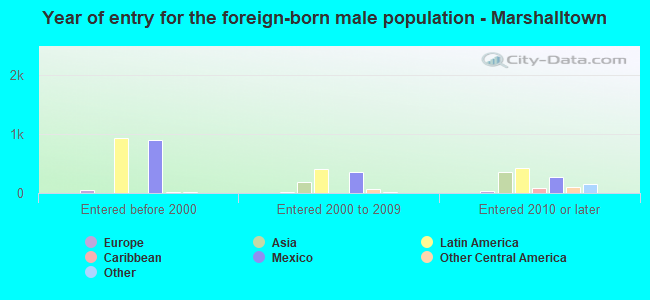
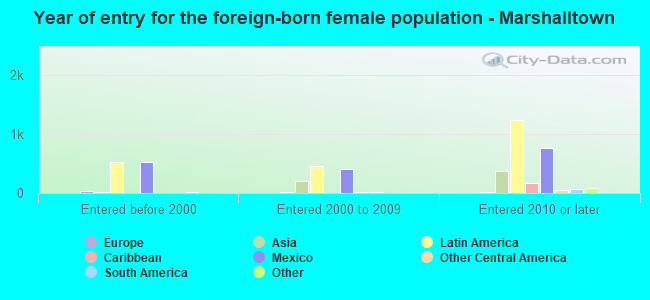
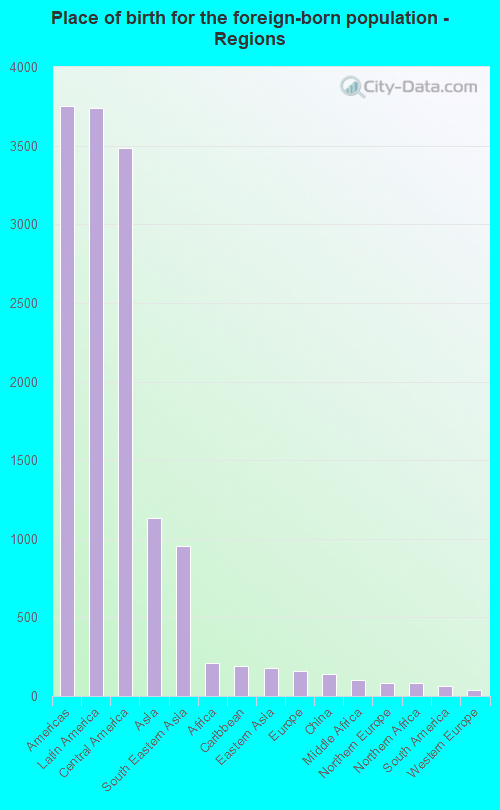
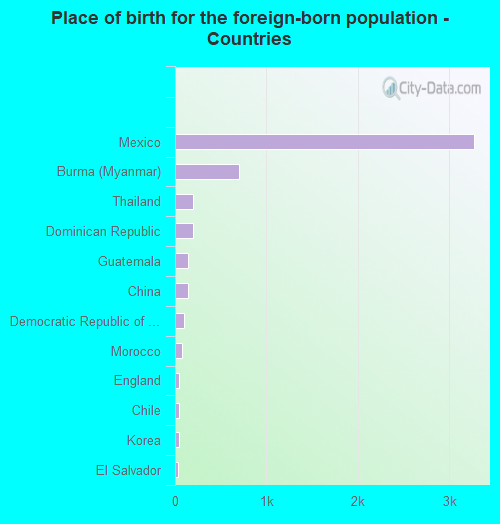
According to 2022 data, the most numerous races in Marshalltown, IA are White alone (15,193 residents), Hispanic (9,649 residents), and Black alone (643 residents). 66.5% of Marshalltown residents speak English at home. 19.0% of Marshalltown, IA residents are foreign-born (13.3% born in Latin America, 4.0% born in Asia), which is 73.7% greater than the foreign-born rate of 5.0% across the entire state of Iowa.
Race distribution in Marshalltown
2000 2022
2,710,344 92.6% White alone 82,473 2.8% Hispanic 60,744 2.1% Black alone 36,345 1.2% Asian alone 25,472 0.9% Two or more races 7,955 0.3% American Indian alone 2,103 0.07% Other race alone 888 0.03% Native Hawaiian and Other
2,650,110 82.8% White alone 218,024 6.8% Hispanic 119,004 3.7% Black alone 115,286 3.6% Two or more races 74,892 2.3% Asian alone 9,260 0.3% Other race alone 8,595 0.3% Native Hawaiian and Other 5,346 0.2% American Indian alone
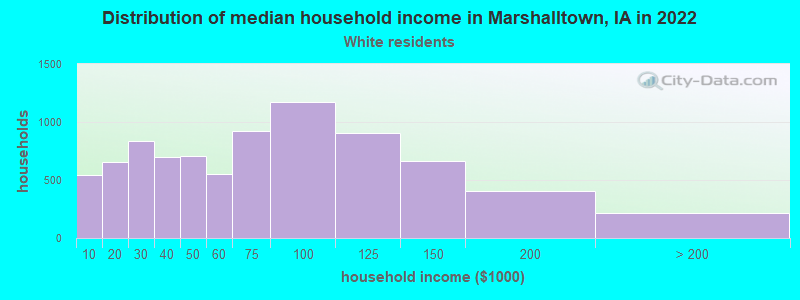
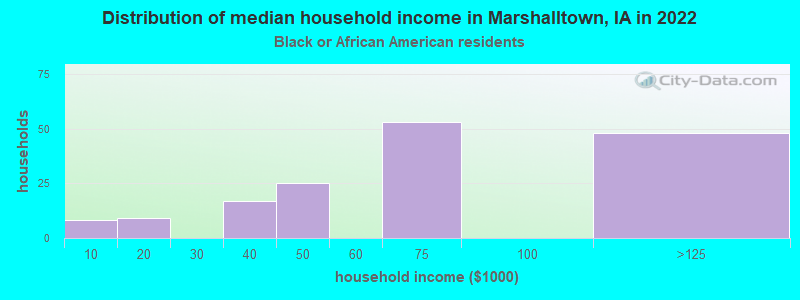
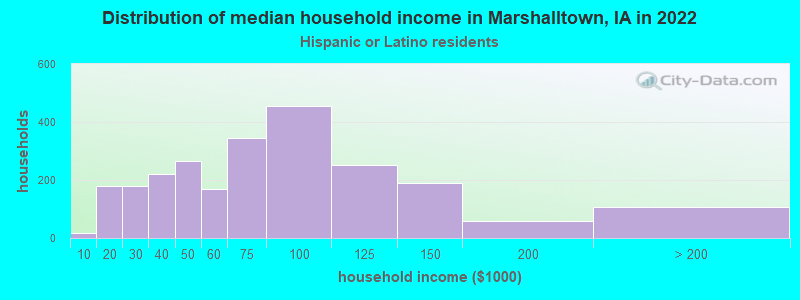
Income and house value in Marshalltown Median household income in 2022 $62,296 White non-Hispanic householders$66,982 Black householders$91,457 Asian householders$85,379 Some other race householders$66,370 Two or more races householders$70,463 Hispanic or Latino race householdersMedian 2022 house value $124,529 White Non-Hispanic householders$88,068 Black or African American householders $101,279 Asian householders$79,085 Some other race householders$56,187 Two or more races householders$79,790 Hispanic or Latino householders
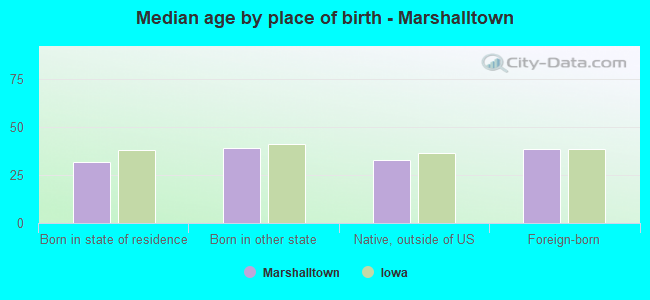
Median age by race in Marshalltown
42.5 Median age for White residents42.7 42.1 30.6 Median age for Black or African American residents31.0 20.9 15.7 Median age for American Indian / Alaska Native residents16.2 14.2 30.1 Median age for Asian residents24.3 34.5 -580,729,166.1 Median age for Native Hawaiian / Pacific Islander residents-776,978,416.5 -504,347,825.6 25.6 Median age for Other race residents25.6 26.2 24.8 Median age for Two or more races residents26.3 24.0 50.7 Median age for White alone residents50.4 51.2 24.7 Median age for Hispanic or Latino residents24.6 23.6
Owner/renter occupied households by race in Marshalltown
House owners and renters - White residents 5,647 68.6% Owner occupied2,580 31.4% Renter occupiedHouse owners and renters - Black or African American residents 31 17.2% Owner occupied150 82.8% Renter occupiedHouse owners and renters - American Indian / Alaska Native residents 19 26.5% Owner occupied54 73.5% Renter occupiedHouse owners and renters - Asian residents 244 63.3% Owner occupied141 36.7% Renter occupiedHouse owners and renters - Other race residents 575 83.7% Owner occupied112 16.3% Renter occupiedHouse owners and renters - Two or more races residents 865 74.2% Owner occupied300 25.8% Renter occupiedHouse owners and renters - White alone residents 4,756 67.2% Owner occupied2,324 32.8% Renter occupiedHouse owners and renters - Hispanic or Latino residents 1,998 78.1% Owner occupied560 21.9% Renter occupied
Language usage in Marshalltown
English speakers - Total 66.5% of residents of Marshalltown speak English at home.
28.6% of residents speak Spanish at home 3,385 45.8% Speak English very well4,007 54.2% Speak English less than very well6.1% of residents speak other language at home 373 23.7% Speak English very well1,198 76.3% Speak English less than very well
English speakers - Born in the United States 81.8% of residents of Marshalltown speak English at home.
18.2% of residents speak Spanish at home 733 74.8% Speak English very well247 25.2% Speak English less than very well0.1% of residents speak other language at home 5 100.0% Speak English very well
English speakers - Native, born elsewhere 32.6% of residents of Marshalltown speak English at home.
47.5% of residents speak Spanish at home 42 20.9% Speak English very well159 79.1% Speak English less than very well
English speakers - Foreign-born 5.0% of residents of Marshalltown speak English at home.
71.9% of residents speak Spanish at home 736 18.6% Speak English very well3,215 81.4% Speak English less than very well23.8% of residents speak other language at home 233 17.8% Speak English very well1,077 82.2% Speak English less than very well
White (Caucasian) - Speak only English Native:
90.0% (14,786)Foreign-born:
10.4% (135)
White (Caucasian) - Speak another language Native:
8.1% (1,334)Foreign-born:
85.2% (1,103)
Black or African American - Speak only English Native:
97.4% (512)Foreign-born:
2.4% (7)
Black or African American - Speak another language Native:
2.6% (14)Foreign-born:
100.0% (283)
American Indian / Alaska Native - Speak another language Native:
77.9% (153)Foreign-born:
93.5% (89)
Asian - Speak only English Native:
6.3% (13)Foreign-born:
7.3% (79)
Asian - Speak another language Native:
91.0% (193)Foreign-born:
91.3% (983)
Other race - Speak another language Native:
55.7% (692)Foreign-born:
100.0% (1,521)
Two or more races - Speak only English Native:
48.6% (1,306)Foreign-born:
4.9% (70)
Two or more races - Speak another language Native:
60.2% (1,619)Foreign-born:
93.7% (1,343)
White alone - Speak only English Native:
98.8% (14,112)Foreign-born:
35.0% (85)
White alone - Speak another language Native:
1.2% (172)Foreign-born:
65.0% (157)
Hispanic or Latino - Speak only English Native:
32.3% (1,583)Foreign-born:
1.5% (62)
Hispanic or Latino - Speak another language Native:
63.0% (3,089)Foreign-born:
99.5% (4,003)
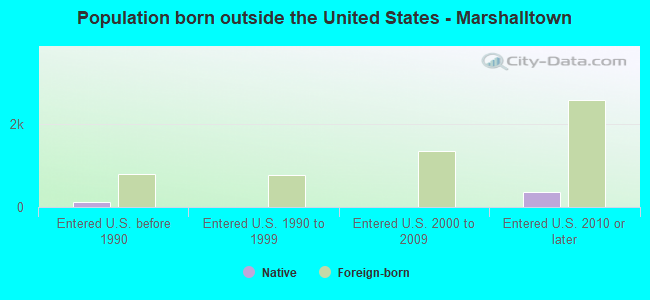
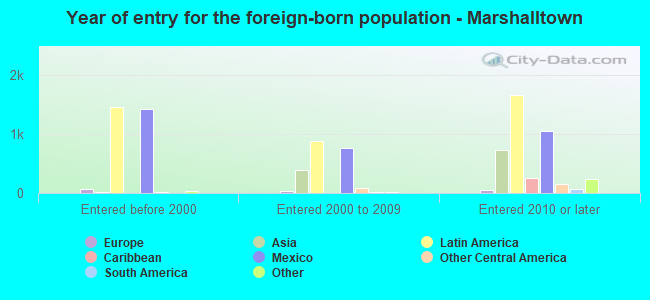
Foreign-born residents in Marshalltown 5,256 residents are foreign born (13.3% Latin America , 4.0% Asia ).
Marital status for residents in Marshalltown Marital status - White (Caucasian) population 15 years and over
Males 33.3% Never married48.2% Now married0.7% Separated5.3% Widowed12.5% DivorcedFemales 24.6% Never married50.9% Now married2.1% Separated10.6% Widowed11.8% DivorcedWomen who gave birth in the past 12 months Now married:
71.7% (225)Unmarried:
28.3% (89)
Women who did not give birth in the past 12 months Now married:
48.1% (1,731)Unmarried:
51.9% (1,869)
Marital status - Black or African American population 15 years and over
Males 76.5% Never married23.5% Now married0.0% Separated0.0% Widowed0.0% DivorcedFemales 52.5% Never married16.8% Now married0.0% Separated9.9% Widowed20.8% DivorcedWomen who gave birth in the past 12 months Now married:
0.0% (0)Unmarried:
100.0% (13)
Women who did not give birth in the past 12 months Now married:
31.8% (33)Unmarried:
68.2% (71)
Marital status - American Indian / Alaska Native population 15 years and over
Males 63.9% Never married20.2% Now married0.0% Separated5.9% Widowed10.1% DivorcedFemales 0.0% Never married64.9% Now married0.0% Separated0.0% Widowed35.1% DivorcedWomen who did not give birth in the past 12 months Now married:
100.0% (25)Unmarried:
0.0% (0)
Marital status - Asian population 15 years and over
Males 32.1% Never married66.1% Now married1.8% Separated0.0% Widowed0.0% DivorcedFemales 7.1% Never married78.2% Now married0.0% Separated11.1% Widowed3.6% DivorcedWomen who did not give birth in the past 12 months Now married:
77.0% (285)Unmarried:
23.0% (85)
Marital status - Other race population 15 years and over
Males 35.8% Never married59.2% Now married3.4% Separated0.0% Widowed1.6% DivorcedFemales 35.0% Never married59.6% Now married0.0% Separated2.2% Widowed3.3% DivorcedWomen who gave birth in the past 12 months Now married:
100.0% (75)Unmarried:
0.0% (0)
Women who did not give birth in the past 12 months Now married:
52.9% (431)Unmarried:
47.1% (383)
Marital status - Two or more races population 15 years and over
Males 38.6% Never married53.8% Now married0.0% Separated0.0% Widowed7.7% DivorcedFemales 47.6% Never married48.7% Now married1.2% Separated2.6% Widowed0.0% DivorcedWomen who gave birth in the past 12 months Now married:
100.0% (57)Unmarried:
0.0% (0)
Women who did not give birth in the past 12 months Now married:
47.4% (490)Unmarried:
52.6% (543)
Marital status - White alone, not Hispanic / Latino population 15 years and over
Males 31.7% Never married46.1% Now married0.8% Separated6.6% Widowed14.8% DivorcedFemales 22.6% Never married50.0% Now married1.0% Separated12.6% Widowed13.9% DivorcedWomen who gave birth in the past 12 months Now married:
82.7% (133)Unmarried:
17.3% (28)
Women who did not give birth in the past 12 months Now married:
43.7% (1,129)Unmarried:
56.3% (1,452)
Marital status - Hispanic or Latino population 15 years and over
Males 40.2% Never married55.1% Now married0.8% Separated0.0% Widowed3.9% DivorcedFemales 36.7% Never married55.8% Now married3.9% Separated1.3% Widowed2.3% DivorcedWomen who gave birth in the past 12 months Now married:
75.4% (212)Unmarried:
24.6% (69)
Women who did not give birth in the past 12 months Now married:
56.0% (1,422)Unmarried:
44.0% (1,117)
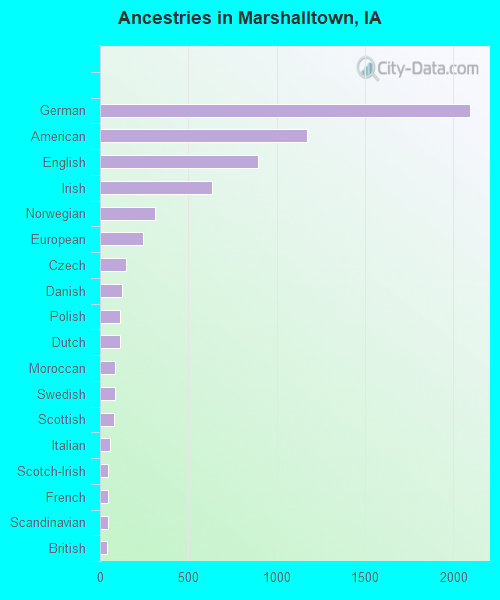
Ancestries in Marshalltown
2,099 13.0% German1,174 7.3% American894 5.6% English635 3.9% Irish309 1.9% Norwegian244 1.5% European147 0.9% Czech126 0.8% Danish115 0.7% Polish113 0.7% Dutch87 0.5% Moroccan83 0.5% Swedish81 0.5% Scottish55 0.3% Italian47 0.3% Scotch-Irish45 0.3% French44 0.3% Scandinavian42 0.3% British18 0.1% Northern European17 0.1% French Canadian15 0.09% Portuguese13 0.08% Pennsylvania German11 0.07% Sudanese7 0.04% Lebanese7 0.04% Czechoslovakian7 0.04% Nigerian6 0.04% Slovak6 0.04% Welsh5 0.03% Eastern European4 0.02% Greek1 0.01% Somali
Geographical mobility in Marshalltown Same house 1 year ago 16,733 88.5% White (Caucasian)635 79.8% Black or African American310 100.0% American Indian / Alaska Native1,244 90.2% Asian2,501 86.3% Other race4,207 95.6% Two or more races13,396 88.9% White alone, not Hispanic / Latino8,342 88.5% Hispanic or LatinoMoved within same county 1,209 6.4% White / Caucasian142 17.8% Black or African American52 3.8% Asian69 1.6% Two or more races934 6.2% White alone, not Hispanic / Latino486 5.2% Hispanic or LatinoMoved within same state 581 3.1% White / Caucasian6 0.7% Black or African American7 2.2% American Indian / Alaska Native232 8.0% Other race167 3.8% Two or more races593 3.9% White alone, not Hispanic / Latino225 2.4% Hispanic or LatinoMoved from different state 201 1.1% White / Caucasian1 0.1% Black or African American1 0.3% American Indian / Alaska Native16 1.2% Asian1 0.0% Two or more races154 1.0% White alone, not Hispanic / Latino63 0.7% Hispanic or LatinoMoved from abroad 100 0.5% White65 4.7% Asian12 0.4% Other race5 0.0% White alone, not Hispanic / Latino399 4.2% Hispanic or Latino
Children Nativity (place of birth) in Marshalltown
Children under 6 years - Living with two parents Both parents native 876 100.0% NativeBoth parents foreign-born 494 100.0% NativeOne native, one foreign-born parent 221 100.0% NativeChildren under 6 years - Living with one parent Native parent 563 100.0% NativeForeign-born parent 64 100.0% NativeChildren 6 to 17 years - Living with two parents Both parents native 1,641 100.0% NativeBoth parents foreign-born 1,137 65.1% Native609 34.9% Foreign-bornOne native, one foreign-born parent 383 91.5% Native35 8.5% Foreign-bornChildren 6 to 17 years - Living with one parent Native parent 841 99.4% Native5 0.6% Foreign-bornForeign-born parent 104 66.6% Native52 33.4% Foreign-born
Grandparents responsible for own grandchildren in Marshalltown
Grandparents (30 to 59 years) White / Caucasian 75 50.2% Responsible for grandchildren75 49.8% Not responsible for grandchildrenAsian 17 100.0% Not responsible for grandchildrenOther race 14 100.0% Not responsible for grandchildrenTwo or more races 141 100.0% Not responsible for grandchildrenWhite alone, not Hispanic / Latino 23 100.0% Responsible for grandchildrenHispanic or Latino 60 34.1% Responsible for grandchildren115 65.9% Not responsible for grandchildrenGrandparents (60 years and over) White / Caucasian 145 64.9% Responsible for grandchildren78 35.1% Not responsible for grandchildrenAsian 8 100.0% Not responsible for grandchildrenWhite alone, not Hispanic / Latino 81 66.2% Responsible for grandchildren41 33.8% Not responsible for grandchildrenHispanic or Latino 34 35.4% Responsible for grandchildren62 64.6% Not responsible for grandchildren