Races in Marshall, Minnesota (MN) Detailed Stats
Data:
Races - White alone (%)
Races - White alone (% change since 2000)
Races - Black alone (%)
Races - Black alone (% change since 2000)
Races - American Indian alone (%)
Races - American Indian alone (% change since 2000)
Races - Asian alone (%)
Races - Asian alone (% change since 2000)
Races - Hispanic (%)
Races - Hispanic (% change since 2000)
Races - Native Hawaiian and Other Pacific Islander alone (%)
Races - Native Hawaiian and Other Pacific Islander alone (% change since 2000)
Races - Two or more races(%)
Races - Two or more races(% change since 2000)
Races - Other race alone (%)
Races - Other race alone (% change since 2000)
Racial diversity
Place of birth - Born in state of residence (%)
Place of birth - Born in state of residence (%) - White
Place of birth - Born in state of residence (%) - Black or African American
Place of birth - Born in state of residence (%) - Asian
Place of birth - Born in state of residence (%) - Hispanic or Latino
Place of birth - Born in state of residence (%) - American Indian and Alaska Native
Place of birth - Born in state of residence (%) - Multirace
Place of birth - Born in state of residence (%) - Other Race
Place of birth - Born in other state (%)
Place of birth - Born in other state (%) - White
Place of birth - Born in other state (%) - Black or African American
Place of birth - Born in other state (%) - Asian
Place of birth - Born in other state (%) - Hispanic or Latino
Place of birth - Born in other state (%) - American Indian and Alaska Native
Place of birth - Born in other state (%) - Multirace
Place of birth - Born in other state (%) - Other Race
Place of birth - Native, outside of US (%)
Place of birth - Native, outside of US (%) - White
Place of birth - Native, outside of US (%) - Black or African American
Place of birth - Native, outside of US (%) - Asian
Place of birth - Native, outside of US (%) - Hispanic or Latino
Place of birth - Native, outside of US (%) - American Indian and Alaska Native
Place of birth - Native, outside of US (%) - Multirace
Place of birth - Native, outside of US (%) - Other Race
Place of birth - Foreign born (%)
Place of birth - Foreign born (%) - White
Place of birth - Foreign born (%) - Black or African American
Place of birth - Foreign born (%) - Asian
Place of birth - Foreign born (%) - Hispanic or Latino
Place of birth - Foreign born (%) - American Indian and Alaska Native
Place of birth - Foreign born (%) - Multirace
Place of birth - Foreign born (%) - Other Race
Residents speaking English at home (%)
Residents speaking English at home - Born in the United States (%)
Residents speaking English at home - Native, born elsewhere (%)
Residents speaking English at home - Foreign born (%)
Residents speaking Spanish at home (%)
Residents speaking Spanish at home - Born in the United States (%)
Residents speaking Spanish at home - Native, born elsewhere (%)
Residents speaking Spanish at home - Foreign born (%)
Residents speaking other language at home (%)
Residents speaking other language at home - Born in the United States (%)
Residents speaking other language at home - Native, born elsewhere (%)
Residents speaking other language at home - Foreign born (%)
Marital status - Never married (%)
Marital status - Now married (%)
Marital status - Separated (%)
Marital status - Widowed (%)
Marital status - Divorced (%)
Ancestries Reported - Arab (%)
Ancestries Reported - Czech (%)
Ancestries Reported - Danish (%)
Ancestries Reported - Dutch (%)
Ancestries Reported - English (%)
Ancestries Reported - French (%)
Ancestries Reported - French Canadian (%)
Ancestries Reported - German (%)
Ancestries Reported - Greek (%)
Ancestries Reported - Hungarian (%)
Ancestries Reported - Irish (%)
Ancestries Reported - Italian (%)
Ancestries Reported - Lithuanian (%)
Ancestries Reported - Norwegian (%)
Ancestries Reported - Polish (%)
Ancestries Reported - Portuguese (%)
Ancestries Reported - Russian (%)
Ancestries Reported - Scotch-Irish (%)
Ancestries Reported - Scottish (%)
Ancestries Reported - Slovak (%)
Ancestries Reported - Subsaharan African (%)
Ancestries Reported - Swedish (%)
Ancestries Reported - Swiss (%)
Ancestries Reported - Ukrainian (%)
Ancestries Reported - United States (%)
Ancestries Reported - Welsh (%)
Ancestries Reported - West Indian (%)
Ancestries Reported - Other (%)
Geographical mobility - Same house 1 year ago (%)
Geographical mobility - Same house 1 year ago (%) - White
Geographical mobility - Same house 1 year ago (%) - Black or African American
Geographical mobility - Same house 1 year ago (%) - Asian
Geographical mobility - Same house 1 year ago (%) - Hispanic or Latino
Geographical mobility - Same house 1 year ago (%) - American Indian and Alaska Native
Geographical mobility - Same house 1 year ago (%) - Multirace
Geographical mobility - Same house 1 year ago (%) - Other Race
Geographical mobility - Moved within same county (%)
Geographical mobility - Moved within same county (%) - White
Geographical mobility - Moved within same county (%) - Black or African American
Geographical mobility - Moved within same county (%) - Asian
Geographical mobility - Moved within same county (%) - Hispanic or Latino
Geographical mobility - Moved within same county (%) - American Indian and Alaska Native
Geographical mobility - Moved within same county (%) - Multirace
Geographical mobility - Moved within same county (%) - Other Race
Geographical mobility - Moved from different county within same state (%)
Geographical mobility - Moved from different county within same state (%) - White
Geographical mobility - Moved from different county within same state (%) - Black or African American
Geographical mobility - Moved from different county within same state (%) - Asian
Geographical mobility - Moved from different county within same state (%) - Hispanic or Latino
Geographical mobility - Moved from different county within same state (%) - American Indian and Alaska Native
Geographical mobility - Moved from different county within same state (%) - Multirace
Geographical mobility - Moved from different county within same state (%) - Other Race
Geographical mobility - Moved from different state (%)
Geographical mobility - Moved from different state (%) - White
Geographical mobility - Moved from different state (%) - Black or African American
Geographical mobility - Moved from different state (%) - Asian
Geographical mobility - Moved from different state (%) - Hispanic or Latino
Geographical mobility - Moved from different state (%) - American Indian and Alaska Native
Geographical mobility - Moved from different state (%) - Multirace
Geographical mobility - Moved from different state (%) - Other Race
Geographical mobility - Moved from abroad (%)
Geographical mobility - Moved from abroad (%) - White
Geographical mobility - Moved from abroad (%) - Black or African American
Geographical mobility - Moved from abroad (%) - Asian
Geographical mobility - Moved from abroad (%) - Hispanic or Latino
Geographical mobility - Moved from abroad (%) - American Indian and Alaska Native
Geographical mobility - Moved from abroad (%) - Multirace
Geographical mobility - Moved from abroad (%) - Other Race
Place of birth for the foreign-born population - Ireland (%)
Place of birth for the foreign-born population - Denmark (%)
Place of birth for the foreign-born population - Norway (%)
Place of birth for the foreign-born population - Sweden (%)
Place of birth for the foreign-born population - United Kingdom (%)
Place of birth for the foreign-born population - England (%)
Place of birth for the foreign-born population - Scotland (%)
Place of birth for the foreign-born population - Other Northern Europe (%)
Place of birth for the foreign-born population - Austria (%)
Place of birth for the foreign-born population - Belgium (%)
Place of birth for the foreign-born population - France (%)
Place of birth for the foreign-born population - Germany (%)
Place of birth for the foreign-born population - Netherlands (%)
Place of birth for the foreign-born population - Switzerland (%)
Place of birth for the foreign-born population - Other Western Europe (%)
Place of birth for the foreign-born population - Greece (%)
Place of birth for the foreign-born population - Italy (%)
Place of birth for the foreign-born population - Portugal (%)
Place of birth for the foreign-born population - Spain (%)
Place of birth for the foreign-born population - Other Southern Europe (%)
Place of birth for the foreign-born population - Albania (%)
Place of birth for the foreign-born population - Belarus (%)
Place of birth for the foreign-born population - Bosnia and Herzegovina (%)
Place of birth for the foreign-born population - Bulgaria (%)
Place of birth for the foreign-born population - Croatia (%)
Place of birth for the foreign-born population - Czechoslovakia (%)
Place of birth for the foreign-born population - Hungary (%)
Place of birth for the foreign-born population - Latvia (%)
Place of birth for the foreign-born population - Lithuania (%)
Place of birth for the foreign-born population - North Macedonia (Macedonia) (%)
Place of birth for the foreign-born population - Moldova (%)
Place of birth for the foreign-born population - Poland (%)
Place of birth for the foreign-born population - Romania (%)
Place of birth for the foreign-born population - Russia (%)
Place of birth for the foreign-born population - Serbia (%)
Place of birth for the foreign-born population - Ukraine (%)
Place of birth for the foreign-born population - Other Eastern Europe (%)
Place of birth for the foreign-born population - China (%)
Place of birth for the foreign-born population - Hong Kong (%)
Place of birth for the foreign-born population - Taiwan (%)
Place of birth for the foreign-born population - Japan (%)
Place of birth for the foreign-born population - Korea (%)
Place of birth for the foreign-born population - Other Eastern Asia (%)
Place of birth for the foreign-born population - Afghanistan (%)
Place of birth for the foreign-born population - Bangladesh (%)
Place of birth for the foreign-born population - India (%)
Place of birth for the foreign-born population - Iran (%)
Place of birth for the foreign-born population - Kazakhstan (%)
Place of birth for the foreign-born population - Nepal (%)
Place of birth for the foreign-born population - Pakistan (%)
Place of birth for the foreign-born population - Sri Lanka (%)
Place of birth for the foreign-born population - Uzbekistan (%)
Place of birth for the foreign-born population - Other South Central Asia (%)
Place of birth for the foreign-born population - Burma (%)
Place of birth for the foreign-born population - Cambodia (%)
Place of birth for the foreign-born population - Indonesia (%)
Place of birth for the foreign-born population - Laos (%)
Place of birth for the foreign-born population - Malaysia (%)
Place of birth for the foreign-born population - Philippines (%)
Place of birth for the foreign-born population - Singapore (%)
Place of birth for the foreign-born population - Thailand (%)
Place of birth for the foreign-born population - Vietnam (%)
Place of birth for the foreign-born population - Other South Eastern Asia (%)
Place of birth for the foreign-born population - Armenia (%)
Place of birth for the foreign-born population - Iraq (%)
Place of birth for the foreign-born population - Israel (%)
Place of birth for the foreign-born population - Jordan (%)
Place of birth for the foreign-born population - Kuwait (%)
Place of birth for the foreign-born population - Lebanon (%)
Place of birth for the foreign-born population - Saudi Arabia (%)
Place of birth for the foreign-born population - Syria (%)
Place of birth for the foreign-born population - Turkey (%)
Place of birth for the foreign-born population - Yemen (%)
Place of birth for the foreign-born population - Other Western Asia (%)
Place of birth for the foreign-born population - Eritrea (%)
Place of birth for the foreign-born population - Ethiopia (%)
Place of birth for the foreign-born population - Kenya (%)
Place of birth for the foreign-born population - Somalia (%)
Place of birth for the foreign-born population - Uganda (%)
Place of birth for the foreign-born population - Zimbabwe (%)
Place of birth for the foreign-born population - Other Eastern Africa (%)
Place of birth for the foreign-born population - Cameroon (%)
Place of birth for the foreign-born population - Congo (%)
Place of birth for the foreign-born population - Democratic Republic of Congo (Zaire) (%)
Place of birth for the foreign-born population - Other Middle Africa (%)
Place of birth for the foreign-born population - Egypt (%)
Place of birth for the foreign-born population - Morocco (%)
Place of birth for the foreign-born population - Sudan (%)
Place of birth for the foreign-born population - Other Northern Africa (%)
Place of birth for the foreign-born population - South Africa (%)
Place of birth for the foreign-born population - Other Southern Africa (%)
Place of birth for the foreign-born population - Cabo Verde (%)
Place of birth for the foreign-born population - Ghana (%)
Place of birth for the foreign-born population - Liberia (%)
Place of birth for the foreign-born population - Nigeria (%)
Place of birth for the foreign-born population - Senegal (%)
Place of birth for the foreign-born population - Sierra Leone (%)
Place of birth for the foreign-born population - Other Western Africa (%)
Place of birth for the foreign-born population - Australia (%)
Place of birth for the foreign-born population - New Zealand (%)
Place of birth for the foreign-born population - Fiji (%)
Place of birth for the foreign-born population - Micronesia (%)
Place of birth for the foreign-born population - Bahamas (%)
Place of birth for the foreign-born population - Barbados (%)
Place of birth for the foreign-born population - Cuba (%)
Place of birth for the foreign-born population - Dominica (%)
Place of birth for the foreign-born population - Dominican Republic (%)
Place of birth for the foreign-born population - Grenada (%)
Place of birth for the foreign-born population - Haiti (%)
Place of birth for the foreign-born population - Jamaica (%)
Place of birth for the foreign-born population - St. Vincent and the Grenadines (%)
Place of birth for the foreign-born population - Trinidad and Tobago (%)
Place of birth for the foreign-born population - West Indies (%)
Place of birth for the foreign-born population - Other Caribbean (%)
Place of birth for the foreign-born population - Belize (%)
Place of birth for the foreign-born population - Costa Rica (%)
Place of birth for the foreign-born population - El Salvador (%)
Place of birth for the foreign-born population - Guatemala (%)
Place of birth for the foreign-born population - Honduras (%)
Place of birth for the foreign-born population - Mexico (%)
Place of birth for the foreign-born population - Nicaragua (%)
Place of birth for the foreign-born population - Panama (%)
Place of birth for the foreign-born population - Other Central America (%)
Place of birth for the foreign-born population - Argentina (%)
Place of birth for the foreign-born population - Bolivia (%)
Place of birth for the foreign-born population - Brazil (%)
Place of birth for the foreign-born population - Chile (%)
Place of birth for the foreign-born population - Colombia (%)
Place of birth for the foreign-born population - Ecuador (%)
Place of birth for the foreign-born population - Guyana (%)
Place of birth for the foreign-born population - Peru (%)
Place of birth for the foreign-born population - Uruguay (%)
Place of birth for the foreign-born population - Venezuela (%)
Place of birth for the foreign-born population - Other South America (%)
Place of birth for the foreign-born population - Canada (%)
Place of birth for the foreign-born population - Other Northern America (%)
Place of birth for the foreign-born population - Other (%)
Latest news about races in Marshall, MN collected exclusively by city-data.com from local newspapers, TV, and radio stations
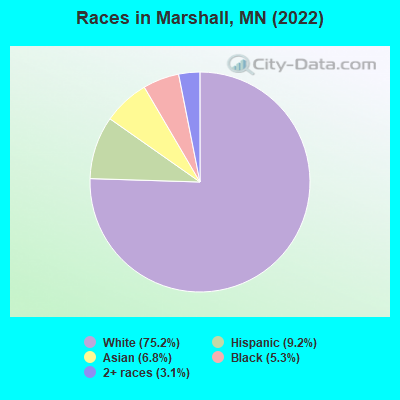
According to 2022 data, the most numerous races in Marshall, MN are White alone (10,295 residents), Black alone (731 residents), and Hispanic (1,254 residents). 84.6% of Marshall residents speak English at home. 11.3% of Marshall, MN residents are foreign-born (4.2% born in Asia, 3.6% born in Latin America, 2.5% born in Africa), which is 29.3% greater than the foreign-born rate of 8.0% across the entire state of Minnesota.
Race distribution in Marshall
2000 2022
4,337,143 88.2% White alone 168,813 3.4% Black alone 143,382 2.9% Hispanic 141,083 2.9% Asian alone 70,304 1.4% Two or more races 52,009 1.1% American Indian alone 5,031 0.1% Other race alone 1,714 0.03% Native Hawaiian and Other
4,356,347 76.2% White alone 395,179 6.9% Black alone 333,830 5.8% Hispanic 294,800 5.2% Asian alone 259,649 4.5% Two or more races 42,125 0.7% American Indian alone 32,976 0.6% Other race alone 2,278 0.04% Native Hawaiian and Other
Income and house value in Marshall Median household income in 2022 $64,371 White non-Hispanic householders$36,919 Black householders$50,048 Asian householders$45,631 Some other race householders$41,967 Hispanic or Latino race householdersMedian 2022 house value $207,672 White Non-Hispanic householders$290,295 Black or African American householders $165,021 Asian householders$178,643 Some other race householders$212,138 Two or more races householders$171,944 Hispanic or Latino householders
Median age by race in Marshall
40.7 Median age for White residents38.0 43.8 21.3 Median age for Black or African American residents24.1 18.1 -673,400,672.7 Median age for American Indian / Alaska Native residents-666,666,666.0 -677,852,348.3 25.0 Median age for Asian residents25.4 24.8 -744,336,568.8 Median age for Native Hawaiian / Pacific Islander residents-856,799,036.4 -534,959,349.1 24.1 Median age for Other race residents34.6 16.6 15.5 Median age for Two or more races residents12.4 18.5 41.0 Median age for White alone residents38.9 43.4 22.1 Median age for Hispanic or Latino residents30.0 17.3
Owner/renter occupied households by race in Marshall
House owners and renters - White residents 2,893 63.2% Owner occupied1,684 36.8% Renter occupiedHouse owners and renters - Black or African American residents 81 40.5% Owner occupied119 59.5% Renter occupiedHouse owners and renters - American Indian / Alaska Native residents 5 100.0% Renter occupiedHouse owners and renters - Asian residents 83 30.2% Owner occupied192 69.8% Renter occupiedHouse owners and renters - Other race residents 88 25.5% Owner occupied257 74.5% Renter occupiedHouse owners and renters - Two or more races residents 55 61.2% Owner occupied35 38.8% Renter occupiedHouse owners and renters - White alone residents 2,904 64.2% Owner occupied1,616 35.8% Renter occupiedHouse owners and renters - Hispanic or Latino residents 74 18.4% Owner occupied329 81.6% Renter occupied
Language usage in Marshall
English speakers - Total 84.6% of residents of Marshall speak English at home.
6.5% of residents speak Spanish at home 214 25.8% Speak English very well615 74.2% Speak English less than very well9.2% of residents speak other language at home 614 52.7% Speak English very well552 47.3% Speak English less than very well
English speakers - Born in the United States 91.2% of residents of Marshall speak English at home.
3.4% of residents speak Spanish at home 87 86.1% Speak English very well14 13.9% Speak English less than very well5.9% of residents speak other language at home 85 49.1% Speak English very well88 50.9% Speak English less than very well
English speakers - Native, born elsewhere 86.3% of residents of Marshall speak English at home.
10.5% of residents speak other language at home 16 100.0% Speak English very well
English speakers - Foreign-born 9.0% of residents of Marshall speak English at home.
31.7% of residents speak Spanish at home 14 2.9% Speak English very well466 97.1% Speak English less than very well60.4% of residents speak other language at home 491 53.7% Speak English very well423 46.3% Speak English less than very well
White (Caucasian) - Speak only English Native:
98.9% (9,628)Foreign-born:
48.3% (55)
White (Caucasian) - Speak another language Native:
1.3% (126)Foreign-born:
54.2% (62)
Black or African American - Speak another language Native:
7.4% (20)Foreign-born:
100.0% (375)
Asian - Speak only English Native:
19.8% (55)Foreign-born:
10.3% (55)
Asian - Speak another language Native:
77.2% (213)Foreign-born:
90.0% (480)
Other race - Speak another language Native:
53.3% (201)Foreign-born:
97.5% (509)
Two or more races - Speak only English Native:
92.8% (470)Foreign-born:
86.9% (24)
White alone - Speak only English Native:
99.6% (9,567)Foreign-born:
53.0% (58)
White alone - Speak another language Native:
0.5% (49)Foreign-born:
47.9% (52)
Hispanic or Latino - Speak another language Native:
49.7% (298)Foreign-born:
96.9% (456)
Foreign-born residents in Marshall 1,551 residents are foreign born (4.2% Asia , 3.6% Latin America , 2.5% Africa ).
This city:
11.3%Minnesota:
8.5%
Marital status for residents in Marshall Marital status - White (Caucasian) population 15 years and over
Males 34.3% Never married51.5% Now married0.2% Separated3.9% Widowed10.1% DivorcedFemales 29.1% Never married48.1% Now married0.9% Separated11.1% Widowed10.8% DivorcedWomen who gave birth in the past 12 months Now married:
92.2% (103)Unmarried:
7.8% (9)
Women who did not give birth in the past 12 months Now married:
44.7% (930)Unmarried:
55.3% (1,151)
Marital status - Black or African American population 15 years and over
Males 63.1% Never married36.3% Now married0.0% Separated0.0% Widowed0.6% DivorcedFemales 50.5% Never married49.5% Now married0.0% Separated0.0% Widowed0.0% DivorcedWomen who gave birth in the past 12 months Now married:
100.0% (8)Unmarried:
0.0% (0)
Women who did not give birth in the past 12 months Now married:
21.4% (26)Unmarried:
78.6% (95)
Marital status - American Indian / Alaska Native population 15 years and over
Males 100.0% Never married0.0% Now married0.0% Separated0.0% Widowed0.0% DivorcedFemales 100.0% Never married0.0% Now married0.0% Separated0.0% Widowed0.0% DivorcedWomen who did not give birth in the past 12 months Now married:
0.0% (0)Unmarried:
100.0% (4)
Marital status - Asian population 15 years and over
Males 57.0% Never married26.1% Now married0.0% Separated1.7% Widowed15.1% DivorcedFemales 38.3% Never married39.3% Now married0.0% Separated12.3% Widowed10.1% DivorcedWomen who gave birth in the past 12 months Now married:
100.0% (15)Unmarried:
0.0% (0)
Women who did not give birth in the past 12 months Now married:
26.2% (55)Unmarried:
73.8% (153)
Marital status - Other race population 15 years and over
Males 51.7% Never married48.3% Now married0.0% Separated0.0% Widowed0.0% DivorcedFemales 66.4% Never married26.2% Now married0.0% Separated7.4% Widowed0.0% DivorcedWomen who did not give birth in the past 12 months Now married:
31.8% (120)Unmarried:
68.2% (258)
Marital status - Two or more races population 15 years and over
Males 40.0% Never married60.0% Now married0.0% Separated0.0% Widowed0.0% DivorcedFemales 91.4% Never married3.9% Now married0.0% Separated0.0% Widowed4.6% DivorcedWomen who did not give birth in the past 12 months Now married:
0.0% (0)Unmarried:
100.0% (181)
Marital status - White alone, not Hispanic / Latino population 15 years and over
Males 32.9% Never married52.9% Now married0.2% Separated4.1% Widowed10.0% DivorcedFemales 29.4% Never married48.1% Now married1.0% Separated10.8% Widowed10.8% DivorcedWomen who gave birth in the past 12 months Now married:
92.2% (105)Unmarried:
7.8% (9)
Women who did not give birth in the past 12 months Now married:
44.1% (923)Unmarried:
55.9% (1,168)
Marital status - Hispanic or Latino population 15 years and over
Males 61.2% Never married33.5% Now married0.0% Separated0.0% Widowed5.3% DivorcedFemales 60.9% Never married26.8% Now married0.0% Separated11.1% Widowed1.2% DivorcedWomen who did not give birth in the past 12 months Now married:
33.8% (122)Unmarried:
66.2% (238)
Ancestries in Marshall
1,984 30.3% German325 5.0% Belgian306 4.7% French275 4.2% Norwegian193 2.9% American177 2.7% Irish118 1.8% Somali110 1.7% Scandinavian108 1.6% English98 1.5% Swedish95 1.4% Polish84 1.3% Dutch57 0.9% African55 0.8% Italian48 0.7% European40 0.6% Danish37 0.6% French Canadian26 0.4% Eastern European18 0.3% Scottish17 0.3% Nigerian12 0.2% Jamaican9 0.1% Kenyan6 0.09% Icelander3 0.05% Haitian2 0.03% Ethiopian1 0.02% Lithuanian
Children Nativity (place of birth) in Marshall
Children under 6 years - Living with two parents Both parents native 521 100.0% NativeBoth parents foreign-born 74 100.0% NativeOne native, one foreign-born parent 197 100.0% NativeChildren under 6 years - Living with one parent Native parent 83 57.6% Native61 42.4% Foreign-bornForeign-born parent 128 100.0% NativeChildren 6 to 17 years - Living with two parents Both parents native 1,127 100.0% NativeBoth parents foreign-born 122 42.3% Native167 57.7% Foreign-bornOne native, one foreign-born parent 55 100.0% NativeChildren 6 to 17 years - Living with one parent Native parent 408 78.6% Native111 21.4% Foreign-bornForeign-born parent 207 71.2% Native84 28.8% Foreign-born
Grandparents responsible for own grandchildren in Marshall
Grandparents (30 to 59 years) Asian 36 56.7% Responsible for grandchildren27 43.3% Not responsible for grandchildren
Grandparents (60 years and over) Asian 4 100.0% Not responsible for grandchildren