Races in Marion, Iowa (IA) Detailed Stats
Ancestries, Foreign-born residents, place of birth
Settings
X


Recent posts about races in Marion, Iowa on our local forum with over 2,400,000 registered users:
 | Moving to Iowa City, working in Marion (18 replies) |
| Cedar Rapids neighborhoods (9 replies) |
| Looking at Cedar Rapids for a move (17 replies) |
| Tax Assessor Time in Marion (1 reply) |
| Moving To Cedar Rapids, IA From NC (24 replies) |
| Mount Vernon, Marion, or North Liberty (30 replies) |
Latest news about races in Marion, IA collected exclusively by city-data.com from local newspapers, TV, and radio stations
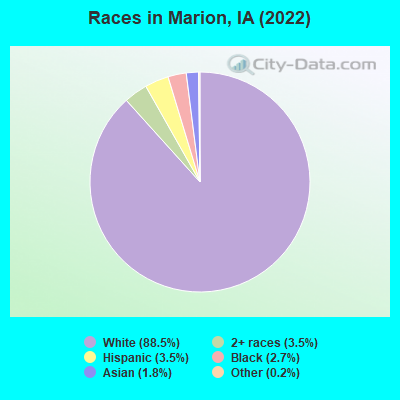
According to 2022 data, the most numerous races in Marion, IA are White alone (36,582 residents), Hispanic (1,456 residents), and Black alone (1,105 residents). 95.9% of Marion residents speak English at home. 3.0% of Marion, IA residents are foreign-born (1.5% born in Asia, 0.8% born in Latin America, 0.3% born in Africa), which is 65.4% less than the foreign-born rate of 5.0% across the entire state of Iowa.
Race distribution in Marion
2000
2022

- 25,35796.4%White alone
- 2891.1%Hispanic
- 2460.9%Asian alone
- 1780.7%Two or more races
- 1540.6%Black alone
- 440.2%American Indian alone
- 180.07%Other race alone
- 80.03%Native Hawaiian and Other
Pacific Islander alone

-
- 36,58288.5%White alone
- 1,4563.5%Hispanic
- 1,4673.5%Two or more races
- 1,1052.7%Black alone
- 7411.8%Asian alone
- 690.2%Other race alone
2000
2022
-
- 2,710,34492.6%White alone
- 82,4732.8%Hispanic
- 60,7442.1%Black alone
- 36,3451.2%Asian alone
- 25,4720.9%Two or more races
- 7,9550.3%American Indian alone
- 2,1030.07%Other race alone
- 8880.03%Native Hawaiian and Other
Pacific Islander alone

-
- 2,650,11082.8%White alone
- 218,0246.8%Hispanic
- 119,0043.7%Black alone
- 115,2863.6%Two or more races
- 74,8922.3%Asian alone
- 9,2600.3%Other race alone
- 8,5950.3%Native Hawaiian and Other
Pacific Islander alone - 5,3460.2%American Indian alone

Income and house value in Marion
- Median household income in 2022
- $77,440White non-Hispanic householders
- $84,222Black householders
- over $200,000Asian householders
- $104,176Two or more races householders
- $82,748Hispanic or Latino race householders
- Median 2022 house value
- $232,919White Non-Hispanic householders
- $176,179Black or African American householders
- $156,309American Indian or Alaska Native householders
- $308,203Asian householders
- $187,659Some other race householders
- $52,544Two or more races householders
- $179,932Hispanic or Latino householders
Household income for White non-Hispanic householders

Household income for Black householders

Household income for Asian householders

Household income for Some other race householders

Household income for Two or more races householders

Household income for Hispanic or Latino race householders

Median age by race in Marion
- 41.2Median age for White residents
- 39.8Males
- 42.6Females
- 32.8Median age for Black or African American residents
- 37.0Males
- 28.9Females
- 19.0Median age for American Indian / Alaska Native residents
- -1,230,769,229.5Males
- -1,290,640,392.8Females
- 37.2Median age for Asian residents
- 34.2Males
- 34.5Females
- -580,729,166.1Median age for Native Hawaiian / Pacific Islander residents
- -776,978,416.5Males
- -504,347,825.6Females
- 48.4Median age for Other race residents
- -534,653,464.8Males
- 93.6Females
- 23.7Median age for Two or more races residents
- 21.3Males
- 27.2Females
- 41.4Median age for White alone residents
- 40.2Males
- 42.8Females
- 21.2Median age for Hispanic or Latino residents
- 23.0Males
- 26.6Females
Owner/renter occupied households by race in Marion
- House owners and renters - White residents
- 12,48880.8%Owner occupied
- 2,96819.2%Renter occupied
- House owners and renters - Black or African American residents
- 10925.7%Owner occupied
- 31574.3%Renter occupied
- House owners and renters - Asian residents
- 25783.1%Owner occupied
- 5216.9%Renter occupied
- House owners and renters - Other race residents
- 151100.0%Owner occupied
- House owners and renters - Two or more races residents
- 38372.4%Owner occupied
- 14627.6%Renter occupied
- House owners and renters - White alone residents
- 12,45980.9%Owner occupied
- 2,95019.1%Renter occupied
- House owners and renters - Hispanic or Latino residents
- 25664.0%Owner occupied
- 14436.0%Renter occupied
Language usage in Marion
- English speakers - Total
- 95.9% of residents of Marion speak English at home.
- 2.1% of residents speak Spanish at home
- 63577.8%Speak English very well
- 18122.2%Speak English less than very well
- 2.1% of residents speak other language at home
- 59875.0%Speak English very well
- 19925.0%Speak English less than very well
- English speakers - Born in the United States
- 95.0% of residents of Marion speak English at home.
- 2.2% of residents speak Spanish at home
- 187100.0%Speak English very well
- 2.5% of residents speak other language at home
- 211100.0%Speak English very well
- English speakers - Native, born elsewhere
- 80.3% of residents of Marion speak English at home.
- 14.3% of residents speak Spanish at home
- 29100.0%Speak English less than very well
- 7.9% of residents speak other language at home
- 16100.0%Speak English very well
- English speakers - Foreign-born
- 35.3% of residents of Marion speak English at home.
- 33.1% of residents speak Spanish at home
- 27869.5%Speak English very well
- 12230.5%Speak English less than very well
- 40.9% of residents speak other language at home
- 29860.3%Speak English very well
- 19639.7%Speak English less than very well
White (Caucasian) - Speak only English
| Native: | 99.2% (33,840) |
| Foreign-born: | 26.6% (116) |
White (Caucasian) - Speak another language
| Native: | 0.8% (266) |
| Foreign-born: | 72.2% (316) |
Black or African American - Speak only English
| Native: | 99.6% (934) |
| Foreign-born: | 100.0% (128) |
Asian - Speak only English
| Native: | 42.3% (93) |
| Foreign-born: | 12.2% (69) |
Asian - Speak another language
| Native: | 57.2% (126) |
| Foreign-born: | 86.1% (487) |
Two or more races - Speak only English
| Native: | 78.2% (1,405) |
| Foreign-born: | 38.0% (30) |
Two or more races - Speak another language
| Native: | 28.0% (504) |
| Foreign-born: | 65.8% (52) |
White alone - Speak only English
| Native: | 99.0% (33,560) |
| Foreign-born: | 44.8% (119) |
White alone - Speak another language
| Native: | 0.7% (227) |
| Foreign-born: | 52.3% (139) |
Hispanic or Latino - Speak only English
| Native: | 65.6% (682) |
| Foreign-born: | 14.2% (53) |
Hispanic or Latino - Speak another language
| Native: | 34.2% (356) |
| Foreign-born: | 85.7% (324) |
Foreign-born residents in Marion
1,250 residents are foreign born (1.5% Asia, 0.8% Latin America, 0.3% Africa).
| This city: | 3.0% |
| Iowa: | 5.6% |


Marital status for residents in Marion
Marital status - White (Caucasian) population 15 years and over
- Males
- 26.0%Never married
- 61.3%Now married
- 0.6%Separated
- 2.2%Widowed
- 9.9%Divorced
- Females
- 20.6%Never married
- 53.5%Now married
- 1.3%Separated
- 11.1%Widowed
- 13.4%Divorced
Women who gave birth in the past 12 months
| Now married: | 63.6% (266) |
| Unmarried: | 36.4% (152) |
Women who did not give birth in the past 12 months
| Now married: | 55.1% (4,312) |
| Unmarried: | 44.9% (3,512) |
Marital status - Black or African American population 15 years and over
- Males
- 43.5%Never married
- 49.1%Now married
- 0.9%Separated
- 0.0%Widowed
- 6.5%Divorced
- Females
- 43.0%Never married
- 37.7%Now married
- 7.7%Separated
- 0.0%Widowed
- 11.6%Divorced
Women who did not give birth in the past 12 months
| Now married: | 40.8% (114) |
| Unmarried: | 59.2% (166) |
Marital status - American Indian / Alaska Native population 15 years and over
- Males
- 0.0%Never married
- 100.0%Now married
- 0.0%Separated
- 0.0%Widowed
- 0.0%Divorced
- Females
- 100.0%Never married
- 0.0%Now married
- 0.0%Separated
- 0.0%Widowed
- 0.0%Divorced
Women who did not give birth in the past 12 months
| Now married: | 0.0% (0) |
| Unmarried: | 100.0% (38) |
Marital status - Asian population 15 years and over
- Males
- 50.3%Never married
- 36.1%Now married
- 0.0%Separated
- 6.6%Widowed
- 7.0%Divorced
- Females
- 16.3%Never married
- 79.8%Now married
- 0.0%Separated
- 3.9%Widowed
- 0.0%Divorced
Women who did not give birth in the past 12 months
| Now married: | 82.6% (189) |
| Unmarried: | 17.4% (40) |
Marital status - Other race population 15 years and over
- Males
- 0.0%Never married
- 100.0%Now married
- 0.0%Separated
- 0.0%Widowed
- 0.0%Divorced
- Females
- 93.9%Never married
- 6.1%Now married
- 0.0%Separated
- 0.0%Widowed
- 0.0%Divorced
Women who did not give birth in the past 12 months
| Now married: | 0.0% (0) |
| Unmarried: | 100.0% (63) |
Marital status - Two or more races population 15 years and over
- Males
- 47.8%Never married
- 36.9%Now married
- 0.0%Separated
- 0.0%Widowed
- 15.3%Divorced
- Females
- 40.5%Never married
- 29.1%Now married
- 4.3%Separated
- 0.0%Widowed
- 26.1%Divorced
Women who did not give birth in the past 12 months
| Now married: | 29.6% (190) |
| Unmarried: | 70.4% (451) |
Marital status - White alone, not Hispanic / Latino population 15 years and over
- Males
- 25.6%Never married
- 61.7%Now married
- 0.6%Separated
- 2.2%Widowed
- 9.8%Divorced
- Females
- 20.4%Never married
- 53.5%Now married
- 1.3%Separated
- 11.2%Widowed
- 13.5%Divorced
Women who gave birth in the past 12 months
| Now married: | 63.6% (269) |
| Unmarried: | 36.4% (154) |
Women who did not give birth in the past 12 months
| Now married: | 55.1% (4,291) |
| Unmarried: | 44.9% (3,502) |
Marital status - Hispanic or Latino population 15 years and over
- Males
- 27.8%Never married
- 61.5%Now married
- 0.0%Separated
- 0.0%Widowed
- 10.6%Divorced
- Females
- 54.7%Never married
- 21.1%Now married
- 0.0%Separated
- 0.0%Widowed
- 24.2%Divorced
Women who did not give birth in the past 12 months
| Now married: | 29.1% (104) |
| Unmarried: | 70.9% (255) |
Ancestries in Marion

- 4,99431.6%German
- 1,4939.5%American
- 1,4659.3%Irish
- 1,3928.8%English
- 6133.9%Norwegian
- 5593.5%European
- 5303.4%Czech
- 4072.6%Scandinavian
- 1921.2%Jamaican
- 1831.2%Swedish
- 1701.1%Italian
- 1300.8%Danish
- 1060.7%Dutch
- 920.6%Scotch-Irish
- 840.5%British
- 630.4%Scottish
- 570.4%Eastern European
- 380.2%Polish
- 370.2%Lebanese
- 230.1%Sierra Leonean
- 200.1%Swiss
- 190.1%Jordanian
- 150.10%Ukrainian
- 130.08%French Canadian
- 110.07%Czechoslovakian
- 80.05%Finnish
- 60.04%Northern European

Geographical mobility in Marion

- Same house 1 year ago
- 33,17190.5%White (Caucasian)
- 1,06095.5%Black or African American
- 176100.0%American Indian / Alaska Native
- 60890.2%Asian
- 23100.0%Native Hawaiian / Pacific Islander
- 13450.0%Other race
- 1,72575.1%Two or more races
- 32,70490.0%White alone, not Hispanic / Latino
- 1,09376.3%Hispanic or Latino

-
- Moved within same county
- 1,9515.3%White / Caucasian
- 100.9%Black or African American
- 233.4%Asian
- 2028.8%Two or more races
- 2,0495.6%White alone, not Hispanic / Latino
- 382.7%Hispanic or Latino

-
- Moved within same state
- 1,1113.0%White / Caucasian
- 504.5%Black or African American
- 588.7%Asian
- 13851.5%Other race
- 1787.8%Two or more races
- 1,1043.0%White alone, not Hispanic / Latino
- 21815.2%Hispanic or Latino

-
- Moved from different state
- 4951.3%White / Caucasian
- 411.8%Two or more races
- 5191.4%White alone, not Hispanic / Latino
- 181.3%Hispanic or Latino

Children Nativity (place of birth) in Marion
Place of birth for residents in Marion
![Place of birth for the foreign-born population - Regions]()
- 636Asia
- 395Americas
- 344South Central Asia
- 342Latin America
- 243Central America
- 132Africa
- 115Eastern Asia
- 89China
- 89Western Asia
- 86South Eastern Asia
- 85Europe
- 84Caribbean
- 61Northern Africa
- 53Northern America
- 52Northern Europe
- 32Southern Europe
- 29Western Africa
- 14South America
- 1Eastern Europe

![Place of birth for the foreign-born population - Countries]()
- 209India
- 174Mexico
- 125Pakistan
- 89China
- 84Jamaica
- 61Burma (Myanmar)
- 53Canada
- 47Honduras
- 39Lebanon
- 35United Kingdom
- 32Italy
- 27Saudi Arabia
- 25Korea
- 25Philippines
- 22Israel
- 21Guatemala
- 20Sierra Leone
- 16England
- 14Venezuela
- 10Bhutan
- 1Russia

Grandparents responsible for own grandchildren in Marion
Zip codes: 52302.