Races in Maplewood, New Jersey (NJ) Detailed Stats
Ancestries, Foreign-born residents, place of birth

Recent posts about races in Maplewood, New Jersey on our local forum with over 2,400,000 registered users:
 | Maplewood right next to Irvington - is this house worth it?? (23 replies) |
| Help deciding between Maplewood & Connecticut (13 replies) |
| Montclair vs. Maplewood vs. Summit? (17 replies) |
| Thinking of leaving ridgewood for maplewood... (83 replies) |
| What's up with property taxes in Maplewood? (2 replies) |
| best cities,towns to buy a house (13 replies) |
Latest news about races in Maplewood, NJ collected exclusively by city-data.com from local newspapers, TV, and radio stations
17.8% of Maplewood, NJ residents are foreign-born (10.2% born in Latin America, 3.8% born in Europe, 2.2% born in Asia), which is 29.0% less than the foreign-born rate of 23.0% across the entire state of New Jersey.
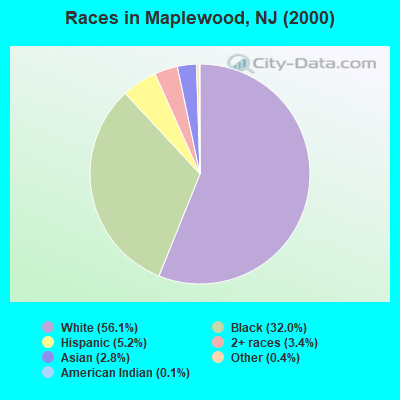
Race distribution in Maplewood

- 13,38256.1%White alone
- 7,64432.0%Black alone
- 1,2485.2%Hispanic
- 8063.4%Two or more races
- 6602.8%Asian alone
- 970.4%Other race alone
- 250.1%American Indian alone
- 60.03%Native Hawaiian and Other
Pacific Islander alone
2000
2022
-
- 5,557,20966.0%White alone
- 1,117,19113.3%Hispanic
- 1,096,17113.0%Black alone
- 477,0125.7%Asian alone
- 133,6891.6%Two or more races
- 19,5650.2%Other race alone
- 11,3380.1%American Indian alone
- 2,1750.03%Native Hawaiian and Other
Pacific Islander alone

-
- 4,766,47651.5%White alone
- 2,028,47021.9%Hispanic
- 1,111,63212.0%Black alone
- 923,54610.0%Asian alone
- 332,2373.6%Two or more races
- 89,8471.0%Other race alone
- 8,5570.09%American Indian alone
- 9340.01%Native Hawaiian and Other
Pacific Islander alone

Income and house value in Maplewood
- Median household income in 2022
- $158,769White non-Hispanic householders
- $108,479Black householders
- $49,335American Indian and Alaska Native householders
- over $200,000Asian householders
- $113,743Some other race householders
- $142,634Two or more races householders
- $131,207Hispanic or Latino race householders
- Median 2022 house value
- $675,584White Non-Hispanic householders
- $409,389Black or African American householders
- $170,469American Indian or Alaska Native householders
- $554,682Asian householders
- $445,581Some other race householders
- $446,106Two or more races householders
- $509,311Hispanic or Latino householders
Household income for White non-Hispanic householders

Household income for Black householders

Household income for American Indian and Alaska Native householders

Household income for Asian householders

Household income for Two or more races householders

Household income for Hispanic or Latino race householders

Foreign-born residents in Maplewood
4,254 residents are foreign born (10.2% Latin America, 3.8% Europe, 2.2% Asia).
| This city: | 17.8% |
| New Jersey: | 17.5% |
Ancestries in Maplewood

- 8,52732.1%Other
- 2,82810.7%Irish
- 2,4239.1%West Indian
- 2,3929.0%Italian
- 2,2678.5%German
- 1,4345.4%English
- 1,4235.4%Polish
- 1,1944.5%Russian
- 7122.7%United States
- 6112.3%Subsaharan African
- 3211.2%Scottish
- 2781.0%Ukrainian
- 2661.0%French
- 2290.9%Scotch-Irish
- 2270.9%Hungarian
- 2170.8%Norwegian
- 2140.8%Dutch
- 1540.6%Greek
- 1420.5%Lithuanian
- 1310.5%Welsh
- 1280.5%Czech
- 1060.4%French Canadian
- 920.3%Slovak
- 910.3%Swedish
- 520.2%Portuguese
- 440.2%Danish
- 390.1%Swiss
- 50.02%Arab

Zip codes: 07040.