Races in Maple Grove, Minnesota (MN) Detailed Stats
Data:
Races - White alone (%)
Races - White alone (% change since 2000)
Races - Black alone (%)
Races - Black alone (% change since 2000)
Races - American Indian alone (%)
Races - American Indian alone (% change since 2000)
Races - Asian alone (%)
Races - Asian alone (% change since 2000)
Races - Hispanic (%)
Races - Hispanic (% change since 2000)
Races - Native Hawaiian and Other Pacific Islander alone (%)
Races - Native Hawaiian and Other Pacific Islander alone (% change since 2000)
Races - Two or more races(%)
Races - Two or more races(% change since 2000)
Races - Other race alone (%)
Races - Other race alone (% change since 2000)
Racial diversity
Place of birth - Born in state of residence (%)
Place of birth - Born in state of residence (%) - White
Place of birth - Born in state of residence (%) - Black or African American
Place of birth - Born in state of residence (%) - Asian
Place of birth - Born in state of residence (%) - Hispanic or Latino
Place of birth - Born in state of residence (%) - American Indian and Alaska Native
Place of birth - Born in state of residence (%) - Multirace
Place of birth - Born in state of residence (%) - Other Race
Place of birth - Born in other state (%)
Place of birth - Born in other state (%) - White
Place of birth - Born in other state (%) - Black or African American
Place of birth - Born in other state (%) - Asian
Place of birth - Born in other state (%) - Hispanic or Latino
Place of birth - Born in other state (%) - American Indian and Alaska Native
Place of birth - Born in other state (%) - Multirace
Place of birth - Born in other state (%) - Other Race
Place of birth - Native, outside of US (%)
Place of birth - Native, outside of US (%) - White
Place of birth - Native, outside of US (%) - Black or African American
Place of birth - Native, outside of US (%) - Asian
Place of birth - Native, outside of US (%) - Hispanic or Latino
Place of birth - Native, outside of US (%) - American Indian and Alaska Native
Place of birth - Native, outside of US (%) - Multirace
Place of birth - Native, outside of US (%) - Other Race
Place of birth - Foreign born (%)
Place of birth - Foreign born (%) - White
Place of birth - Foreign born (%) - Black or African American
Place of birth - Foreign born (%) - Asian
Place of birth - Foreign born (%) - Hispanic or Latino
Place of birth - Foreign born (%) - American Indian and Alaska Native
Place of birth - Foreign born (%) - Multirace
Place of birth - Foreign born (%) - Other Race
Residents speaking English at home (%)
Residents speaking English at home - Born in the United States (%)
Residents speaking English at home - Native, born elsewhere (%)
Residents speaking English at home - Foreign born (%)
Residents speaking Spanish at home (%)
Residents speaking Spanish at home - Born in the United States (%)
Residents speaking Spanish at home - Native, born elsewhere (%)
Residents speaking Spanish at home - Foreign born (%)
Residents speaking other language at home (%)
Residents speaking other language at home - Born in the United States (%)
Residents speaking other language at home - Native, born elsewhere (%)
Residents speaking other language at home - Foreign born (%)
Marital status - Never married (%)
Marital status - Now married (%)
Marital status - Separated (%)
Marital status - Widowed (%)
Marital status - Divorced (%)
Ancestries Reported - Arab (%)
Ancestries Reported - Czech (%)
Ancestries Reported - Danish (%)
Ancestries Reported - Dutch (%)
Ancestries Reported - English (%)
Ancestries Reported - French (%)
Ancestries Reported - French Canadian (%)
Ancestries Reported - German (%)
Ancestries Reported - Greek (%)
Ancestries Reported - Hungarian (%)
Ancestries Reported - Irish (%)
Ancestries Reported - Italian (%)
Ancestries Reported - Lithuanian (%)
Ancestries Reported - Norwegian (%)
Ancestries Reported - Polish (%)
Ancestries Reported - Portuguese (%)
Ancestries Reported - Russian (%)
Ancestries Reported - Scotch-Irish (%)
Ancestries Reported - Scottish (%)
Ancestries Reported - Slovak (%)
Ancestries Reported - Subsaharan African (%)
Ancestries Reported - Swedish (%)
Ancestries Reported - Swiss (%)
Ancestries Reported - Ukrainian (%)
Ancestries Reported - United States (%)
Ancestries Reported - Welsh (%)
Ancestries Reported - West Indian (%)
Ancestries Reported - Other (%)
Geographical mobility - Same house 1 year ago (%)
Geographical mobility - Same house 1 year ago (%) - White
Geographical mobility - Same house 1 year ago (%) - Black or African American
Geographical mobility - Same house 1 year ago (%) - Asian
Geographical mobility - Same house 1 year ago (%) - Hispanic or Latino
Geographical mobility - Same house 1 year ago (%) - American Indian and Alaska Native
Geographical mobility - Same house 1 year ago (%) - Multirace
Geographical mobility - Same house 1 year ago (%) - Other Race
Geographical mobility - Moved within same county (%)
Geographical mobility - Moved within same county (%) - White
Geographical mobility - Moved within same county (%) - Black or African American
Geographical mobility - Moved within same county (%) - Asian
Geographical mobility - Moved within same county (%) - Hispanic or Latino
Geographical mobility - Moved within same county (%) - American Indian and Alaska Native
Geographical mobility - Moved within same county (%) - Multirace
Geographical mobility - Moved within same county (%) - Other Race
Geographical mobility - Moved from different county within same state (%)
Geographical mobility - Moved from different county within same state (%) - White
Geographical mobility - Moved from different county within same state (%) - Black or African American
Geographical mobility - Moved from different county within same state (%) - Asian
Geographical mobility - Moved from different county within same state (%) - Hispanic or Latino
Geographical mobility - Moved from different county within same state (%) - American Indian and Alaska Native
Geographical mobility - Moved from different county within same state (%) - Multirace
Geographical mobility - Moved from different county within same state (%) - Other Race
Geographical mobility - Moved from different state (%)
Geographical mobility - Moved from different state (%) - White
Geographical mobility - Moved from different state (%) - Black or African American
Geographical mobility - Moved from different state (%) - Asian
Geographical mobility - Moved from different state (%) - Hispanic or Latino
Geographical mobility - Moved from different state (%) - American Indian and Alaska Native
Geographical mobility - Moved from different state (%) - Multirace
Geographical mobility - Moved from different state (%) - Other Race
Geographical mobility - Moved from abroad (%)
Geographical mobility - Moved from abroad (%) - White
Geographical mobility - Moved from abroad (%) - Black or African American
Geographical mobility - Moved from abroad (%) - Asian
Geographical mobility - Moved from abroad (%) - Hispanic or Latino
Geographical mobility - Moved from abroad (%) - American Indian and Alaska Native
Geographical mobility - Moved from abroad (%) - Multirace
Geographical mobility - Moved from abroad (%) - Other Race
Place of birth for the foreign-born population - Ireland (%)
Place of birth for the foreign-born population - Denmark (%)
Place of birth for the foreign-born population - Norway (%)
Place of birth for the foreign-born population - Sweden (%)
Place of birth for the foreign-born population - United Kingdom (%)
Place of birth for the foreign-born population - England (%)
Place of birth for the foreign-born population - Scotland (%)
Place of birth for the foreign-born population - Other Northern Europe (%)
Place of birth for the foreign-born population - Austria (%)
Place of birth for the foreign-born population - Belgium (%)
Place of birth for the foreign-born population - France (%)
Place of birth for the foreign-born population - Germany (%)
Place of birth for the foreign-born population - Netherlands (%)
Place of birth for the foreign-born population - Switzerland (%)
Place of birth for the foreign-born population - Other Western Europe (%)
Place of birth for the foreign-born population - Greece (%)
Place of birth for the foreign-born population - Italy (%)
Place of birth for the foreign-born population - Portugal (%)
Place of birth for the foreign-born population - Spain (%)
Place of birth for the foreign-born population - Other Southern Europe (%)
Place of birth for the foreign-born population - Albania (%)
Place of birth for the foreign-born population - Belarus (%)
Place of birth for the foreign-born population - Bosnia and Herzegovina (%)
Place of birth for the foreign-born population - Bulgaria (%)
Place of birth for the foreign-born population - Croatia (%)
Place of birth for the foreign-born population - Czechoslovakia (%)
Place of birth for the foreign-born population - Hungary (%)
Place of birth for the foreign-born population - Latvia (%)
Place of birth for the foreign-born population - Lithuania (%)
Place of birth for the foreign-born population - North Macedonia (Macedonia) (%)
Place of birth for the foreign-born population - Moldova (%)
Place of birth for the foreign-born population - Poland (%)
Place of birth for the foreign-born population - Romania (%)
Place of birth for the foreign-born population - Russia (%)
Place of birth for the foreign-born population - Serbia (%)
Place of birth for the foreign-born population - Ukraine (%)
Place of birth for the foreign-born population - Other Eastern Europe (%)
Place of birth for the foreign-born population - China (%)
Place of birth for the foreign-born population - Hong Kong (%)
Place of birth for the foreign-born population - Taiwan (%)
Place of birth for the foreign-born population - Japan (%)
Place of birth for the foreign-born population - Korea (%)
Place of birth for the foreign-born population - Other Eastern Asia (%)
Place of birth for the foreign-born population - Afghanistan (%)
Place of birth for the foreign-born population - Bangladesh (%)
Place of birth for the foreign-born population - India (%)
Place of birth for the foreign-born population - Iran (%)
Place of birth for the foreign-born population - Kazakhstan (%)
Place of birth for the foreign-born population - Nepal (%)
Place of birth for the foreign-born population - Pakistan (%)
Place of birth for the foreign-born population - Sri Lanka (%)
Place of birth for the foreign-born population - Uzbekistan (%)
Place of birth for the foreign-born population - Other South Central Asia (%)
Place of birth for the foreign-born population - Burma (%)
Place of birth for the foreign-born population - Cambodia (%)
Place of birth for the foreign-born population - Indonesia (%)
Place of birth for the foreign-born population - Laos (%)
Place of birth for the foreign-born population - Malaysia (%)
Place of birth for the foreign-born population - Philippines (%)
Place of birth for the foreign-born population - Singapore (%)
Place of birth for the foreign-born population - Thailand (%)
Place of birth for the foreign-born population - Vietnam (%)
Place of birth for the foreign-born population - Other South Eastern Asia (%)
Place of birth for the foreign-born population - Armenia (%)
Place of birth for the foreign-born population - Iraq (%)
Place of birth for the foreign-born population - Israel (%)
Place of birth for the foreign-born population - Jordan (%)
Place of birth for the foreign-born population - Kuwait (%)
Place of birth for the foreign-born population - Lebanon (%)
Place of birth for the foreign-born population - Saudi Arabia (%)
Place of birth for the foreign-born population - Syria (%)
Place of birth for the foreign-born population - Turkey (%)
Place of birth for the foreign-born population - Yemen (%)
Place of birth for the foreign-born population - Other Western Asia (%)
Place of birth for the foreign-born population - Eritrea (%)
Place of birth for the foreign-born population - Ethiopia (%)
Place of birth for the foreign-born population - Kenya (%)
Place of birth for the foreign-born population - Somalia (%)
Place of birth for the foreign-born population - Uganda (%)
Place of birth for the foreign-born population - Zimbabwe (%)
Place of birth for the foreign-born population - Other Eastern Africa (%)
Place of birth for the foreign-born population - Cameroon (%)
Place of birth for the foreign-born population - Congo (%)
Place of birth for the foreign-born population - Democratic Republic of Congo (Zaire) (%)
Place of birth for the foreign-born population - Other Middle Africa (%)
Place of birth for the foreign-born population - Egypt (%)
Place of birth for the foreign-born population - Morocco (%)
Place of birth for the foreign-born population - Sudan (%)
Place of birth for the foreign-born population - Other Northern Africa (%)
Place of birth for the foreign-born population - South Africa (%)
Place of birth for the foreign-born population - Other Southern Africa (%)
Place of birth for the foreign-born population - Cabo Verde (%)
Place of birth for the foreign-born population - Ghana (%)
Place of birth for the foreign-born population - Liberia (%)
Place of birth for the foreign-born population - Nigeria (%)
Place of birth for the foreign-born population - Senegal (%)
Place of birth for the foreign-born population - Sierra Leone (%)
Place of birth for the foreign-born population - Other Western Africa (%)
Place of birth for the foreign-born population - Australia (%)
Place of birth for the foreign-born population - New Zealand (%)
Place of birth for the foreign-born population - Fiji (%)
Place of birth for the foreign-born population - Micronesia (%)
Place of birth for the foreign-born population - Bahamas (%)
Place of birth for the foreign-born population - Barbados (%)
Place of birth for the foreign-born population - Cuba (%)
Place of birth for the foreign-born population - Dominica (%)
Place of birth for the foreign-born population - Dominican Republic (%)
Place of birth for the foreign-born population - Grenada (%)
Place of birth for the foreign-born population - Haiti (%)
Place of birth for the foreign-born population - Jamaica (%)
Place of birth for the foreign-born population - St. Vincent and the Grenadines (%)
Place of birth for the foreign-born population - Trinidad and Tobago (%)
Place of birth for the foreign-born population - West Indies (%)
Place of birth for the foreign-born population - Other Caribbean (%)
Place of birth for the foreign-born population - Belize (%)
Place of birth for the foreign-born population - Costa Rica (%)
Place of birth for the foreign-born population - El Salvador (%)
Place of birth for the foreign-born population - Guatemala (%)
Place of birth for the foreign-born population - Honduras (%)
Place of birth for the foreign-born population - Mexico (%)
Place of birth for the foreign-born population - Nicaragua (%)
Place of birth for the foreign-born population - Panama (%)
Place of birth for the foreign-born population - Other Central America (%)
Place of birth for the foreign-born population - Argentina (%)
Place of birth for the foreign-born population - Bolivia (%)
Place of birth for the foreign-born population - Brazil (%)
Place of birth for the foreign-born population - Chile (%)
Place of birth for the foreign-born population - Colombia (%)
Place of birth for the foreign-born population - Ecuador (%)
Place of birth for the foreign-born population - Guyana (%)
Place of birth for the foreign-born population - Peru (%)
Place of birth for the foreign-born population - Uruguay (%)
Place of birth for the foreign-born population - Venezuela (%)
Place of birth for the foreign-born population - Other South America (%)
Place of birth for the foreign-born population - Canada (%)
Place of birth for the foreign-born population - Other Northern America (%)
Place of birth for the foreign-born population - Other (%)
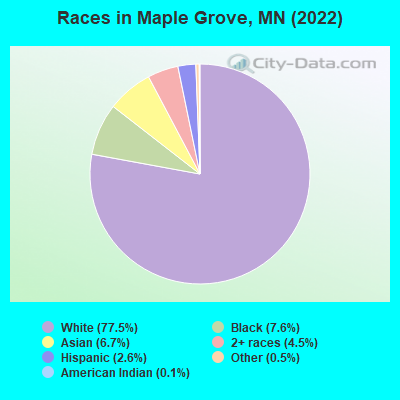
According to 2022 data, the most numerous races in Maple Grove, MN are White alone (53,894 residents), Black alone (5,312 residents), and Hispanic (1,785 residents). 81.6% of Maple Grove residents speak English at home. 12.0% of Maple Grove, MN residents are foreign-born (4.9% born in Asia, 3.2% born in Africa, 2.1% born in Europe), which is 33.2% greater than the foreign-born rate of 8.0% across the entire state of Minnesota.
Race distribution in Maple Grove
2000 2022
4,337,143 88.2% White alone 168,813 3.4% Black alone 143,382 2.9% Hispanic 141,083 2.9% Asian alone 70,304 1.4% Two or more races 52,009 1.1% American Indian alone 5,031 0.1% Other race alone 1,714 0.03% Native Hawaiian and Other
4,356,347 76.2% White alone 395,179 6.9% Black alone 333,830 5.8% Hispanic 294,800 5.2% Asian alone 259,649 4.5% Two or more races 42,125 0.7% American Indian alone 32,976 0.6% Other race alone 2,278 0.04% Native Hawaiian and Other
Income and house value in Maple Grove Median household income in 2022 $106,304 White non-Hispanic householders$110,801 Black householders$146,065 Asian householdersover $200,000 Some other race householders$89,183 Two or more races householders$104,569 Hispanic or Latino race householdersMedian 2022 house value $409,392 White Non-Hispanic householders$418,097 Black or African American householders$280,402 American Indian or Alaska Native householders $465,315 Asian householders$362,703 Native Hawaiian and other Pacific Islander householders$649,964 Some other race householders$350,305 Two or more races householders$442,365 Hispanic or Latino householders
Median age by race in Maple Grove
46.8 Median age for White residents44.5 48.4 17.4 Median age for Black or African American residents13.8 20.5 -666,666,666.0 Median age for American Indian / Alaska Native residents-666,666,666.0 -666,666,666.0 38.1 Median age for Asian residents39.1 38.0 -666,666,666.0 Median age for Native Hawaiian / Pacific Islander residents-666,666,666.0 -666,666,666.0 18.2 Median age for Other race residents18.9 27.9 16.2 Median age for Two or more races residents16.5 17.5 46.6 Median age for White alone residents44.4 48.3 36.8 Median age for Hispanic or Latino residents26.0 44.2
Owner/renter occupied households by race in Maple Grove
House owners and renters - White residents 17,822 83.2% Owner occupied3,610 16.8% Renter occupiedHouse owners and renters - Black or African American residents 417 29.4% Owner occupied999 70.6% Renter occupiedHouse owners and renters - American Indian / Alaska Native residents 60 89.4% Owner occupied7 10.6% Renter occupiedHouse owners and renters - Asian residents 1,722 72.3% Owner occupied661 27.7% Renter occupiedHouse owners and renters - Other race residents 118 91.9% Owner occupied10 8.1% Renter occupiedHouse owners and renters - Two or more races residents 922 61.3% Owner occupied583 38.7% Renter occupiedHouse owners and renters - White alone residents 17,745 83.1% Owner occupied3,610 16.9% Renter occupiedHouse owners and renters - Hispanic or Latino residents 371 69.6% Owner occupied162 30.4% Renter occupied
Language usage in Maple Grove
English speakers - Total 81.6% of residents of Maple Grove speak English at home.
1.2% of residents speak Spanish at home 519 66.5% Speak English very well261 33.5% Speak English less than very well17.2% of residents speak other language at home 7,862 69.3% Speak English very well3,479 30.7% Speak English less than very well
English speakers - Born in the United States 93.9% of residents of Maple Grove speak English at home.
0.4% of residents speak Spanish at home 64 100.0% Speak English very well5.8% of residents speak other language at home 678 67.4% Speak English very well328 32.6% Speak English less than very well
English speakers - Native, born elsewhere 23.4% of residents of Maple Grove speak English at home.
10.9% of residents speak Spanish at home 127 100.0% Speak English very well65.7% of residents speak other language at home 529 69.2% Speak English very well235 30.8% Speak English less than very well
English speakers - Foreign-born 24.0% of residents of Maple Grove speak English at home.
3.2% of residents speak Spanish at home 151 52.1% Speak English very well139 47.9% Speak English less than very well72.9% of residents speak other language at home 4,548 67.9% Speak English very well2,153 32.1% Speak English less than very well
White (Caucasian) - Speak only English Native:
98.6% (44,355)Foreign-born:
46.8% (845)
White (Caucasian) - Speak another language Native:
1.4% (626)Foreign-born:
53.2% (962)
Black or African American - Speak only English Native:
64.0% (1,560)Foreign-born:
26.6% (630)
Black or African American - Speak another language Native:
43.8% (1,068)Foreign-born:
69.1% (1,635)
American Indian / Alaska Native - Speak only English Native:
81.8% (105)Foreign-born:
63.2% (20)
Asian - Speak only English Native:
58.3% (1,280)Foreign-born:
26.3% (1,119)
Asian - Speak another language Native:
41.7% (916)Foreign-born:
73.7% (3,138)
Other race - Speak only English Native:
100.0% (518)Foreign-born:
29.8% (43)
Other race - Speak another language Native:
9.1% (47)Foreign-born:
69.1% (99)
Two or more races - Speak only English Native:
83.6% (3,030)Foreign-born:
18.3% (53)
Two or more races - Speak another language Native:
15.7% (570)Foreign-born:
81.5% (235)
White alone - Speak only English Native:
98.6% (44,122)Foreign-born:
46.8% (845)
White alone - Speak another language Native:
1.4% (626)Foreign-born:
53.2% (962)
Hispanic or Latino - Speak only English Native:
89.6% (1,187)Foreign-born:
19.6% (69)
Hispanic or Latino - Speak another language Native:
16.5% (218)Foreign-born:
82.2% (291)
Foreign-born residents in Maple Grove 8,327 residents are foreign born (4.9% Asia , 3.2% Africa , 2.1% Europe ).
This city:
12.0%Minnesota:
8.5%
Marital status for residents in Maple Grove Marital status - White (Caucasian) population 15 years and over
Males 27.4% Never married64.1% Now married0.0% Separated2.7% Widowed5.8% DivorcedFemales 22.2% Never married58.4% Now married0.5% Separated7.0% Widowed12.0% DivorcedWomen who gave birth in the past 12 months Now married:
39.2% (376)Unmarried:
60.8% (582)
Women who did not give birth in the past 12 months Now married:
57.0% (4,690)Unmarried:
43.0% (3,544)
Marital status - Black or African American population 15 years and over
Males 37.9% Never married46.5% Now married0.0% Separated3.3% Widowed12.4% DivorcedFemales 38.7% Never married37.5% Now married5.6% Separated4.0% Widowed14.2% DivorcedWomen who gave birth in the past 12 months Now married:
89.0% (111)Unmarried:
11.0% (14)
Women who did not give birth in the past 12 months Now married:
35.0% (544)Unmarried:
65.0% (1,009)
Marital status - American Indian / Alaska Native population 15 years and over
Males 42.0% Never married58.0% Now married0.0% Separated0.0% Widowed0.0% DivorcedFemales 89.8% Never married0.0% Now married10.2% Separated0.0% Widowed0.0% DivorcedWomen who did not give birth in the past 12 months Now married:
13.0% (6)Unmarried:
87.0% (42)
Marital status - Asian population 15 years and over
Males 33.6% Never married58.6% Now married0.0% Separated2.7% Widowed5.1% DivorcedFemales 11.5% Never married75.6% Now married0.0% Separated0.0% Widowed12.9% DivorcedWomen who gave birth in the past 12 months Now married:
100.0% (111)Unmarried:
0.0% (0)
Women who did not give birth in the past 12 months Now married:
71.8% (949)Unmarried:
28.2% (372)
Marital status - Other race population 15 years and over
Males 55.6% Never married40.9% Now married0.0% Separated0.0% Widowed3.6% DivorcedFemales 14.2% Never married77.3% Now married0.0% Separated0.0% Widowed8.5% DivorcedWomen who gave birth in the past 12 months Now married:
100.0% (28)Unmarried:
0.0% (0)
Women who did not give birth in the past 12 months Now married:
67.7% (86)Unmarried:
32.3% (41)
Marital status - Two or more races population 15 years and over
Males 37.1% Never married54.2% Now married0.0% Separated0.0% Widowed8.6% DivorcedFemales 58.0% Never married34.3% Now married3.4% Separated0.0% Widowed4.3% DivorcedWomen who gave birth in the past 12 months Now married:
97.1% (169)Unmarried:
2.9% (5)
Women who did not give birth in the past 12 months Now married:
18.9% (264)Unmarried:
81.1% (1,131)
Marital status - White alone, not Hispanic / Latino population 15 years and over
Males 27.6% Never married64.4% Now married0.0% Separated2.7% Widowed5.3% DivorcedFemales 22.1% Never married58.4% Now married0.5% Separated7.0% Widowed12.1% DivorcedWomen who gave birth in the past 12 months Now married:
39.2% (376)Unmarried:
60.8% (582)
Women who did not give birth in the past 12 months Now married:
57.3% (4,690)Unmarried:
42.7% (3,490)
Marital status - Hispanic or Latino population 15 years and over
Males 47.5% Never married46.7% Now married0.0% Separated0.0% Widowed5.8% DivorcedFemales 34.9% Never married51.0% Now married1.1% Separated0.0% Widowed13.0% DivorcedWomen who did not give birth in the past 12 months Now married:
39.4% (140)Unmarried:
60.6% (216)
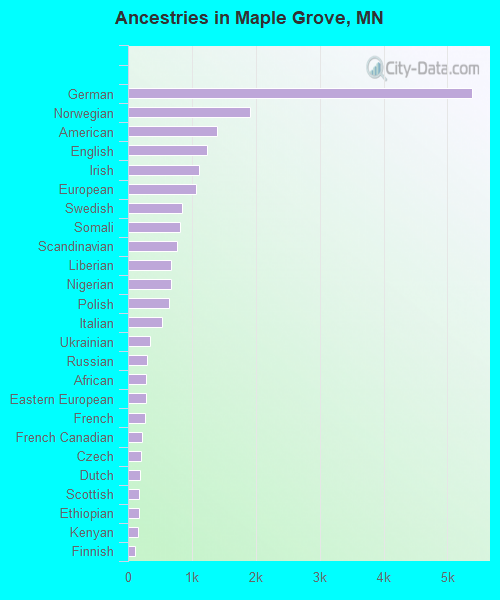
Ancestries in Maple Grove
5,382 20.0% German1,912 7.1% Norwegian1,396 5.2% American1,229 4.6% English1,119 4.2% Irish1,064 3.9% European845 3.1% Swedish812 3.0% Somali767 2.8% Scandinavian678 2.5% Liberian677 2.5% Nigerian642 2.4% Polish539 2.0% Italian348 1.3% Ukrainian297 1.1% Russian285 1.1% African274 1.0% Eastern European273 1.0% French218 0.8% French Canadian208 0.8% Czech193 0.7% Dutch179 0.7% Scottish173 0.6% Ethiopian158 0.6% Kenyan111 0.4% Finnish107 0.4% Canadian103 0.4% Jamaican65 0.2% Danish61 0.2% Slovak57 0.2% Northern European53 0.2% Latvian51 0.2% British49 0.2% Belgian44 0.2% Romanian40 0.1% Lithuanian40 0.1% Lebanese34 0.1% Swiss33 0.1% Syrian32 0.1% Portuguese32 0.1% Turkish27 0.1% Croatian27 0.1% Brazilian26 0.10% Greek25 0.09% Welsh21 0.08% Hungarian20 0.07% Scotch-Irish19 0.07% Australian12 0.04% Iranian11 0.04% Slovene10 0.04% Egyptian9 0.03% Pennsylvania German9 0.03% Estonian9 0.03% Austrian5 0.02% Guyanese
Geographical mobility in Maple Grove Same house 1 year ago 44,463 91.6% White (Caucasian)4,339 84.1% Black or African American166 100.0% American Indian / Alaska Native3,603 78.6% Asian665 98.6% Other race3,122 74.7% Two or more races44,332 91.8% White alone, not Hispanic / Latino1,409 79.5% Hispanic or LatinoMoved within same county 3,130 6.4% White / Caucasian64 1.3% Black or African American10 6.0% American Indian / Alaska Native634 13.8% Asian798 19.1% Two or more races3,028 6.3% White alone, not Hispanic / Latino202 11.4% Hispanic or LatinoMoved within same state 537 1.1% White / Caucasian166 3.2% Black or African American102 2.2% Asian22 3.3% Other race57 1.4% Two or more races537 1.1% White alone, not Hispanic / Latino18 1.0% Hispanic or LatinoMoved from different state 277 0.6% White / Caucasian814 15.8% Black or African American92 2.0% Asian277 0.6% White alone, not Hispanic / Latino177 10.0% Hispanic or LatinoMoved from abroad 137 0.3% White87 1.7% Black or African American84 1.8% Asian137 0.3% White alone, not Hispanic / Latino
Children Nativity (place of birth) in Maple Grove
Children under 6 years - Living with two parents Both parents native 2,862 99.6% Native12 0.4% Foreign-bornBoth parents foreign-born 632 95.9% Native27 4.1% Foreign-bornOne native, one foreign-born parent 284 100.0% NativeChildren under 6 years - Living with one parent Native parent 262 100.0% NativeForeign-born parent 100 100.0% NativeChildren 6 to 17 years - Living with two parents Both parents native 7,822 98.2% Native144 1.8% Foreign-bornBoth parents foreign-born 955 72.6% Native360 27.4% Foreign-bornOne native, one foreign-born parent 1,254 100.0% NativeChildren 6 to 17 years - Living with one parent Native parent 1,475 100.0% NativeForeign-born parent 287 52.8% Native257 47.2% Foreign-born
Grandparents responsible for own grandchildren in Maple Grove
Grandparents (30 to 59 years) White / Caucasian 8 100.0% Not responsible for grandchildrenAmerican Indian / Alaska Native 11 100.0% Not responsible for grandchildrenAsian 22 100.0% Not responsible for grandchildrenWhite alone, not Hispanic / Latino 9 100.0% Not responsible for grandchildrenGrandparents (60 years and over) White / Caucasian 42 10.4% Responsible for grandchildren364 89.6% Not responsible for grandchildrenAsian 127 100.0% Not responsible for grandchildrenWhite alone, not Hispanic / Latino 43 10.7% Responsible for grandchildren361 89.3% Not responsible for grandchildren