Races in Manorville, New York (NY) Detailed Stats
Data:
Races - White alone (%)
Races - White alone (% change since 2000)
Races - Black alone (%)
Races - Black alone (% change since 2000)
Races - American Indian alone (%)
Races - American Indian alone (% change since 2000)
Races - Asian alone (%)
Races - Asian alone (% change since 2000)
Races - Hispanic (%)
Races - Hispanic (% change since 2000)
Races - Native Hawaiian and Other Pacific Islander alone (%)
Races - Native Hawaiian and Other Pacific Islander alone (% change since 2000)
Races - Two or more races(%)
Races - Two or more races(% change since 2000)
Races - Other race alone (%)
Races - Other race alone (% change since 2000)
Racial diversity
Place of birth - Born in state of residence (%)
Place of birth - Born in state of residence (%) - White
Place of birth - Born in state of residence (%) - Black or African American
Place of birth - Born in state of residence (%) - Asian
Place of birth - Born in state of residence (%) - Hispanic or Latino
Place of birth - Born in state of residence (%) - American Indian and Alaska Native
Place of birth - Born in state of residence (%) - Multirace
Place of birth - Born in state of residence (%) - Other Race
Place of birth - Born in other state (%)
Place of birth - Born in other state (%) - White
Place of birth - Born in other state (%) - Black or African American
Place of birth - Born in other state (%) - Asian
Place of birth - Born in other state (%) - Hispanic or Latino
Place of birth - Born in other state (%) - American Indian and Alaska Native
Place of birth - Born in other state (%) - Multirace
Place of birth - Born in other state (%) - Other Race
Place of birth - Native, outside of US (%)
Place of birth - Native, outside of US (%) - White
Place of birth - Native, outside of US (%) - Black or African American
Place of birth - Native, outside of US (%) - Asian
Place of birth - Native, outside of US (%) - Hispanic or Latino
Place of birth - Native, outside of US (%) - American Indian and Alaska Native
Place of birth - Native, outside of US (%) - Multirace
Place of birth - Native, outside of US (%) - Other Race
Place of birth - Foreign born (%)
Place of birth - Foreign born (%) - White
Place of birth - Foreign born (%) - Black or African American
Place of birth - Foreign born (%) - Asian
Place of birth - Foreign born (%) - Hispanic or Latino
Place of birth - Foreign born (%) - American Indian and Alaska Native
Place of birth - Foreign born (%) - Multirace
Place of birth - Foreign born (%) - Other Race
Residents speaking English at home (%)
Residents speaking English at home - Born in the United States (%)
Residents speaking English at home - Native, born elsewhere (%)
Residents speaking English at home - Foreign born (%)
Residents speaking Spanish at home (%)
Residents speaking Spanish at home - Born in the United States (%)
Residents speaking Spanish at home - Native, born elsewhere (%)
Residents speaking Spanish at home - Foreign born (%)
Residents speaking other language at home (%)
Residents speaking other language at home - Born in the United States (%)
Residents speaking other language at home - Native, born elsewhere (%)
Residents speaking other language at home - Foreign born (%)
Marital status - Never married (%)
Marital status - Now married (%)
Marital status - Separated (%)
Marital status - Widowed (%)
Marital status - Divorced (%)
Ancestries Reported - Arab (%)
Ancestries Reported - Czech (%)
Ancestries Reported - Danish (%)
Ancestries Reported - Dutch (%)
Ancestries Reported - English (%)
Ancestries Reported - French (%)
Ancestries Reported - French Canadian (%)
Ancestries Reported - German (%)
Ancestries Reported - Greek (%)
Ancestries Reported - Hungarian (%)
Ancestries Reported - Irish (%)
Ancestries Reported - Italian (%)
Ancestries Reported - Lithuanian (%)
Ancestries Reported - Norwegian (%)
Ancestries Reported - Polish (%)
Ancestries Reported - Portuguese (%)
Ancestries Reported - Russian (%)
Ancestries Reported - Scotch-Irish (%)
Ancestries Reported - Scottish (%)
Ancestries Reported - Slovak (%)
Ancestries Reported - Subsaharan African (%)
Ancestries Reported - Swedish (%)
Ancestries Reported - Swiss (%)
Ancestries Reported - Ukrainian (%)
Ancestries Reported - United States (%)
Ancestries Reported - Welsh (%)
Ancestries Reported - West Indian (%)
Ancestries Reported - Other (%)
Geographical mobility - Same house 1 year ago (%)
Geographical mobility - Same house 1 year ago (%) - White
Geographical mobility - Same house 1 year ago (%) - Black or African American
Geographical mobility - Same house 1 year ago (%) - Asian
Geographical mobility - Same house 1 year ago (%) - Hispanic or Latino
Geographical mobility - Same house 1 year ago (%) - American Indian and Alaska Native
Geographical mobility - Same house 1 year ago (%) - Multirace
Geographical mobility - Same house 1 year ago (%) - Other Race
Geographical mobility - Moved within same county (%)
Geographical mobility - Moved within same county (%) - White
Geographical mobility - Moved within same county (%) - Black or African American
Geographical mobility - Moved within same county (%) - Asian
Geographical mobility - Moved within same county (%) - Hispanic or Latino
Geographical mobility - Moved within same county (%) - American Indian and Alaska Native
Geographical mobility - Moved within same county (%) - Multirace
Geographical mobility - Moved within same county (%) - Other Race
Geographical mobility - Moved from different county within same state (%)
Geographical mobility - Moved from different county within same state (%) - White
Geographical mobility - Moved from different county within same state (%) - Black or African American
Geographical mobility - Moved from different county within same state (%) - Asian
Geographical mobility - Moved from different county within same state (%) - Hispanic or Latino
Geographical mobility - Moved from different county within same state (%) - American Indian and Alaska Native
Geographical mobility - Moved from different county within same state (%) - Multirace
Geographical mobility - Moved from different county within same state (%) - Other Race
Geographical mobility - Moved from different state (%)
Geographical mobility - Moved from different state (%) - White
Geographical mobility - Moved from different state (%) - Black or African American
Geographical mobility - Moved from different state (%) - Asian
Geographical mobility - Moved from different state (%) - Hispanic or Latino
Geographical mobility - Moved from different state (%) - American Indian and Alaska Native
Geographical mobility - Moved from different state (%) - Multirace
Geographical mobility - Moved from different state (%) - Other Race
Geographical mobility - Moved from abroad (%)
Geographical mobility - Moved from abroad (%) - White
Geographical mobility - Moved from abroad (%) - Black or African American
Geographical mobility - Moved from abroad (%) - Asian
Geographical mobility - Moved from abroad (%) - Hispanic or Latino
Geographical mobility - Moved from abroad (%) - American Indian and Alaska Native
Geographical mobility - Moved from abroad (%) - Multirace
Geographical mobility - Moved from abroad (%) - Other Race
Place of birth for the foreign-born population - Ireland (%)
Place of birth for the foreign-born population - Denmark (%)
Place of birth for the foreign-born population - Norway (%)
Place of birth for the foreign-born population - Sweden (%)
Place of birth for the foreign-born population - United Kingdom (%)
Place of birth for the foreign-born population - England (%)
Place of birth for the foreign-born population - Scotland (%)
Place of birth for the foreign-born population - Other Northern Europe (%)
Place of birth for the foreign-born population - Austria (%)
Place of birth for the foreign-born population - Belgium (%)
Place of birth for the foreign-born population - France (%)
Place of birth for the foreign-born population - Germany (%)
Place of birth for the foreign-born population - Netherlands (%)
Place of birth for the foreign-born population - Switzerland (%)
Place of birth for the foreign-born population - Other Western Europe (%)
Place of birth for the foreign-born population - Greece (%)
Place of birth for the foreign-born population - Italy (%)
Place of birth for the foreign-born population - Portugal (%)
Place of birth for the foreign-born population - Spain (%)
Place of birth for the foreign-born population - Other Southern Europe (%)
Place of birth for the foreign-born population - Albania (%)
Place of birth for the foreign-born population - Belarus (%)
Place of birth for the foreign-born population - Bosnia and Herzegovina (%)
Place of birth for the foreign-born population - Bulgaria (%)
Place of birth for the foreign-born population - Croatia (%)
Place of birth for the foreign-born population - Czechoslovakia (%)
Place of birth for the foreign-born population - Hungary (%)
Place of birth for the foreign-born population - Latvia (%)
Place of birth for the foreign-born population - Lithuania (%)
Place of birth for the foreign-born population - North Macedonia (Macedonia) (%)
Place of birth for the foreign-born population - Moldova (%)
Place of birth for the foreign-born population - Poland (%)
Place of birth for the foreign-born population - Romania (%)
Place of birth for the foreign-born population - Russia (%)
Place of birth for the foreign-born population - Serbia (%)
Place of birth for the foreign-born population - Ukraine (%)
Place of birth for the foreign-born population - Other Eastern Europe (%)
Place of birth for the foreign-born population - China (%)
Place of birth for the foreign-born population - Hong Kong (%)
Place of birth for the foreign-born population - Taiwan (%)
Place of birth for the foreign-born population - Japan (%)
Place of birth for the foreign-born population - Korea (%)
Place of birth for the foreign-born population - Other Eastern Asia (%)
Place of birth for the foreign-born population - Afghanistan (%)
Place of birth for the foreign-born population - Bangladesh (%)
Place of birth for the foreign-born population - India (%)
Place of birth for the foreign-born population - Iran (%)
Place of birth for the foreign-born population - Kazakhstan (%)
Place of birth for the foreign-born population - Nepal (%)
Place of birth for the foreign-born population - Pakistan (%)
Place of birth for the foreign-born population - Sri Lanka (%)
Place of birth for the foreign-born population - Uzbekistan (%)
Place of birth for the foreign-born population - Other South Central Asia (%)
Place of birth for the foreign-born population - Burma (%)
Place of birth for the foreign-born population - Cambodia (%)
Place of birth for the foreign-born population - Indonesia (%)
Place of birth for the foreign-born population - Laos (%)
Place of birth for the foreign-born population - Malaysia (%)
Place of birth for the foreign-born population - Philippines (%)
Place of birth for the foreign-born population - Singapore (%)
Place of birth for the foreign-born population - Thailand (%)
Place of birth for the foreign-born population - Vietnam (%)
Place of birth for the foreign-born population - Other South Eastern Asia (%)
Place of birth for the foreign-born population - Armenia (%)
Place of birth for the foreign-born population - Iraq (%)
Place of birth for the foreign-born population - Israel (%)
Place of birth for the foreign-born population - Jordan (%)
Place of birth for the foreign-born population - Kuwait (%)
Place of birth for the foreign-born population - Lebanon (%)
Place of birth for the foreign-born population - Saudi Arabia (%)
Place of birth for the foreign-born population - Syria (%)
Place of birth for the foreign-born population - Turkey (%)
Place of birth for the foreign-born population - Yemen (%)
Place of birth for the foreign-born population - Other Western Asia (%)
Place of birth for the foreign-born population - Eritrea (%)
Place of birth for the foreign-born population - Ethiopia (%)
Place of birth for the foreign-born population - Kenya (%)
Place of birth for the foreign-born population - Somalia (%)
Place of birth for the foreign-born population - Uganda (%)
Place of birth for the foreign-born population - Zimbabwe (%)
Place of birth for the foreign-born population - Other Eastern Africa (%)
Place of birth for the foreign-born population - Cameroon (%)
Place of birth for the foreign-born population - Congo (%)
Place of birth for the foreign-born population - Democratic Republic of Congo (Zaire) (%)
Place of birth for the foreign-born population - Other Middle Africa (%)
Place of birth for the foreign-born population - Egypt (%)
Place of birth for the foreign-born population - Morocco (%)
Place of birth for the foreign-born population - Sudan (%)
Place of birth for the foreign-born population - Other Northern Africa (%)
Place of birth for the foreign-born population - South Africa (%)
Place of birth for the foreign-born population - Other Southern Africa (%)
Place of birth for the foreign-born population - Cabo Verde (%)
Place of birth for the foreign-born population - Ghana (%)
Place of birth for the foreign-born population - Liberia (%)
Place of birth for the foreign-born population - Nigeria (%)
Place of birth for the foreign-born population - Senegal (%)
Place of birth for the foreign-born population - Sierra Leone (%)
Place of birth for the foreign-born population - Other Western Africa (%)
Place of birth for the foreign-born population - Australia (%)
Place of birth for the foreign-born population - New Zealand (%)
Place of birth for the foreign-born population - Fiji (%)
Place of birth for the foreign-born population - Micronesia (%)
Place of birth for the foreign-born population - Bahamas (%)
Place of birth for the foreign-born population - Barbados (%)
Place of birth for the foreign-born population - Cuba (%)
Place of birth for the foreign-born population - Dominica (%)
Place of birth for the foreign-born population - Dominican Republic (%)
Place of birth for the foreign-born population - Grenada (%)
Place of birth for the foreign-born population - Haiti (%)
Place of birth for the foreign-born population - Jamaica (%)
Place of birth for the foreign-born population - St. Vincent and the Grenadines (%)
Place of birth for the foreign-born population - Trinidad and Tobago (%)
Place of birth for the foreign-born population - West Indies (%)
Place of birth for the foreign-born population - Other Caribbean (%)
Place of birth for the foreign-born population - Belize (%)
Place of birth for the foreign-born population - Costa Rica (%)
Place of birth for the foreign-born population - El Salvador (%)
Place of birth for the foreign-born population - Guatemala (%)
Place of birth for the foreign-born population - Honduras (%)
Place of birth for the foreign-born population - Mexico (%)
Place of birth for the foreign-born population - Nicaragua (%)
Place of birth for the foreign-born population - Panama (%)
Place of birth for the foreign-born population - Other Central America (%)
Place of birth for the foreign-born population - Argentina (%)
Place of birth for the foreign-born population - Bolivia (%)
Place of birth for the foreign-born population - Brazil (%)
Place of birth for the foreign-born population - Chile (%)
Place of birth for the foreign-born population - Colombia (%)
Place of birth for the foreign-born population - Ecuador (%)
Place of birth for the foreign-born population - Guyana (%)
Place of birth for the foreign-born population - Peru (%)
Place of birth for the foreign-born population - Uruguay (%)
Place of birth for the foreign-born population - Venezuela (%)
Place of birth for the foreign-born population - Other South America (%)
Place of birth for the foreign-born population - Canada (%)
Place of birth for the foreign-born population - Other Northern America (%)
Place of birth for the foreign-born population - Other (%)
Latest news about races in Manorville, NY collected exclusively by city-data.com from local newspapers, TV, and radio stations
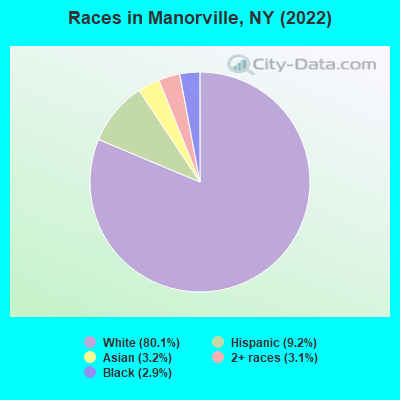
According to 2022 data, the most numerous races in Manorville, NY are White alone (10,167 residents), Hispanic (1,170 residents), and Black alone (363 residents). 87.0% of Manorville residents speak English at home. 8.3% of Manorville, NY residents are foreign-born (3.6% born in Europe, 3.0% born in Asia, 1.5% born in Latin America), which is 164.1% less than the foreign-born rate of 22.0% across the entire state of New York.
Race distribution in Manorville
2000 2022
11,760,981 62.0% White alone 2,867,583 15.1% Hispanic 2,812,623 14.8% Black alone 1,035,926 5.5% Asian alone 366,116 1.9% Two or more races 75,499 0.4% Other race alone 52,499 0.3% American Indian alone 5,230 0.03% Native Hawaiian and Other
10,408,933 52.9% White alone 3,867,299 19.7% Hispanic 2,633,840 13.4% Black alone 1,776,286 9.0% Asian alone 732,670 3.7% Two or more races 216,110 1.1% Other race alone 35,082 0.2% American Indian alone 6,931 0.04% Native Hawaiian and Other
Income and house value in Manorville Median household income in 2022 $118,732 White non-Hispanic householders$178,660 Two or more races householders$151,422 Hispanic or Latino race householdersMedian 2022 house value $583,224 White Non-Hispanic householdersover $1,000,000 Black or African American householders $687,764 Asian householders$840,601 Some other race householders$649,555 Two or more races householders$764,182 Hispanic or Latino householders
Median age by race in Manorville
51.8 Median age for White residents51.6 51.6 58.9 Median age for Black or African American residents56.4 58.9 -748,832,865.7 Median age for American Indian / Alaska Native residents-807,017,543.1 -513,692,161.9 39.6 Median age for Asian residents39.9 41.9 -742,816,091.2 Median age for Native Hawaiian / Pacific Islander residents-831,187,409.8 -771,300,447.7 -656,565,655.9 Median age for Other race residents-643,206,255.5 -677,215,189.2 26.4 Median age for Two or more races residents23.9 30.2 50.8 Median age for White alone residents50.8 51.0 24.6 Median age for Hispanic or Latino residents25.8 24.2
Owner/renter occupied households by race in Manorville
House owners and renters - White residents 3,623 86.7% Owner occupied555 13.3% Renter occupiedHouse owners and renters - Black or African American residents 78 50.7% Owner occupied76 49.3% Renter occupiedHouse owners and renters - Asian residents 71 62.4% Owner occupied43 37.6% Renter occupiedHouse owners and renters - Two or more races residents 312 100.0% Owner occupiedHouse owners and renters - White alone residents 3,554 85.5% Owner occupied604 14.5% Renter occupiedHouse owners and renters - Hispanic or Latino residents 345 100.0% Owner occupied
Language usage in Manorville
English speakers - Total 87.0% of residents of Manorville speak English at home.
1.6% of residents speak Spanish at home 115 58.7% Speak English very well81 41.3% Speak English less than very well10.7% of residents speak other language at home 1,006 77.3% Speak English very well295 22.7% Speak English less than very well
English speakers - Born in the United States 90.3% of residents of Manorville speak English at home.
10.8% of residents speak other language at home 69 100.0% Speak English very well
All residents speak only English at home
English speakers - Foreign-born 28.9% of residents of Manorville speak English at home.
4.7% of residents speak Spanish at home 39 72.2% Speak English very well15 27.8% Speak English less than very well63.1% of residents speak other language at home 551 76.1% Speak English very well173 23.9% Speak English less than very well
White (Caucasian) - Speak only English Native:
96.8% (9,227)Foreign-born:
51.2% (185)
White (Caucasian) - Speak another language Native:
3.7% (352)Foreign-born:
55.4% (200)
Black or African American - Speak only English Native:
97.0% (255)Foreign-born:
66.7% (62)
Asian - Speak another language Native:
97.3% (67)Foreign-born:
100.0% (251)
Two or more races - Speak only English Native:
90.1% (588)Foreign-born:
24.6% (65)
Two or more races - Speak another language Native:
10.8% (70)Foreign-born:
73.8% (195)
White alone - Speak only English Native:
95.3% (9,077)Foreign-born:
39.3% (202)
White alone - Speak another language Native:
4.7% (448)Foreign-born:
60.8% (312)
Hispanic or Latino - Speak only English Native:
90.9% (687)Foreign-born:
68.0% (73)
Hispanic or Latino - Speak another language Native:
11.8% (89)Foreign-born:
26.0% (28)
Foreign-born residents in Manorville 1,057 residents are foreign born (3.6% Europe , 3.0% Asia , 1.5% Latin America ).
This city:
8.3%New York:
22.6%
Marital status for residents in Manorville Marital status - White (Caucasian) population 15 years and over
Males 24.6% Never married61.6% Now married0.7% Separated4.7% Widowed8.4% DivorcedFemales 21.4% Never married58.9% Now married0.7% Separated11.0% Widowed7.9% DivorcedWomen who gave birth in the past 12 months Now married:
100.0% (29)Unmarried:
0.0% (0)
Women who did not give birth in the past 12 months Now married:
49.9% (903)Unmarried:
50.1% (907)
Marital status - Black or African American population 15 years and over
Males 43.0% Never married57.0% Now married0.0% Separated0.0% Widowed0.0% DivorcedFemales 42.4% Never married31.7% Now married0.0% Separated15.2% Widowed10.7% DivorcedWomen who did not give birth in the past 12 months Now married:
13.6% (12)Unmarried:
86.4% (75)
Marital status - Asian population 15 years and over
Males 7.4% Never married87.7% Now married0.0% Separated0.0% Widowed4.9% DivorcedFemales 19.7% Never married69.7% Now married0.0% Separated0.0% Widowed10.6% DivorcedWomen who did not give birth in the past 12 months Now married:
50.6% (43)Unmarried:
49.4% (42)
Marital status - Two or more races population 15 years and over
Males 32.1% Never married67.9% Now married0.0% Separated0.0% Widowed0.0% DivorcedFemales 28.5% Never married59.3% Now married0.0% Separated3.1% Widowed9.1% DivorcedWomen who did not give birth in the past 12 months Now married:
51.3% (171)Unmarried:
48.7% (162)
Marital status - White alone, not Hispanic / Latino population 15 years and over
Males 25.3% Never married60.7% Now married0.8% Separated4.9% Widowed8.3% DivorcedFemales 21.1% Never married59.0% Now married0.7% Separated11.1% Widowed8.0% DivorcedWomen who gave birth in the past 12 months Now married:
100.0% (31)Unmarried:
0.0% (0)
Women who did not give birth in the past 12 months Now married:
50.1% (965)Unmarried:
49.9% (960)
Marital status - Hispanic or Latino population 15 years and over
Males 18.5% Never married76.7% Now married0.0% Separated0.0% Widowed4.8% DivorcedFemales 33.0% Never married53.2% Now married0.0% Separated3.5% Widowed10.3% DivorcedWomen who did not give birth in the past 12 months Now married:
42.8% (104)Unmarried:
57.2% (139)
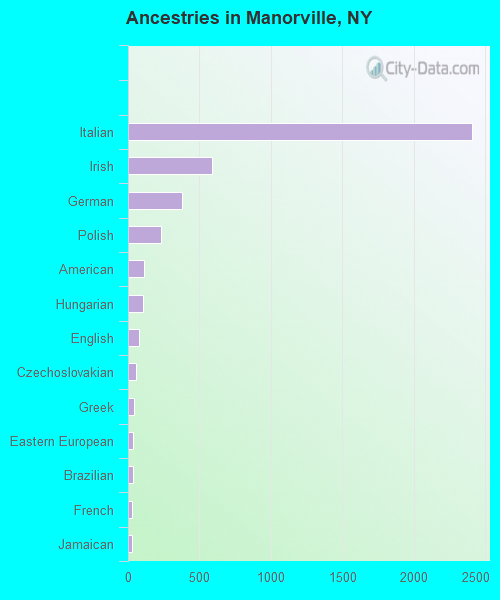
Ancestries in Manorville
2,406 43.3% Italian585 10.5% Irish377 6.8% German232 4.2% Polish114 2.1% American103 1.9% Hungarian76 1.4% English58 1.0% Czechoslovakian45 0.8% Greek38 0.7% Eastern European36 0.6% Brazilian25 0.4% French25 0.4% Jamaican20 0.4% European20 0.4% French Canadian19 0.3% African18 0.3% Austrian16 0.3% Australian15 0.3% Ukrainian14 0.3% Norwegian9 0.2% Scottish7 0.1% Armenian
Children Nativity (place of birth) in Manorville
Children under 6 years - Living with two parents Both parents native 165 100.0% NativeBoth parents foreign-born 62 100.0% NativeOne native, one foreign-born parent 315 100.0% NativeChildren under 6 years - Living with one parent Native parent 72 100.0% Native
Children 6 to 17 years - Living with two parents Both parents native 1,102 100.0% NativeBoth parents foreign-born 106 100.0% NativeOne native, one foreign-born parent 136 100.0% NativeChildren 6 to 17 years - Living with one parent Native parent 302 100.0% Native
Grandparents responsible for own grandchildren in Manorville
Grandparents (30 to 59 years) White / Caucasian 59 100.0% Not responsible for grandchildrenAsian 8 100.0% Not responsible for grandchildrenWhite alone, not Hispanic / Latino 67 100.0% Not responsible for grandchildren
Grandparents (60 years and over) White / Caucasian 49 100.0% Not responsible for grandchildrenWhite alone, not Hispanic / Latino 53 100.0% Not responsible for grandchildren