Races in Manchester, New Hampshire (NH) Detailed Stats
Data:
Races - White alone (%)
Races - White alone (% change since 2000)
Races - Black alone (%)
Races - Black alone (% change since 2000)
Races - American Indian alone (%)
Races - American Indian alone (% change since 2000)
Races - Asian alone (%)
Races - Asian alone (% change since 2000)
Races - Hispanic (%)
Races - Hispanic (% change since 2000)
Races - Native Hawaiian and Other Pacific Islander alone (%)
Races - Native Hawaiian and Other Pacific Islander alone (% change since 2000)
Races - Two or more races(%)
Races - Two or more races(% change since 2000)
Races - Other race alone (%)
Races - Other race alone (% change since 2000)
Racial diversity
Place of birth - Born in state of residence (%)
Place of birth - Born in state of residence (%) - White
Place of birth - Born in state of residence (%) - Black or African American
Place of birth - Born in state of residence (%) - Asian
Place of birth - Born in state of residence (%) - Hispanic or Latino
Place of birth - Born in state of residence (%) - American Indian and Alaska Native
Place of birth - Born in state of residence (%) - Multirace
Place of birth - Born in state of residence (%) - Other Race
Place of birth - Born in other state (%)
Place of birth - Born in other state (%) - White
Place of birth - Born in other state (%) - Black or African American
Place of birth - Born in other state (%) - Asian
Place of birth - Born in other state (%) - Hispanic or Latino
Place of birth - Born in other state (%) - American Indian and Alaska Native
Place of birth - Born in other state (%) - Multirace
Place of birth - Born in other state (%) - Other Race
Place of birth - Native, outside of US (%)
Place of birth - Native, outside of US (%) - White
Place of birth - Native, outside of US (%) - Black or African American
Place of birth - Native, outside of US (%) - Asian
Place of birth - Native, outside of US (%) - Hispanic or Latino
Place of birth - Native, outside of US (%) - American Indian and Alaska Native
Place of birth - Native, outside of US (%) - Multirace
Place of birth - Native, outside of US (%) - Other Race
Place of birth - Foreign born (%)
Place of birth - Foreign born (%) - White
Place of birth - Foreign born (%) - Black or African American
Place of birth - Foreign born (%) - Asian
Place of birth - Foreign born (%) - Hispanic or Latino
Place of birth - Foreign born (%) - American Indian and Alaska Native
Place of birth - Foreign born (%) - Multirace
Place of birth - Foreign born (%) - Other Race
Residents speaking English at home (%)
Residents speaking English at home - Born in the United States (%)
Residents speaking English at home - Native, born elsewhere (%)
Residents speaking English at home - Foreign born (%)
Residents speaking Spanish at home (%)
Residents speaking Spanish at home - Born in the United States (%)
Residents speaking Spanish at home - Native, born elsewhere (%)
Residents speaking Spanish at home - Foreign born (%)
Residents speaking other language at home (%)
Residents speaking other language at home - Born in the United States (%)
Residents speaking other language at home - Native, born elsewhere (%)
Residents speaking other language at home - Foreign born (%)
Marital status - Never married (%)
Marital status - Now married (%)
Marital status - Separated (%)
Marital status - Widowed (%)
Marital status - Divorced (%)
Ancestries Reported - Arab (%)
Ancestries Reported - Czech (%)
Ancestries Reported - Danish (%)
Ancestries Reported - Dutch (%)
Ancestries Reported - English (%)
Ancestries Reported - French (%)
Ancestries Reported - French Canadian (%)
Ancestries Reported - German (%)
Ancestries Reported - Greek (%)
Ancestries Reported - Hungarian (%)
Ancestries Reported - Irish (%)
Ancestries Reported - Italian (%)
Ancestries Reported - Lithuanian (%)
Ancestries Reported - Norwegian (%)
Ancestries Reported - Polish (%)
Ancestries Reported - Portuguese (%)
Ancestries Reported - Russian (%)
Ancestries Reported - Scotch-Irish (%)
Ancestries Reported - Scottish (%)
Ancestries Reported - Slovak (%)
Ancestries Reported - Subsaharan African (%)
Ancestries Reported - Swedish (%)
Ancestries Reported - Swiss (%)
Ancestries Reported - Ukrainian (%)
Ancestries Reported - United States (%)
Ancestries Reported - Welsh (%)
Ancestries Reported - West Indian (%)
Ancestries Reported - Other (%)
Geographical mobility - Same house 1 year ago (%)
Geographical mobility - Same house 1 year ago (%) - White
Geographical mobility - Same house 1 year ago (%) - Black or African American
Geographical mobility - Same house 1 year ago (%) - Asian
Geographical mobility - Same house 1 year ago (%) - Hispanic or Latino
Geographical mobility - Same house 1 year ago (%) - American Indian and Alaska Native
Geographical mobility - Same house 1 year ago (%) - Multirace
Geographical mobility - Same house 1 year ago (%) - Other Race
Geographical mobility - Moved within same county (%)
Geographical mobility - Moved within same county (%) - White
Geographical mobility - Moved within same county (%) - Black or African American
Geographical mobility - Moved within same county (%) - Asian
Geographical mobility - Moved within same county (%) - Hispanic or Latino
Geographical mobility - Moved within same county (%) - American Indian and Alaska Native
Geographical mobility - Moved within same county (%) - Multirace
Geographical mobility - Moved within same county (%) - Other Race
Geographical mobility - Moved from different county within same state (%)
Geographical mobility - Moved from different county within same state (%) - White
Geographical mobility - Moved from different county within same state (%) - Black or African American
Geographical mobility - Moved from different county within same state (%) - Asian
Geographical mobility - Moved from different county within same state (%) - Hispanic or Latino
Geographical mobility - Moved from different county within same state (%) - American Indian and Alaska Native
Geographical mobility - Moved from different county within same state (%) - Multirace
Geographical mobility - Moved from different county within same state (%) - Other Race
Geographical mobility - Moved from different state (%)
Geographical mobility - Moved from different state (%) - White
Geographical mobility - Moved from different state (%) - Black or African American
Geographical mobility - Moved from different state (%) - Asian
Geographical mobility - Moved from different state (%) - Hispanic or Latino
Geographical mobility - Moved from different state (%) - American Indian and Alaska Native
Geographical mobility - Moved from different state (%) - Multirace
Geographical mobility - Moved from different state (%) - Other Race
Geographical mobility - Moved from abroad (%)
Geographical mobility - Moved from abroad (%) - White
Geographical mobility - Moved from abroad (%) - Black or African American
Geographical mobility - Moved from abroad (%) - Asian
Geographical mobility - Moved from abroad (%) - Hispanic or Latino
Geographical mobility - Moved from abroad (%) - American Indian and Alaska Native
Geographical mobility - Moved from abroad (%) - Multirace
Geographical mobility - Moved from abroad (%) - Other Race
Place of birth for the foreign-born population - Ireland (%)
Place of birth for the foreign-born population - Denmark (%)
Place of birth for the foreign-born population - Norway (%)
Place of birth for the foreign-born population - Sweden (%)
Place of birth for the foreign-born population - United Kingdom (%)
Place of birth for the foreign-born population - England (%)
Place of birth for the foreign-born population - Scotland (%)
Place of birth for the foreign-born population - Other Northern Europe (%)
Place of birth for the foreign-born population - Austria (%)
Place of birth for the foreign-born population - Belgium (%)
Place of birth for the foreign-born population - France (%)
Place of birth for the foreign-born population - Germany (%)
Place of birth for the foreign-born population - Netherlands (%)
Place of birth for the foreign-born population - Switzerland (%)
Place of birth for the foreign-born population - Other Western Europe (%)
Place of birth for the foreign-born population - Greece (%)
Place of birth for the foreign-born population - Italy (%)
Place of birth for the foreign-born population - Portugal (%)
Place of birth for the foreign-born population - Spain (%)
Place of birth for the foreign-born population - Other Southern Europe (%)
Place of birth for the foreign-born population - Albania (%)
Place of birth for the foreign-born population - Belarus (%)
Place of birth for the foreign-born population - Bosnia and Herzegovina (%)
Place of birth for the foreign-born population - Bulgaria (%)
Place of birth for the foreign-born population - Croatia (%)
Place of birth for the foreign-born population - Czechoslovakia (%)
Place of birth for the foreign-born population - Hungary (%)
Place of birth for the foreign-born population - Latvia (%)
Place of birth for the foreign-born population - Lithuania (%)
Place of birth for the foreign-born population - North Macedonia (Macedonia) (%)
Place of birth for the foreign-born population - Moldova (%)
Place of birth for the foreign-born population - Poland (%)
Place of birth for the foreign-born population - Romania (%)
Place of birth for the foreign-born population - Russia (%)
Place of birth for the foreign-born population - Serbia (%)
Place of birth for the foreign-born population - Ukraine (%)
Place of birth for the foreign-born population - Other Eastern Europe (%)
Place of birth for the foreign-born population - China (%)
Place of birth for the foreign-born population - Hong Kong (%)
Place of birth for the foreign-born population - Taiwan (%)
Place of birth for the foreign-born population - Japan (%)
Place of birth for the foreign-born population - Korea (%)
Place of birth for the foreign-born population - Other Eastern Asia (%)
Place of birth for the foreign-born population - Afghanistan (%)
Place of birth for the foreign-born population - Bangladesh (%)
Place of birth for the foreign-born population - India (%)
Place of birth for the foreign-born population - Iran (%)
Place of birth for the foreign-born population - Kazakhstan (%)
Place of birth for the foreign-born population - Nepal (%)
Place of birth for the foreign-born population - Pakistan (%)
Place of birth for the foreign-born population - Sri Lanka (%)
Place of birth for the foreign-born population - Uzbekistan (%)
Place of birth for the foreign-born population - Other South Central Asia (%)
Place of birth for the foreign-born population - Burma (%)
Place of birth for the foreign-born population - Cambodia (%)
Place of birth for the foreign-born population - Indonesia (%)
Place of birth for the foreign-born population - Laos (%)
Place of birth for the foreign-born population - Malaysia (%)
Place of birth for the foreign-born population - Philippines (%)
Place of birth for the foreign-born population - Singapore (%)
Place of birth for the foreign-born population - Thailand (%)
Place of birth for the foreign-born population - Vietnam (%)
Place of birth for the foreign-born population - Other South Eastern Asia (%)
Place of birth for the foreign-born population - Armenia (%)
Place of birth for the foreign-born population - Iraq (%)
Place of birth for the foreign-born population - Israel (%)
Place of birth for the foreign-born population - Jordan (%)
Place of birth for the foreign-born population - Kuwait (%)
Place of birth for the foreign-born population - Lebanon (%)
Place of birth for the foreign-born population - Saudi Arabia (%)
Place of birth for the foreign-born population - Syria (%)
Place of birth for the foreign-born population - Turkey (%)
Place of birth for the foreign-born population - Yemen (%)
Place of birth for the foreign-born population - Other Western Asia (%)
Place of birth for the foreign-born population - Eritrea (%)
Place of birth for the foreign-born population - Ethiopia (%)
Place of birth for the foreign-born population - Kenya (%)
Place of birth for the foreign-born population - Somalia (%)
Place of birth for the foreign-born population - Uganda (%)
Place of birth for the foreign-born population - Zimbabwe (%)
Place of birth for the foreign-born population - Other Eastern Africa (%)
Place of birth for the foreign-born population - Cameroon (%)
Place of birth for the foreign-born population - Congo (%)
Place of birth for the foreign-born population - Democratic Republic of Congo (Zaire) (%)
Place of birth for the foreign-born population - Other Middle Africa (%)
Place of birth for the foreign-born population - Egypt (%)
Place of birth for the foreign-born population - Morocco (%)
Place of birth for the foreign-born population - Sudan (%)
Place of birth for the foreign-born population - Other Northern Africa (%)
Place of birth for the foreign-born population - South Africa (%)
Place of birth for the foreign-born population - Other Southern Africa (%)
Place of birth for the foreign-born population - Cabo Verde (%)
Place of birth for the foreign-born population - Ghana (%)
Place of birth for the foreign-born population - Liberia (%)
Place of birth for the foreign-born population - Nigeria (%)
Place of birth for the foreign-born population - Senegal (%)
Place of birth for the foreign-born population - Sierra Leone (%)
Place of birth for the foreign-born population - Other Western Africa (%)
Place of birth for the foreign-born population - Australia (%)
Place of birth for the foreign-born population - New Zealand (%)
Place of birth for the foreign-born population - Fiji (%)
Place of birth for the foreign-born population - Micronesia (%)
Place of birth for the foreign-born population - Bahamas (%)
Place of birth for the foreign-born population - Barbados (%)
Place of birth for the foreign-born population - Cuba (%)
Place of birth for the foreign-born population - Dominica (%)
Place of birth for the foreign-born population - Dominican Republic (%)
Place of birth for the foreign-born population - Grenada (%)
Place of birth for the foreign-born population - Haiti (%)
Place of birth for the foreign-born population - Jamaica (%)
Place of birth for the foreign-born population - St. Vincent and the Grenadines (%)
Place of birth for the foreign-born population - Trinidad and Tobago (%)
Place of birth for the foreign-born population - West Indies (%)
Place of birth for the foreign-born population - Other Caribbean (%)
Place of birth for the foreign-born population - Belize (%)
Place of birth for the foreign-born population - Costa Rica (%)
Place of birth for the foreign-born population - El Salvador (%)
Place of birth for the foreign-born population - Guatemala (%)
Place of birth for the foreign-born population - Honduras (%)
Place of birth for the foreign-born population - Mexico (%)
Place of birth for the foreign-born population - Nicaragua (%)
Place of birth for the foreign-born population - Panama (%)
Place of birth for the foreign-born population - Other Central America (%)
Place of birth for the foreign-born population - Argentina (%)
Place of birth for the foreign-born population - Bolivia (%)
Place of birth for the foreign-born population - Brazil (%)
Place of birth for the foreign-born population - Chile (%)
Place of birth for the foreign-born population - Colombia (%)
Place of birth for the foreign-born population - Ecuador (%)
Place of birth for the foreign-born population - Guyana (%)
Place of birth for the foreign-born population - Peru (%)
Place of birth for the foreign-born population - Uruguay (%)
Place of birth for the foreign-born population - Venezuela (%)
Place of birth for the foreign-born population - Other South America (%)
Place of birth for the foreign-born population - Canada (%)
Place of birth for the foreign-born population - Other Northern America (%)
Place of birth for the foreign-born population - Other (%)
Latest news about races in Manchester, NH collected exclusively by city-data.com from local newspapers, TV, and radio stations
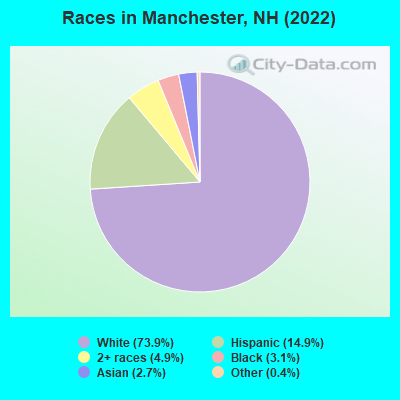
According to 2022 data, the most numerous races in Manchester, NH are White alone (85,119 residents), Hispanic (17,147 residents), and Two or more races (5,699 residents). 80.8% of Manchester residents speak English at home. 15.1% of Manchester, NH residents are foreign-born (5.3% born in Latin America, 4.2% born in Asia, 2.5% born in Europe, 1.9% born in Africa), which is 66.9% greater than the foreign-born rate of 5.0% across the entire state of New Hampshire.
Race distribution in Manchester
2000 2022
95,581 89.3% White alone 4,944 4.6% Hispanic 2,470 2.3% Asian alone 2,045 1.9% Black alone 1,503 1.4% Two or more races 287 0.3% American Indian alone 145 0.1% Other race alone 31 0.03% Native Hawaiian and Other
85,119 73.9% White alone 17,147 14.9% Hispanic 5,699 4.9% Two or more races 3,536 3.1% Black alone 3,088 2.7% Asian alone 448 0.4% Other race alone 104 0.09% American Indian alone
2000 2022
1,175,252 95.1% White alone 20,489 1.7% Hispanic 15,803 1.3% Asian alone 11,606 0.9% Two or more races 8,354 0.7% Black alone 2,698 0.2% American Indian alone 1,254 0.1% Other race alone 330 0.03% Native Hawaiian and Other
1,208,101 86.6% White alone 63,479 4.5% Hispanic 60,724 4.4% Two or more races 36,519 2.6% Asian alone 17,931 1.3% Black alone 6,615 0.5% Other race alone 1,014 0.07% American Indian alone 848 0.06% Native Hawaiian and Other
Income and house value in Manchester Median household income in 2022 $77,929 White non-Hispanic householders$55,655 Black householders$56,167 Asian householders$63,043 Some other race householders$55,685 Two or more races householders$63,669 Hispanic or Latino race householdersMedian 2022 house value $352,963 White Non-Hispanic householders$350,491 Black or African American householders$484,938 American Indian or Alaska Native householders $396,852 Asian householders$347,709 Native Hawaiian and other Pacific Islander householders$407,669 Some other race householders$352,654 Two or more races householders$323,292 Hispanic or Latino householders
Median age by race in Manchester
41.7 Median age for White residents41.1 42.0 40.3 Median age for Black or African American residents41.5 36.8 57.0 Median age for American Indian / Alaska Native residents57.4 -666,666,666.0 33.5 Median age for Asian residents31.7 34.5 -666,666,666.0 Median age for Native Hawaiian / Pacific Islander residents-666,666,666.0 -666,666,666.0 27.4 Median age for Other race residents34.3 25.9 19.3 Median age for Two or more races residents17.0 27.9 42.4 Median age for White alone residents41.9 43.0 23.3 Median age for Hispanic or Latino residents19.5 25.9
Owner/renter occupied households by race in Manchester
House owners and renters - White residents 23,018 57.5% Owner occupied16,982 42.5% Renter occupiedHouse owners and renters - Black or African American residents 649 26.3% Owner occupied1,820 73.7% Renter occupiedHouse owners and renters - American Indian / Alaska Native residents 7 9.2% Owner occupied69 90.8% Renter occupiedHouse owners and renters - Asian residents 461 37.9% Owner occupied754 62.1% Renter occupiedHouse owners and renters - Native Hawaiian / Pacific Islander residents 10 100.0% Renter occupiedHouse owners and renters - Other race residents 716 32.1% Owner occupied1,516 67.9% Renter occupiedHouse owners and renters - Two or more races residents 584 21.4% Owner occupied2,142 78.6% Renter occupiedHouse owners and renters - White alone residents 22,675 57.3% Owner occupied16,924 42.7% Renter occupiedHouse owners and renters - Hispanic or Latino residents 1,193 28.1% Owner occupied3,058 71.9% Renter occupied
Language usage in Manchester
English speakers - Total 80.8% of residents of Manchester speak English at home.
10.3% of residents speak Spanish at home 5,927 52.8% Speak English very well5,300 47.2% Speak English less than very well8.9% of residents speak other language at home 6,082 62.4% Speak English very well3,657 37.6% Speak English less than very well
English speakers - Born in the United States 94.2% of residents of Manchester speak English at home.
4.8% of residents speak Spanish at home 1,825 86.4% Speak English very well287 13.6% Speak English less than very well1.1% of residents speak other language at home 483 99.2% Speak English very well4 0.8% Speak English less than very well
English speakers - Native, born elsewhere 52.4% of residents of Manchester speak English at home.
29.6% of residents speak Spanish at home 205 45.8% Speak English very well243 54.2% Speak English less than very well18.1% of residents speak other language at home 156 56.9% Speak English very well118 43.1% Speak English less than very well
English speakers - Foreign-born 13.3% of residents of Manchester speak English at home.
44.9% of residents speak Spanish at home 2,234 34.3% Speak English very well4,283 65.7% Speak English less than very well41.8% of residents speak other language at home 2,959 48.8% Speak English very well3,100 51.2% Speak English less than very well
White (Caucasian) - Speak only English Native:
95.5% (75,639)Foreign-born:
21.6% (948)
White (Caucasian) - Speak another language Native:
4.5% (3,582)Foreign-born:
78.4% (3,439)
Black or African American - Speak only English Native:
89.3% (2,101)Foreign-born:
47.8% (1,636)
Black or African American - Speak another language Native:
16.4% (386)Foreign-born:
47.5% (1,624)
American Indian / Alaska Native - Speak another language Native:
47.0% (73)Foreign-born:
100.0% (79)
Asian - Speak only English Native:
52.4% (650)Foreign-born:
15.9% (707)
Asian - Speak another language Native:
48.0% (595)Foreign-born:
82.8% (3,692)
Native Hawaiian / Pacific Islander - Speak only English Native:
99.5% (50)Foreign-born:
96.3% (8)
Other race - Speak another language Native:
65.0% (2,217)Foreign-born:
100.0% (3,842)
Two or more races - Speak another language Native:
22.6% (2,242)Foreign-born:
100.0% (1,647)
White alone - Speak only English Native:
95.8% (75,148)Foreign-born:
28.7% (948)
White alone - Speak another language Native:
4.2% (3,313)Foreign-born:
71.3% (2,359)
Hispanic or Latino - Speak another language Native:
45.1% (4,077)Foreign-born:
100.0% (6,234)
Foreign-born residents in Manchester 17,530 residents are foreign born (5.3% Latin America , 4.2% Asia , 2.5% Europe , 1.9% Africa ).
This city:
15.1%New Hampshire:
6.0%
Marital status for residents in Manchester Marital status - White (Caucasian) population 15 years and over
Males 37.5% Never married43.1% Now married1.0% Separated3.6% Widowed14.7% DivorcedFemales 32.1% Never married42.0% Now married0.7% Separated9.6% Widowed15.6% DivorcedWomen who gave birth in the past 12 months Now married:
70.3% (1,013)Unmarried:
29.7% (428)
Women who did not give birth in the past 12 months Now married:
38.7% (7,941)Unmarried:
61.3% (12,565)
Marital status - Black or African American population 15 years and over
Males 48.4% Never married37.4% Now married4.8% Separated0.0% Widowed9.3% DivorcedFemales 41.7% Never married33.6% Now married6.1% Separated9.6% Widowed8.9% DivorcedWomen who gave birth in the past 12 months Now married:
57.6% (52)Unmarried:
42.4% (38)
Women who did not give birth in the past 12 months Now married:
33.3% (461)Unmarried:
66.7% (924)
Marital status - American Indian / Alaska Native population 15 years and over
Males 9.3% Never married90.7% Now married0.0% Separated0.0% Widowed0.0% DivorcedFemales 45.3% Never married50.0% Now married0.0% Separated0.0% Widowed4.7% DivorcedWomen who did not give birth in the past 12 months Now married:
52.5% (38)Unmarried:
47.5% (34)
Marital status - Asian population 15 years and over
Males 44.2% Never married53.0% Now married1.3% Separated0.0% Widowed1.5% DivorcedFemales 20.6% Never married46.8% Now married0.7% Separated7.3% Widowed24.7% DivorcedWomen who gave birth in the past 12 months Now married:
73.7% (87)Unmarried:
26.3% (31)
Women who did not give birth in the past 12 months Now married:
40.7% (762)Unmarried:
59.3% (1,108)
Marital status - Other race population 15 years and over
Males 43.8% Never married34.1% Now married13.2% Separated0.0% Widowed8.8% DivorcedFemales 36.7% Never married41.2% Now married5.9% Separated1.9% Widowed14.3% DivorcedWomen who gave birth in the past 12 months Now married:
34.6% (32)Unmarried:
65.4% (61)
Women who did not give birth in the past 12 months Now married:
43.0% (735)Unmarried:
57.0% (973)
Marital status - Two or more races population 15 years and over
Males 76.1% Never married18.2% Now married0.0% Separated2.6% Widowed3.1% DivorcedFemales 38.9% Never married33.7% Now married11.5% Separated2.9% Widowed13.0% DivorcedWomen who gave birth in the past 12 months Now married:
50.0% (39)Unmarried:
50.0% (39)
Women who did not give birth in the past 12 months Now married:
18.6% (711)Unmarried:
81.4% (3,120)
Marital status - White alone, not Hispanic / Latino population 15 years and over
Males 37.7% Never married43.2% Now married1.0% Separated3.7% Widowed14.4% DivorcedFemales 31.0% Never married42.7% Now married0.3% Separated9.9% Widowed16.2% DivorcedWomen who gave birth in the past 12 months Now married:
70.3% (1,013)Unmarried:
29.7% (428)
Women who did not give birth in the past 12 months Now married:
39.5% (7,672)Unmarried:
60.5% (11,755)
Marital status - Hispanic or Latino population 15 years and over
Males 58.8% Never married35.3% Now married1.3% Separated0.0% Widowed4.6% DivorcedFemales 60.7% Never married23.9% Now married10.7% Separated1.6% Widowed3.1% DivorcedWomen who gave birth in the past 12 months Now married:
45.7% (99)Unmarried:
54.3% (118)
Women who did not give birth in the past 12 months Now married:
31.7% (1,449)Unmarried:
68.3% (3,128)
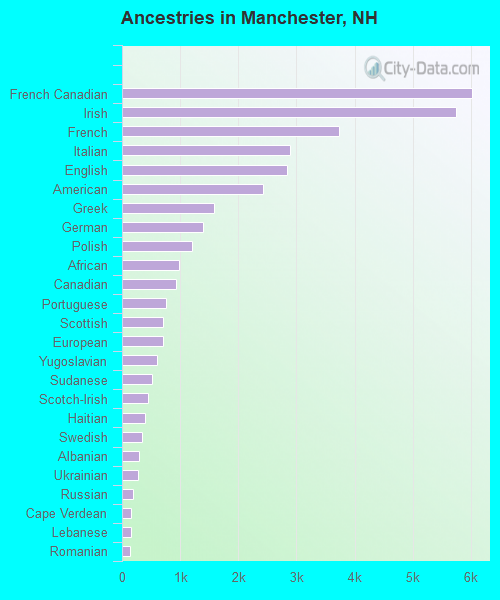
Ancestries in Manchester
6,012 10.9% French Canadian5,743 10.4% Irish3,729 6.7% French2,887 5.2% Italian2,830 5.1% English2,420 4.4% American1,576 2.8% Greek1,400 2.5% German1,211 2.2% Polish972 1.8% African931 1.7% Canadian760 1.4% Portuguese706 1.3% Scottish701 1.3% European598 1.1% Yugoslavian511 0.9% Sudanese448 0.8% Scotch-Irish393 0.7% Haitian342 0.6% Swedish301 0.5% Albanian279 0.5% Ukrainian192 0.3% Russian162 0.3% Cape Verdean156 0.3% Lebanese144 0.3% Romanian137 0.2% Brazilian136 0.2% West Indian132 0.2% Eastern European126 0.2% Turkish123 0.2% Somali121 0.2% Jordanian117 0.2% Norwegian114 0.2% Welsh103 0.2% Jamaican101 0.2% Iraqi93 0.2% British83 0.1% Afghan75 0.1% Finnish74 0.1% Zimbabwean58 0.1% Hungarian57 0.1% Armenian55 0.10% Northern European54 0.10% Lithuanian53 0.10% Scandinavian52 0.09% Kenyan51 0.09% Liberian49 0.09% Egyptian48 0.09% Iranian45 0.08% Serbian43 0.08% Bulgarian23 0.04% Guyanese22 0.04% British West Indian21 0.04% Slavic19 0.03% Slovak18 0.03% Belgian17 0.03% Danish17 0.03% Swiss17 0.03% Barbadian13 0.02% Latvian12 0.02% Maltese11 0.02% Dutch10 0.02% Czechoslovakian9 0.02% Nigerian9 0.02% Slovene5 0.01% Croatian
Geographical mobility in Manchester Same house 1 year ago 75,889 87.6% White (Caucasian)5,132 88.8% Black or African American260 97.9% American Indian / Alaska Native4,949 84.1% Asian40 69.3% Native Hawaiian / Pacific Islander4,800 81.3% Other race10,213 83.6% Two or more races73,431 87.3% White alone, not Hispanic / Latino13,167 86.3% Hispanic or LatinoMoved within same county 5,929 6.8% White / Caucasian417 7.2% Black or African American8 3.2% American Indian / Alaska Native496 8.4% Asian8 14.0% Native Hawaiian / Pacific Islander262 4.4% Other race789 6.5% Two or more races5,856 7.0% White alone, not Hispanic / Latino510 3.3% Hispanic or LatinoMoved within same state 2,192 2.5% White / Caucasian9 0.2% Black or African American100 1.7% Asian234 4.0% Other race576 4.7% Two or more races2,188 2.6% White alone, not Hispanic / Latino494 3.2% Hispanic or LatinoMoved from different state 2,548 2.9% White / Caucasian220 3.8% Black or African American9 0.2% Asian10 16.6% Native Hawaiian / Pacific Islander441 7.5% Other race645 5.3% Two or more races2,548 3.0% White alone, not Hispanic / Latino915 6.0% Hispanic or LatinoMoved from abroad 122 0.1% White23 0.4% Black or African American163 2.8% Asian206 3.5% Other race122 0.1% White alone, not Hispanic / Latino457 3.0% Hispanic or Latino
Children Nativity (place of birth) in Manchester
Children under 6 years - Living with two parents Both parents native 2,153 100.0% NativeBoth parents foreign-born 712 100.0% NativeChildren under 6 years - Living with one parent Native parent 2,714 100.0% NativeForeign-born parent 531 100.0% NativeChildren 6 to 17 years - Living with two parents Both parents native 5,557 100.0% NativeBoth parents foreign-born 472 100.0% NativeOne native, one foreign-born parent 54 100.0% NativeChildren 6 to 17 years - Living with one parent Native parent 4,756 100.0% NativeForeign-born parent 1,696 57.6% Native1,248 42.4% Foreign-born
Place of birth for residents in Manchester 7,338 Americas6,220 Latin America4,967 Asia2,946 Europe2,853 Central America2,367 South Central Asia2,277 Africa2,232 Caribbean1,867 Eastern Europe1,426 South Eastern Asia1,134 South America1,117 Northern America833 Eastern Africa726 Eastern Asia511 Northern Europe500 Middle Africa470 China440 Western Asia385 Northern Africa331 Western Africa312 Southern Europe254 Western Europe1,472 Dominican Republic1,117 Canada921 Nepal898 Vietnam881 Honduras720 India588 Bosnia and Herzegovina559 El Salvador534 Guatemala530 Mexico527 Brazil476 Bhutan391 Democratic Republic of Congo (Zaire)367 Haiti362 China361 Colombia301 Nicaragua276 Philippines255 Albania226 Korea201 Poland199 Germany180 Liberia178 Ukraine176 United Kingdom167 Jamaica156 Portugal154 Kenya154 Peru151 Jordan141 Ireland140 Romania140 Egypt124 Sudan116 Croatia114 Greece108 England106 Iraq97 Morocco96 Nigeria86 Taiwan86 Lebanon79 Laos76 Indonesia67 Uzbekistan66 Scotland65 Russia63 Somalia55 Congo53 Zimbabwe52 Afghanistan52 Uganda46 Iran45 Panama44 Bulgaria41 Italy41 Ghana40 Thailand40 Saudi Arabia40 Venezuela39 Malaysia36 Netherlands34 Bangladesh33 Cuba30 Pakistan29 Japan27 Dominica26 St. Lucia26 Guyana24 Hungary24 Serbia22 Tanzania21 Hong Kong18 Lithuania17 Czechoslovakia16 Georgia15 Yemen15 Cambodia12 Senegal10 Turkey10 France9 Ecuador9 Uruguay8 Austria7 Belarus7 Cameroon6 Argentina1 Armenia
Grandparents responsible for own grandchildren in Manchester
Grandparents (30 to 59 years) White / Caucasian 185 37.3% Responsible for grandchildren312 62.7% Not responsible for grandchildrenBlack or African American 37 100.0% Not responsible for grandchildrenAsian 89 100.0% Responsible for grandchildrenOther race 10 100.0% Not responsible for grandchildrenTwo or more races 137 94.1% Responsible for grandchildren9 5.9% Not responsible for grandchildrenWhite alone, not Hispanic / Latino 165 43.0% Responsible for grandchildren220 57.0% Not responsible for grandchildrenHispanic or Latino 104 49.6% Responsible for grandchildren106 50.4% Not responsible for grandchildrenGrandparents (60 years and over) White / Caucasian 277 48.0% Responsible for grandchildren300 52.0% Not responsible for grandchildrenBlack or African American 57 33.3% Responsible for grandchildren113 66.7% Not responsible for grandchildrenAsian 75 34.9% Responsible for grandchildren140 65.1% Not responsible for grandchildrenOther race 16 29.6% Responsible for grandchildren39 70.4% Not responsible for grandchildrenTwo or more races 47 100.0% Not responsible for grandchildrenWhite alone, not Hispanic / Latino 277 50.5% Responsible for grandchildren272 49.5% Not responsible for grandchildrenHispanic or Latino 15 12.1% Responsible for grandchildren110 87.9% Not responsible for grandchildren