Races in Makakilo, Hawaii (HI) Detailed Stats
Data:
Races - White alone (%)
Races - White alone (% change since 2000)
Races - Black alone (%)
Races - Black alone (% change since 2000)
Races - American Indian alone (%)
Races - American Indian alone (% change since 2000)
Races - Asian alone (%)
Races - Asian alone (% change since 2000)
Races - Hispanic (%)
Races - Hispanic (% change since 2000)
Races - Native Hawaiian and Other Pacific Islander alone (%)
Races - Native Hawaiian and Other Pacific Islander alone (% change since 2000)
Races - Two or more races(%)
Races - Two or more races(% change since 2000)
Races - Other race alone (%)
Races - Other race alone (% change since 2000)
Racial diversity
Place of birth - Born in state of residence (%)
Place of birth - Born in state of residence (%) - White
Place of birth - Born in state of residence (%) - Black or African American
Place of birth - Born in state of residence (%) - Asian
Place of birth - Born in state of residence (%) - Hispanic or Latino
Place of birth - Born in state of residence (%) - American Indian and Alaska Native
Place of birth - Born in state of residence (%) - Multirace
Place of birth - Born in state of residence (%) - Other Race
Place of birth - Born in other state (%)
Place of birth - Born in other state (%) - White
Place of birth - Born in other state (%) - Black or African American
Place of birth - Born in other state (%) - Asian
Place of birth - Born in other state (%) - Hispanic or Latino
Place of birth - Born in other state (%) - American Indian and Alaska Native
Place of birth - Born in other state (%) - Multirace
Place of birth - Born in other state (%) - Other Race
Place of birth - Native, outside of US (%)
Place of birth - Native, outside of US (%) - White
Place of birth - Native, outside of US (%) - Black or African American
Place of birth - Native, outside of US (%) - Asian
Place of birth - Native, outside of US (%) - Hispanic or Latino
Place of birth - Native, outside of US (%) - American Indian and Alaska Native
Place of birth - Native, outside of US (%) - Multirace
Place of birth - Native, outside of US (%) - Other Race
Place of birth - Foreign born (%)
Place of birth - Foreign born (%) - White
Place of birth - Foreign born (%) - Black or African American
Place of birth - Foreign born (%) - Asian
Place of birth - Foreign born (%) - Hispanic or Latino
Place of birth - Foreign born (%) - American Indian and Alaska Native
Place of birth - Foreign born (%) - Multirace
Place of birth - Foreign born (%) - Other Race
Residents speaking English at home (%)
Residents speaking English at home - Born in the United States (%)
Residents speaking English at home - Native, born elsewhere (%)
Residents speaking English at home - Foreign born (%)
Residents speaking Spanish at home (%)
Residents speaking Spanish at home - Born in the United States (%)
Residents speaking Spanish at home - Native, born elsewhere (%)
Residents speaking Spanish at home - Foreign born (%)
Residents speaking other language at home (%)
Residents speaking other language at home - Born in the United States (%)
Residents speaking other language at home - Native, born elsewhere (%)
Residents speaking other language at home - Foreign born (%)
Marital status - Never married (%)
Marital status - Now married (%)
Marital status - Separated (%)
Marital status - Widowed (%)
Marital status - Divorced (%)
Ancestries Reported - Arab (%)
Ancestries Reported - Czech (%)
Ancestries Reported - Danish (%)
Ancestries Reported - Dutch (%)
Ancestries Reported - English (%)
Ancestries Reported - French (%)
Ancestries Reported - French Canadian (%)
Ancestries Reported - German (%)
Ancestries Reported - Greek (%)
Ancestries Reported - Hungarian (%)
Ancestries Reported - Irish (%)
Ancestries Reported - Italian (%)
Ancestries Reported - Lithuanian (%)
Ancestries Reported - Norwegian (%)
Ancestries Reported - Polish (%)
Ancestries Reported - Portuguese (%)
Ancestries Reported - Russian (%)
Ancestries Reported - Scotch-Irish (%)
Ancestries Reported - Scottish (%)
Ancestries Reported - Slovak (%)
Ancestries Reported - Subsaharan African (%)
Ancestries Reported - Swedish (%)
Ancestries Reported - Swiss (%)
Ancestries Reported - Ukrainian (%)
Ancestries Reported - United States (%)
Ancestries Reported - Welsh (%)
Ancestries Reported - West Indian (%)
Ancestries Reported - Other (%)
Geographical mobility - Same house 1 year ago (%)
Geographical mobility - Same house 1 year ago (%) - White
Geographical mobility - Same house 1 year ago (%) - Black or African American
Geographical mobility - Same house 1 year ago (%) - Asian
Geographical mobility - Same house 1 year ago (%) - Hispanic or Latino
Geographical mobility - Same house 1 year ago (%) - American Indian and Alaska Native
Geographical mobility - Same house 1 year ago (%) - Multirace
Geographical mobility - Same house 1 year ago (%) - Other Race
Geographical mobility - Moved within same county (%)
Geographical mobility - Moved within same county (%) - White
Geographical mobility - Moved within same county (%) - Black or African American
Geographical mobility - Moved within same county (%) - Asian
Geographical mobility - Moved within same county (%) - Hispanic or Latino
Geographical mobility - Moved within same county (%) - American Indian and Alaska Native
Geographical mobility - Moved within same county (%) - Multirace
Geographical mobility - Moved within same county (%) - Other Race
Geographical mobility - Moved from different county within same state (%)
Geographical mobility - Moved from different county within same state (%) - White
Geographical mobility - Moved from different county within same state (%) - Black or African American
Geographical mobility - Moved from different county within same state (%) - Asian
Geographical mobility - Moved from different county within same state (%) - Hispanic or Latino
Geographical mobility - Moved from different county within same state (%) - American Indian and Alaska Native
Geographical mobility - Moved from different county within same state (%) - Multirace
Geographical mobility - Moved from different county within same state (%) - Other Race
Geographical mobility - Moved from different state (%)
Geographical mobility - Moved from different state (%) - White
Geographical mobility - Moved from different state (%) - Black or African American
Geographical mobility - Moved from different state (%) - Asian
Geographical mobility - Moved from different state (%) - Hispanic or Latino
Geographical mobility - Moved from different state (%) - American Indian and Alaska Native
Geographical mobility - Moved from different state (%) - Multirace
Geographical mobility - Moved from different state (%) - Other Race
Geographical mobility - Moved from abroad (%)
Geographical mobility - Moved from abroad (%) - White
Geographical mobility - Moved from abroad (%) - Black or African American
Geographical mobility - Moved from abroad (%) - Asian
Geographical mobility - Moved from abroad (%) - Hispanic or Latino
Geographical mobility - Moved from abroad (%) - American Indian and Alaska Native
Geographical mobility - Moved from abroad (%) - Multirace
Geographical mobility - Moved from abroad (%) - Other Race
Place of birth for the foreign-born population - Ireland (%)
Place of birth for the foreign-born population - Denmark (%)
Place of birth for the foreign-born population - Norway (%)
Place of birth for the foreign-born population - Sweden (%)
Place of birth for the foreign-born population - United Kingdom (%)
Place of birth for the foreign-born population - England (%)
Place of birth for the foreign-born population - Scotland (%)
Place of birth for the foreign-born population - Other Northern Europe (%)
Place of birth for the foreign-born population - Austria (%)
Place of birth for the foreign-born population - Belgium (%)
Place of birth for the foreign-born population - France (%)
Place of birth for the foreign-born population - Germany (%)
Place of birth for the foreign-born population - Netherlands (%)
Place of birth for the foreign-born population - Switzerland (%)
Place of birth for the foreign-born population - Other Western Europe (%)
Place of birth for the foreign-born population - Greece (%)
Place of birth for the foreign-born population - Italy (%)
Place of birth for the foreign-born population - Portugal (%)
Place of birth for the foreign-born population - Spain (%)
Place of birth for the foreign-born population - Other Southern Europe (%)
Place of birth for the foreign-born population - Albania (%)
Place of birth for the foreign-born population - Belarus (%)
Place of birth for the foreign-born population - Bosnia and Herzegovina (%)
Place of birth for the foreign-born population - Bulgaria (%)
Place of birth for the foreign-born population - Croatia (%)
Place of birth for the foreign-born population - Czechoslovakia (%)
Place of birth for the foreign-born population - Hungary (%)
Place of birth for the foreign-born population - Latvia (%)
Place of birth for the foreign-born population - Lithuania (%)
Place of birth for the foreign-born population - North Macedonia (Macedonia) (%)
Place of birth for the foreign-born population - Moldova (%)
Place of birth for the foreign-born population - Poland (%)
Place of birth for the foreign-born population - Romania (%)
Place of birth for the foreign-born population - Russia (%)
Place of birth for the foreign-born population - Serbia (%)
Place of birth for the foreign-born population - Ukraine (%)
Place of birth for the foreign-born population - Other Eastern Europe (%)
Place of birth for the foreign-born population - China (%)
Place of birth for the foreign-born population - Hong Kong (%)
Place of birth for the foreign-born population - Taiwan (%)
Place of birth for the foreign-born population - Japan (%)
Place of birth for the foreign-born population - Korea (%)
Place of birth for the foreign-born population - Other Eastern Asia (%)
Place of birth for the foreign-born population - Afghanistan (%)
Place of birth for the foreign-born population - Bangladesh (%)
Place of birth for the foreign-born population - India (%)
Place of birth for the foreign-born population - Iran (%)
Place of birth for the foreign-born population - Kazakhstan (%)
Place of birth for the foreign-born population - Nepal (%)
Place of birth for the foreign-born population - Pakistan (%)
Place of birth for the foreign-born population - Sri Lanka (%)
Place of birth for the foreign-born population - Uzbekistan (%)
Place of birth for the foreign-born population - Other South Central Asia (%)
Place of birth for the foreign-born population - Burma (%)
Place of birth for the foreign-born population - Cambodia (%)
Place of birth for the foreign-born population - Indonesia (%)
Place of birth for the foreign-born population - Laos (%)
Place of birth for the foreign-born population - Malaysia (%)
Place of birth for the foreign-born population - Philippines (%)
Place of birth for the foreign-born population - Singapore (%)
Place of birth for the foreign-born population - Thailand (%)
Place of birth for the foreign-born population - Vietnam (%)
Place of birth for the foreign-born population - Other South Eastern Asia (%)
Place of birth for the foreign-born population - Armenia (%)
Place of birth for the foreign-born population - Iraq (%)
Place of birth for the foreign-born population - Israel (%)
Place of birth for the foreign-born population - Jordan (%)
Place of birth for the foreign-born population - Kuwait (%)
Place of birth for the foreign-born population - Lebanon (%)
Place of birth for the foreign-born population - Saudi Arabia (%)
Place of birth for the foreign-born population - Syria (%)
Place of birth for the foreign-born population - Turkey (%)
Place of birth for the foreign-born population - Yemen (%)
Place of birth for the foreign-born population - Other Western Asia (%)
Place of birth for the foreign-born population - Eritrea (%)
Place of birth for the foreign-born population - Ethiopia (%)
Place of birth for the foreign-born population - Kenya (%)
Place of birth for the foreign-born population - Somalia (%)
Place of birth for the foreign-born population - Uganda (%)
Place of birth for the foreign-born population - Zimbabwe (%)
Place of birth for the foreign-born population - Other Eastern Africa (%)
Place of birth for the foreign-born population - Cameroon (%)
Place of birth for the foreign-born population - Congo (%)
Place of birth for the foreign-born population - Democratic Republic of Congo (Zaire) (%)
Place of birth for the foreign-born population - Other Middle Africa (%)
Place of birth for the foreign-born population - Egypt (%)
Place of birth for the foreign-born population - Morocco (%)
Place of birth for the foreign-born population - Sudan (%)
Place of birth for the foreign-born population - Other Northern Africa (%)
Place of birth for the foreign-born population - South Africa (%)
Place of birth for the foreign-born population - Other Southern Africa (%)
Place of birth for the foreign-born population - Cabo Verde (%)
Place of birth for the foreign-born population - Ghana (%)
Place of birth for the foreign-born population - Liberia (%)
Place of birth for the foreign-born population - Nigeria (%)
Place of birth for the foreign-born population - Senegal (%)
Place of birth for the foreign-born population - Sierra Leone (%)
Place of birth for the foreign-born population - Other Western Africa (%)
Place of birth for the foreign-born population - Australia (%)
Place of birth for the foreign-born population - New Zealand (%)
Place of birth for the foreign-born population - Fiji (%)
Place of birth for the foreign-born population - Micronesia (%)
Place of birth for the foreign-born population - Bahamas (%)
Place of birth for the foreign-born population - Barbados (%)
Place of birth for the foreign-born population - Cuba (%)
Place of birth for the foreign-born population - Dominica (%)
Place of birth for the foreign-born population - Dominican Republic (%)
Place of birth for the foreign-born population - Grenada (%)
Place of birth for the foreign-born population - Haiti (%)
Place of birth for the foreign-born population - Jamaica (%)
Place of birth for the foreign-born population - St. Vincent and the Grenadines (%)
Place of birth for the foreign-born population - Trinidad and Tobago (%)
Place of birth for the foreign-born population - West Indies (%)
Place of birth for the foreign-born population - Other Caribbean (%)
Place of birth for the foreign-born population - Belize (%)
Place of birth for the foreign-born population - Costa Rica (%)
Place of birth for the foreign-born population - El Salvador (%)
Place of birth for the foreign-born population - Guatemala (%)
Place of birth for the foreign-born population - Honduras (%)
Place of birth for the foreign-born population - Mexico (%)
Place of birth for the foreign-born population - Nicaragua (%)
Place of birth for the foreign-born population - Panama (%)
Place of birth for the foreign-born population - Other Central America (%)
Place of birth for the foreign-born population - Argentina (%)
Place of birth for the foreign-born population - Bolivia (%)
Place of birth for the foreign-born population - Brazil (%)
Place of birth for the foreign-born population - Chile (%)
Place of birth for the foreign-born population - Colombia (%)
Place of birth for the foreign-born population - Ecuador (%)
Place of birth for the foreign-born population - Guyana (%)
Place of birth for the foreign-born population - Peru (%)
Place of birth for the foreign-born population - Uruguay (%)
Place of birth for the foreign-born population - Venezuela (%)
Place of birth for the foreign-born population - Other South America (%)
Place of birth for the foreign-born population - Canada (%)
Place of birth for the foreign-born population - Other Northern America (%)
Place of birth for the foreign-born population - Other (%)
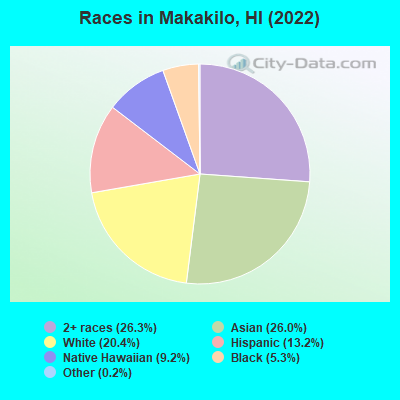
According to 2022 data, the most numerous races in Makakilo, HI are Asian alone (5,391 residents), Two or more races (5,462 residents), and White alone (4,232 residents). 81.4% of Makakilo residents speak English at home.
Race distribution in Makakilo 5,462 26.3% Two or more races 5,391 26.0% Asian alone 4,232 20.4% White alone 2,730 13.2% Hispanic 1,908 9.2% Native Hawaiian and Other 1,090 5.3% Black alone 38 0.2% Other race alone 3 0.01% American Indian alone
2000 2022
494,149 40.8% Asian alone 277,091 22.9% White alone 218,700 18.1% Two or more races 108,441 9.0% Native Hawaiian and Other 87,699 7.2% Hispanic 20,829 1.7% Black alone 2,089 0.2% Other race alone 2,539 0.2% American Indian alone
498,125 34.6% Asian alone 318,574 22.1% Two or more races 297,937 20.7% White alone 160,103 11.1% Hispanic 134,567 9.3% Native Hawaiian and Other 23,682 1.6% Black alone 5,378 0.4% Other race alone 1,830 0.1% American Indian alone
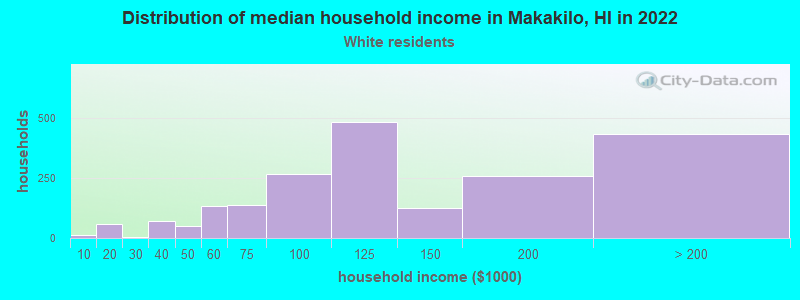
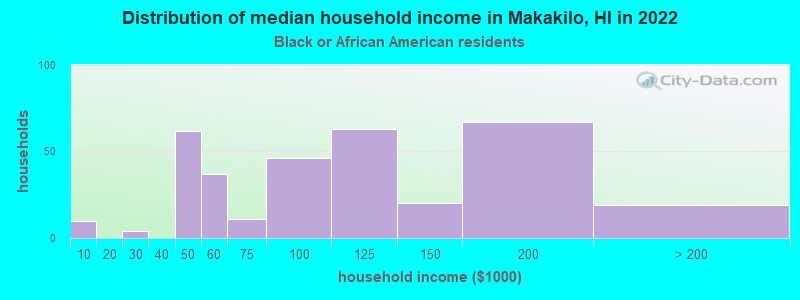
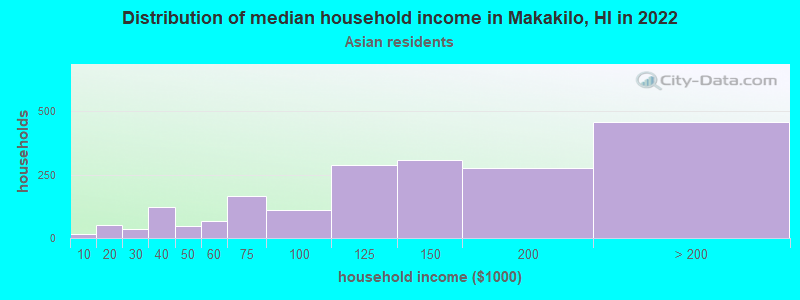
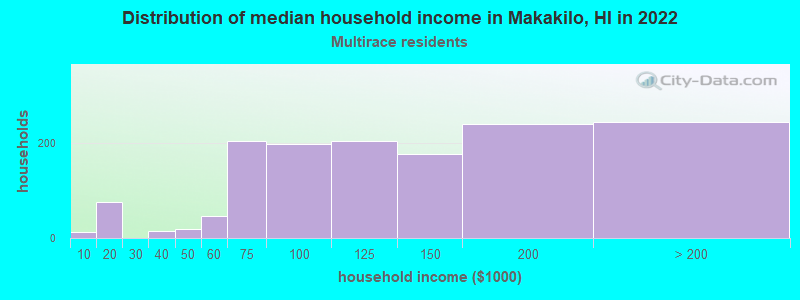
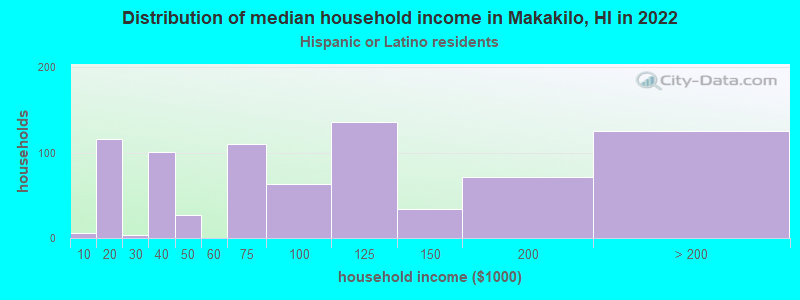
Income and house value in Makakilo Median household income in 2022 $117,116 White non-Hispanic householders$86,101 Black householders$128,768 Asian householders$51,322 Native Hawaiian and other Pacific Islander householders$113,839 Two or more races householders$95,251 Hispanic or Latino race householders
Median age by race in Makakilo
40.0 Median age for White residents41.4 39.3 33.6 Median age for Black or African American residents34.6 33.6 43.3 Median age for American Indian / Alaska Native residents44.7 -629,508,196.1 47.3 Median age for Asian residents40.8 48.4 34.8 Median age for Native Hawaiian / Pacific Islander residents42.1 22.2 22.0 Median age for Other race residents32.6 21.9 25.0 Median age for Two or more races residents27.6 24.1 44.0 Median age for White alone residents46.9 42.5 26.7 Median age for Hispanic or Latino residents28.5 26.5
Owner/renter occupied households by race in Makakilo
House owners and renters - White residents 1,638 79.1% Owner occupied433 20.9% Renter occupiedHouse owners and renters - Black or African American residents 198 53.6% Owner occupied172 46.4% Renter occupiedHouse owners and renters - American Indian / Alaska Native residents 4 100.0% Owner occupiedHouse owners and renters - Asian residents 1,754 88.4% Owner occupied230 11.6% Renter occupiedHouse owners and renters - Native Hawaiian / Pacific Islander residents 268 55.6% Owner occupied214 44.4% Renter occupiedHouse owners and renters - Other race residents 21 100.0% Owner occupiedHouse owners and renters - Two or more races residents 1,078 73.4% Owner occupied391 26.6% Renter occupiedHouse owners and renters - White alone residents 1,413 84.7% Owner occupied256 15.3% Renter occupiedHouse owners and renters - Hispanic or Latino residents 453 59.9% Owner occupied303 40.1% Renter occupied
Language usage in Makakilo
English speakers - Total 81.4% of residents of Makakilo speak English at home.
1.7% of residents speak Spanish at home 310 96.9% Speak English very well10 3.1% Speak English less than very well17.3% of residents speak other language at home 2,364 71.9% Speak English very well925 28.1% Speak English less than very well
English speakers - Born in the United States 91.7% of residents of Makakilo speak English at home.
3.6% of residents speak Spanish at home 219 95.6% Speak English very well10 4.4% Speak English less than very well4.8% of residents speak other language at home 300 98.0% Speak English very well6 2.0% Speak English less than very well
English speakers - Native, born elsewhere 90.7% of residents of Makakilo speak English at home.
13.2% of residents speak other language at home 93 75.6% Speak English very well30 24.4% Speak English less than very well
English speakers - Foreign-born 24.0% of residents of Makakilo speak English at home.
1.7% of residents speak Spanish at home 50 100.0% Speak English very well73.7% of residents speak other language at home 1,315 60.8% Speak English very well849 39.2% Speak English less than very well
White (Caucasian) - Speak only English Native:
93.3% (4,224)Foreign-born:
45.8% (149)
White (Caucasian) - Speak another language Native:
6.4% (289)Foreign-born:
53.0% (172)
Black or African American - Speak only English Native:
99.8% (821)Foreign-born:
78.5% (129)
Black or African American - Speak another language Native:
1.4% (12)Foreign-born:
99.1% (163)
Asian - Speak only English Native:
90.9% (3,155)Foreign-born:
15.6% (302)
Asian - Speak another language Native:
9.4% (325)Foreign-born:
84.4% (1,636)
Native Hawaiian / Pacific Islander - Speak only English Native:
89.6% (1,458)Foreign-born:
13.5% (22)
Native Hawaiian / Pacific Islander - Speak another language Native:
11.4% (186)Foreign-born:
86.4% (141)
Other race - Speak another language Native:
37.7% (30)Foreign-born:
98.0% (3)
Two or more races - Speak only English Native:
90.7% (5,071)Foreign-born:
32.7% (65)
Two or more races - Speak another language Native:
9.3% (519)Foreign-born:
67.3% (134)
White alone - Speak only English Native:
93.8% (3,481)Foreign-born:
52.8% (151)
White alone - Speak another language Native:
6.0% (224)Foreign-born:
47.2% (135)
Hispanic or Latino - Speak only English Native:
90.0% (2,120)Foreign-born:
36.1% (38)
Hispanic or Latino - Speak another language Native:
10.3% (242)Foreign-born:
67.2% (71)
Foreign-born residents in Makakilo
Marital status for residents in Makakilo Marital status - White (Caucasian) population 15 years and over
Males 22.4% Never married68.1% Now married1.2% Separated1.2% Widowed7.1% DivorcedFemales 18.9% Never married66.0% Now married0.0% Separated2.8% Widowed12.3% DivorcedWomen who gave birth in the past 12 months Now married:
100.0% (184)Unmarried:
0.0% (0)
Women who did not give birth in the past 12 months Now married:
54.7% (537)Unmarried:
45.3% (446)
Marital status - Black or African American population 15 years and over
Males 33.2% Never married52.1% Now married0.0% Separated4.8% Widowed9.9% DivorcedFemales 43.5% Never married41.5% Now married14.2% Separated0.8% Widowed0.0% DivorcedWomen who gave birth in the past 12 months Now married:
100.0% (9)Unmarried:
0.0% (0)
Women who did not give birth in the past 12 months Now married:
52.4% (207)Unmarried:
47.6% (188)
Marital status - Asian population 15 years and over
Males 22.5% Never married69.2% Now married0.0% Separated3.2% Widowed5.1% DivorcedFemales 15.1% Never married65.9% Now married1.7% Separated4.8% Widowed12.5% DivorcedWomen who gave birth in the past 12 months Now married:
100.0% (68)Unmarried:
0.0% (0)
Women who did not give birth in the past 12 months Now married:
68.4% (957)Unmarried:
31.6% (442)
Marital status - Native Hawaiian / Pacific Islander population 15 years and over
Males 30.7% Never married58.6% Now married0.0% Separated0.0% Widowed10.7% DivorcedFemales 42.2% Never married38.3% Now married3.2% Separated7.3% Widowed8.9% DivorcedWomen who gave birth in the past 12 months Now married:
100.0% (28)Unmarried:
0.0% (0)
Women who did not give birth in the past 12 months Now married:
30.1% (114)Unmarried:
69.9% (266)
Marital status - Other race population 15 years and over
Males 69.6% Never married30.4% Now married0.0% Separated0.0% Widowed0.0% DivorcedFemales 8.1% Never married91.9% Now married0.0% Separated0.0% Widowed0.0% DivorcedWomen who did not give birth in the past 12 months Now married:
85.7% (22)Unmarried:
14.3% (4)
Marital status - Two or more races population 15 years and over
Males 45.8% Never married46.8% Now married2.6% Separated1.2% Widowed3.6% DivorcedFemales 42.4% Never married46.6% Now married1.4% Separated2.1% Widowed7.5% DivorcedWomen who gave birth in the past 12 months Now married:
29.4% (5)Unmarried:
70.6% (13)
Women who did not give birth in the past 12 months Now married:
34.7% (487)Unmarried:
65.3% (914)
Marital status - White alone, not Hispanic / Latino population 15 years and over
Males 17.5% Never married73.9% Now married0.0% Separated1.5% Widowed7.0% DivorcedFemales 14.8% Never married68.5% Now married0.0% Separated3.3% Widowed13.4% DivorcedWomen who gave birth in the past 12 months Now married:
100.0% (181)Unmarried:
0.0% (0)
Women who did not give birth in the past 12 months Now married:
57.4% (447)Unmarried:
42.6% (332)
Marital status - Hispanic or Latino population 15 years and over
Males 45.4% Never married47.1% Now married2.7% Separated0.1% Widowed4.8% DivorcedFemales 40.8% Never married51.9% Now married0.0% Separated0.6% Widowed6.7% DivorcedWomen who gave birth in the past 12 months Now married:
100.0% (33)Unmarried:
0.0% (0)
Women who did not give birth in the past 12 months Now married:
44.6% (300)Unmarried:
55.4% (373)
Ancestries in Makakilo
254 2.7% Irish221 2.3% German206 2.2% American180 1.9% English144 1.5% African124 1.3% West Indian106 1.1% European95 1.0% Palestinian82 0.9% Polish68 0.7% Norwegian56 0.6% Jamaican55 0.6% Portuguese45 0.5% Hungarian44 0.5% Scottish43 0.5% Swedish39 0.4% British39 0.4% Croatian32 0.3% Italian27 0.3% Belgian22 0.2% Iranian21 0.2% Scandinavian16 0.2% Serbian15 0.2% French11 0.1% Latvian10 0.1% Lebanese9 0.10% Dutch8 0.08% Swiss7 0.07% Lithuanian5 0.05% Scotch-Irish
Geographical mobility in Makakilo Same house 1 year ago 4,352 85.5% White (Caucasian)703 63.8% Black or African American27 100.0% American Indian / Alaska Native5,271 92.4% Asian1,791 92.9% Native Hawaiian / Pacific Islander117 100.0% Other race5,949 90.9% Two or more races3,518 85.5% White alone, not Hispanic / Latino2,504 91.7% Hispanic or LatinoMoved within same county 344 6.8% White / Caucasian202 18.3% Black or African American177 3.1% Asian43 2.2% Native Hawaiian / Pacific Islander251 3.8% Two or more races222 5.4% White alone, not Hispanic / Latino179 6.6% Hispanic or LatinoMoved within same state 58 1.1% White / Caucasian160 2.8% Asian58 1.4% White alone, not Hispanic / LatinoMoved from different state 370 7.3% White / Caucasian145 13.2% Black or African American151 2.6% Asian105 5.4% Native Hawaiian / Pacific Islander357 5.5% Two or more races361 8.8% White alone, not Hispanic / Latino53 1.9% Hispanic or LatinoMoved from abroad 46 4.2% Black or African American7 0.1% Asian13 0.2% Two or more races9 0.3% Hispanic or Latino
Children Nativity (place of birth) in Makakilo
Children under 6 years - Living with two parents Both parents native 879 99.6% Native3 0.4% Foreign-bornBoth parents foreign-born 50 76.8% Native15 23.2% Foreign-bornOne native, one foreign-born parent 440 100.0% NativeChildren under 6 years - Living with one parent Native parent 393 100.0% NativeChildren 6 to 17 years - Living with two parents Both parents native 1,542 100.0% NativeBoth parents foreign-born 188 74.1% Native66 25.9% Foreign-bornOne native, one foreign-born parent 411 100.0% NativeChildren 6 to 17 years - Living with one parent Native parent 983 100.0% NativeForeign-born parent 24 45.6% Native29 54.4% Foreign-born
Grandparents responsible for own grandchildren in Makakilo
Grandparents (30 to 59 years) White / Caucasian 53 100.0% Not responsible for grandchildrenAsian 15 22.1% Responsible for grandchildren54 77.9% Not responsible for grandchildrenNative Hawaiian / Pacific Islander 8 33.7% Responsible for grandchildren16 66.3% Not responsible for grandchildrenOther race 18 100.0% Not responsible for grandchildrenTwo or more races 10 25.8% Responsible for grandchildren28 74.2% Not responsible for grandchildrenWhite alone, not Hispanic / Latino 16 100.0% Not responsible for grandchildrenHispanic or Latino 29 100.0% Not responsible for grandchildrenGrandparents (60 years and over) White / Caucasian 2 8.8% Responsible for grandchildren21 91.2% Not responsible for grandchildrenAsian 31 17.4% Responsible for grandchildren148 82.6% Not responsible for grandchildrenNative Hawaiian / Pacific Islander 12 27.7% Responsible for grandchildren30 72.3% Not responsible for grandchildrenTwo or more races 18 46.2% Responsible for grandchildren21 53.8% Not responsible for grandchildrenWhite alone, not Hispanic / Latino 2 15.6% Responsible for grandchildren13 84.4% Not responsible for grandchildrenHispanic or Latino 14 100.0% Not responsible for grandchildren