Races in Lynchburg, Virginia (VA) Detailed Stats
Data:
Races - White alone (%)
Races - White alone (% change since 2000)
Races - Black alone (%)
Races - Black alone (% change since 2000)
Races - American Indian alone (%)
Races - American Indian alone (% change since 2000)
Races - Asian alone (%)
Races - Asian alone (% change since 2000)
Races - Hispanic (%)
Races - Hispanic (% change since 2000)
Races - Native Hawaiian and Other Pacific Islander alone (%)
Races - Native Hawaiian and Other Pacific Islander alone (% change since 2000)
Races - Two or more races(%)
Races - Two or more races(% change since 2000)
Races - Other race alone (%)
Races - Other race alone (% change since 2000)
Racial diversity
Place of birth - Born in state of residence (%)
Place of birth - Born in state of residence (%) - White
Place of birth - Born in state of residence (%) - Black or African American
Place of birth - Born in state of residence (%) - Asian
Place of birth - Born in state of residence (%) - Hispanic or Latino
Place of birth - Born in state of residence (%) - American Indian and Alaska Native
Place of birth - Born in state of residence (%) - Multirace
Place of birth - Born in state of residence (%) - Other Race
Place of birth - Born in other state (%)
Place of birth - Born in other state (%) - White
Place of birth - Born in other state (%) - Black or African American
Place of birth - Born in other state (%) - Asian
Place of birth - Born in other state (%) - Hispanic or Latino
Place of birth - Born in other state (%) - American Indian and Alaska Native
Place of birth - Born in other state (%) - Multirace
Place of birth - Born in other state (%) - Other Race
Place of birth - Native, outside of US (%)
Place of birth - Native, outside of US (%) - White
Place of birth - Native, outside of US (%) - Black or African American
Place of birth - Native, outside of US (%) - Asian
Place of birth - Native, outside of US (%) - Hispanic or Latino
Place of birth - Native, outside of US (%) - American Indian and Alaska Native
Place of birth - Native, outside of US (%) - Multirace
Place of birth - Native, outside of US (%) - Other Race
Place of birth - Foreign born (%)
Place of birth - Foreign born (%) - White
Place of birth - Foreign born (%) - Black or African American
Place of birth - Foreign born (%) - Asian
Place of birth - Foreign born (%) - Hispanic or Latino
Place of birth - Foreign born (%) - American Indian and Alaska Native
Place of birth - Foreign born (%) - Multirace
Place of birth - Foreign born (%) - Other Race
Residents speaking English at home (%)
Residents speaking English at home - Born in the United States (%)
Residents speaking English at home - Native, born elsewhere (%)
Residents speaking English at home - Foreign born (%)
Residents speaking Spanish at home (%)
Residents speaking Spanish at home - Born in the United States (%)
Residents speaking Spanish at home - Native, born elsewhere (%)
Residents speaking Spanish at home - Foreign born (%)
Residents speaking other language at home (%)
Residents speaking other language at home - Born in the United States (%)
Residents speaking other language at home - Native, born elsewhere (%)
Residents speaking other language at home - Foreign born (%)
Marital status - Never married (%)
Marital status - Now married (%)
Marital status - Separated (%)
Marital status - Widowed (%)
Marital status - Divorced (%)
Ancestries Reported - Arab (%)
Ancestries Reported - Czech (%)
Ancestries Reported - Danish (%)
Ancestries Reported - Dutch (%)
Ancestries Reported - English (%)
Ancestries Reported - French (%)
Ancestries Reported - French Canadian (%)
Ancestries Reported - German (%)
Ancestries Reported - Greek (%)
Ancestries Reported - Hungarian (%)
Ancestries Reported - Irish (%)
Ancestries Reported - Italian (%)
Ancestries Reported - Lithuanian (%)
Ancestries Reported - Norwegian (%)
Ancestries Reported - Polish (%)
Ancestries Reported - Portuguese (%)
Ancestries Reported - Russian (%)
Ancestries Reported - Scotch-Irish (%)
Ancestries Reported - Scottish (%)
Ancestries Reported - Slovak (%)
Ancestries Reported - Subsaharan African (%)
Ancestries Reported - Swedish (%)
Ancestries Reported - Swiss (%)
Ancestries Reported - Ukrainian (%)
Ancestries Reported - United States (%)
Ancestries Reported - Welsh (%)
Ancestries Reported - West Indian (%)
Ancestries Reported - Other (%)
Geographical mobility - Same house 1 year ago (%)
Geographical mobility - Same house 1 year ago (%) - White
Geographical mobility - Same house 1 year ago (%) - Black or African American
Geographical mobility - Same house 1 year ago (%) - Asian
Geographical mobility - Same house 1 year ago (%) - Hispanic or Latino
Geographical mobility - Same house 1 year ago (%) - American Indian and Alaska Native
Geographical mobility - Same house 1 year ago (%) - Multirace
Geographical mobility - Same house 1 year ago (%) - Other Race
Geographical mobility - Moved within same county (%)
Geographical mobility - Moved within same county (%) - White
Geographical mobility - Moved within same county (%) - Black or African American
Geographical mobility - Moved within same county (%) - Asian
Geographical mobility - Moved within same county (%) - Hispanic or Latino
Geographical mobility - Moved within same county (%) - American Indian and Alaska Native
Geographical mobility - Moved within same county (%) - Multirace
Geographical mobility - Moved within same county (%) - Other Race
Geographical mobility - Moved from different county within same state (%)
Geographical mobility - Moved from different county within same state (%) - White
Geographical mobility - Moved from different county within same state (%) - Black or African American
Geographical mobility - Moved from different county within same state (%) - Asian
Geographical mobility - Moved from different county within same state (%) - Hispanic or Latino
Geographical mobility - Moved from different county within same state (%) - American Indian and Alaska Native
Geographical mobility - Moved from different county within same state (%) - Multirace
Geographical mobility - Moved from different county within same state (%) - Other Race
Geographical mobility - Moved from different state (%)
Geographical mobility - Moved from different state (%) - White
Geographical mobility - Moved from different state (%) - Black or African American
Geographical mobility - Moved from different state (%) - Asian
Geographical mobility - Moved from different state (%) - Hispanic or Latino
Geographical mobility - Moved from different state (%) - American Indian and Alaska Native
Geographical mobility - Moved from different state (%) - Multirace
Geographical mobility - Moved from different state (%) - Other Race
Geographical mobility - Moved from abroad (%)
Geographical mobility - Moved from abroad (%) - White
Geographical mobility - Moved from abroad (%) - Black or African American
Geographical mobility - Moved from abroad (%) - Asian
Geographical mobility - Moved from abroad (%) - Hispanic or Latino
Geographical mobility - Moved from abroad (%) - American Indian and Alaska Native
Geographical mobility - Moved from abroad (%) - Multirace
Geographical mobility - Moved from abroad (%) - Other Race
Place of birth for the foreign-born population - Ireland (%)
Place of birth for the foreign-born population - Denmark (%)
Place of birth for the foreign-born population - Norway (%)
Place of birth for the foreign-born population - Sweden (%)
Place of birth for the foreign-born population - United Kingdom (%)
Place of birth for the foreign-born population - England (%)
Place of birth for the foreign-born population - Scotland (%)
Place of birth for the foreign-born population - Other Northern Europe (%)
Place of birth for the foreign-born population - Austria (%)
Place of birth for the foreign-born population - Belgium (%)
Place of birth for the foreign-born population - France (%)
Place of birth for the foreign-born population - Germany (%)
Place of birth for the foreign-born population - Netherlands (%)
Place of birth for the foreign-born population - Switzerland (%)
Place of birth for the foreign-born population - Other Western Europe (%)
Place of birth for the foreign-born population - Greece (%)
Place of birth for the foreign-born population - Italy (%)
Place of birth for the foreign-born population - Portugal (%)
Place of birth for the foreign-born population - Spain (%)
Place of birth for the foreign-born population - Other Southern Europe (%)
Place of birth for the foreign-born population - Albania (%)
Place of birth for the foreign-born population - Belarus (%)
Place of birth for the foreign-born population - Bosnia and Herzegovina (%)
Place of birth for the foreign-born population - Bulgaria (%)
Place of birth for the foreign-born population - Croatia (%)
Place of birth for the foreign-born population - Czechoslovakia (%)
Place of birth for the foreign-born population - Hungary (%)
Place of birth for the foreign-born population - Latvia (%)
Place of birth for the foreign-born population - Lithuania (%)
Place of birth for the foreign-born population - North Macedonia (Macedonia) (%)
Place of birth for the foreign-born population - Moldova (%)
Place of birth for the foreign-born population - Poland (%)
Place of birth for the foreign-born population - Romania (%)
Place of birth for the foreign-born population - Russia (%)
Place of birth for the foreign-born population - Serbia (%)
Place of birth for the foreign-born population - Ukraine (%)
Place of birth for the foreign-born population - Other Eastern Europe (%)
Place of birth for the foreign-born population - China (%)
Place of birth for the foreign-born population - Hong Kong (%)
Place of birth for the foreign-born population - Taiwan (%)
Place of birth for the foreign-born population - Japan (%)
Place of birth for the foreign-born population - Korea (%)
Place of birth for the foreign-born population - Other Eastern Asia (%)
Place of birth for the foreign-born population - Afghanistan (%)
Place of birth for the foreign-born population - Bangladesh (%)
Place of birth for the foreign-born population - India (%)
Place of birth for the foreign-born population - Iran (%)
Place of birth for the foreign-born population - Kazakhstan (%)
Place of birth for the foreign-born population - Nepal (%)
Place of birth for the foreign-born population - Pakistan (%)
Place of birth for the foreign-born population - Sri Lanka (%)
Place of birth for the foreign-born population - Uzbekistan (%)
Place of birth for the foreign-born population - Other South Central Asia (%)
Place of birth for the foreign-born population - Burma (%)
Place of birth for the foreign-born population - Cambodia (%)
Place of birth for the foreign-born population - Indonesia (%)
Place of birth for the foreign-born population - Laos (%)
Place of birth for the foreign-born population - Malaysia (%)
Place of birth for the foreign-born population - Philippines (%)
Place of birth for the foreign-born population - Singapore (%)
Place of birth for the foreign-born population - Thailand (%)
Place of birth for the foreign-born population - Vietnam (%)
Place of birth for the foreign-born population - Other South Eastern Asia (%)
Place of birth for the foreign-born population - Armenia (%)
Place of birth for the foreign-born population - Iraq (%)
Place of birth for the foreign-born population - Israel (%)
Place of birth for the foreign-born population - Jordan (%)
Place of birth for the foreign-born population - Kuwait (%)
Place of birth for the foreign-born population - Lebanon (%)
Place of birth for the foreign-born population - Saudi Arabia (%)
Place of birth for the foreign-born population - Syria (%)
Place of birth for the foreign-born population - Turkey (%)
Place of birth for the foreign-born population - Yemen (%)
Place of birth for the foreign-born population - Other Western Asia (%)
Place of birth for the foreign-born population - Eritrea (%)
Place of birth for the foreign-born population - Ethiopia (%)
Place of birth for the foreign-born population - Kenya (%)
Place of birth for the foreign-born population - Somalia (%)
Place of birth for the foreign-born population - Uganda (%)
Place of birth for the foreign-born population - Zimbabwe (%)
Place of birth for the foreign-born population - Other Eastern Africa (%)
Place of birth for the foreign-born population - Cameroon (%)
Place of birth for the foreign-born population - Congo (%)
Place of birth for the foreign-born population - Democratic Republic of Congo (Zaire) (%)
Place of birth for the foreign-born population - Other Middle Africa (%)
Place of birth for the foreign-born population - Egypt (%)
Place of birth for the foreign-born population - Morocco (%)
Place of birth for the foreign-born population - Sudan (%)
Place of birth for the foreign-born population - Other Northern Africa (%)
Place of birth for the foreign-born population - South Africa (%)
Place of birth for the foreign-born population - Other Southern Africa (%)
Place of birth for the foreign-born population - Cabo Verde (%)
Place of birth for the foreign-born population - Ghana (%)
Place of birth for the foreign-born population - Liberia (%)
Place of birth for the foreign-born population - Nigeria (%)
Place of birth for the foreign-born population - Senegal (%)
Place of birth for the foreign-born population - Sierra Leone (%)
Place of birth for the foreign-born population - Other Western Africa (%)
Place of birth for the foreign-born population - Australia (%)
Place of birth for the foreign-born population - New Zealand (%)
Place of birth for the foreign-born population - Fiji (%)
Place of birth for the foreign-born population - Micronesia (%)
Place of birth for the foreign-born population - Bahamas (%)
Place of birth for the foreign-born population - Barbados (%)
Place of birth for the foreign-born population - Cuba (%)
Place of birth for the foreign-born population - Dominica (%)
Place of birth for the foreign-born population - Dominican Republic (%)
Place of birth for the foreign-born population - Grenada (%)
Place of birth for the foreign-born population - Haiti (%)
Place of birth for the foreign-born population - Jamaica (%)
Place of birth for the foreign-born population - St. Vincent and the Grenadines (%)
Place of birth for the foreign-born population - Trinidad and Tobago (%)
Place of birth for the foreign-born population - West Indies (%)
Place of birth for the foreign-born population - Other Caribbean (%)
Place of birth for the foreign-born population - Belize (%)
Place of birth for the foreign-born population - Costa Rica (%)
Place of birth for the foreign-born population - El Salvador (%)
Place of birth for the foreign-born population - Guatemala (%)
Place of birth for the foreign-born population - Honduras (%)
Place of birth for the foreign-born population - Mexico (%)
Place of birth for the foreign-born population - Nicaragua (%)
Place of birth for the foreign-born population - Panama (%)
Place of birth for the foreign-born population - Other Central America (%)
Place of birth for the foreign-born population - Argentina (%)
Place of birth for the foreign-born population - Bolivia (%)
Place of birth for the foreign-born population - Brazil (%)
Place of birth for the foreign-born population - Chile (%)
Place of birth for the foreign-born population - Colombia (%)
Place of birth for the foreign-born population - Ecuador (%)
Place of birth for the foreign-born population - Guyana (%)
Place of birth for the foreign-born population - Peru (%)
Place of birth for the foreign-born population - Uruguay (%)
Place of birth for the foreign-born population - Venezuela (%)
Place of birth for the foreign-born population - Other South America (%)
Place of birth for the foreign-born population - Canada (%)
Place of birth for the foreign-born population - Other Northern America (%)
Place of birth for the foreign-born population - Other (%)
Latest news about races in Lynchburg, VA collected exclusively by city-data.com from local newspapers, TV, and radio stations
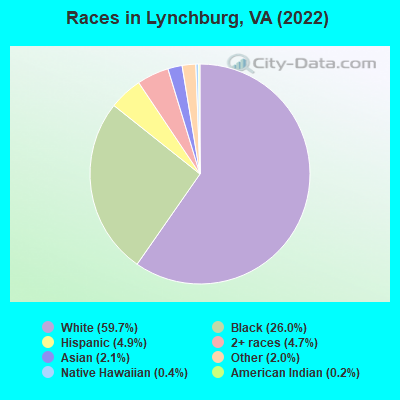
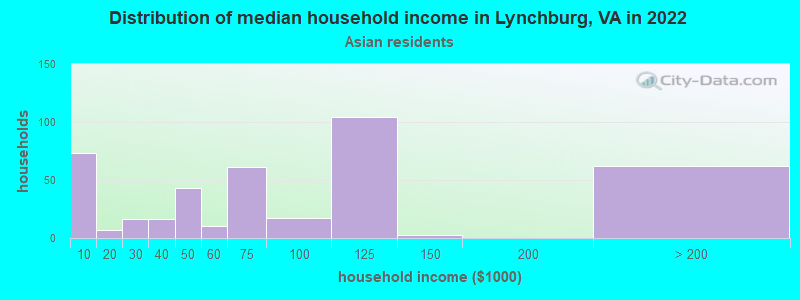
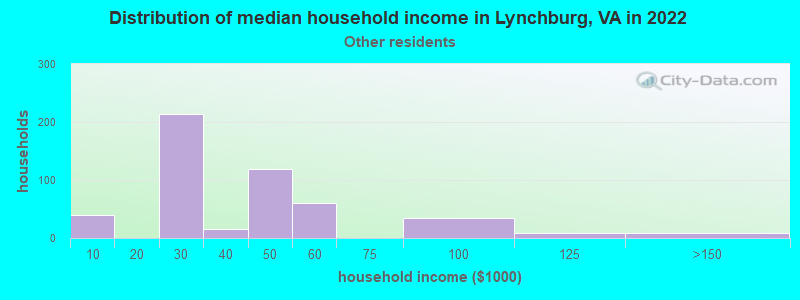
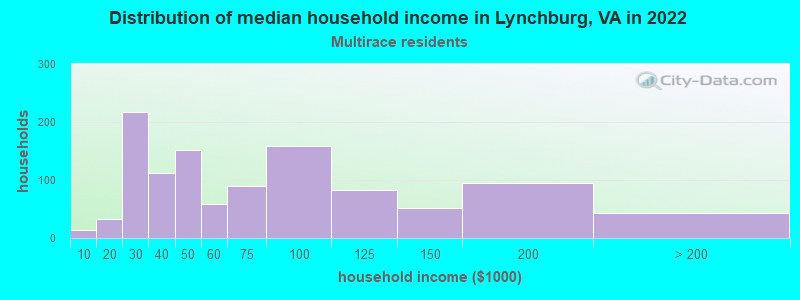
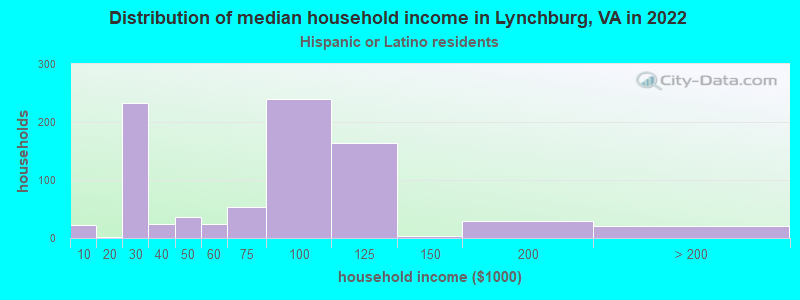
According to 2022 data, the most numerous races in Lynchburg, VA are White alone (47,367 residents), Black alone (20,605 residents), and Hispanic (3,898 residents). 93.5% of Lynchburg residents speak English at home. 4.2% of Lynchburg, VA residents are foreign-born (1.5% born in Asia, 1.0% born in Africa, 0.9% born in Latin America, 0.5% born in Europe), which is 184.2% less than the foreign-born rate of 12.0% across the entire state of Virginia.
Race distribution in Lynchburg
2000 2022
4,965,637 70.2% White alone 1,376,378 19.4% Black alone 329,540 4.7% Hispanic 259,277 3.7% Asian alone 114,022 1.6% Two or more races 18,596 0.3% American Indian alone 11,685 0.2% Other race alone 3,380 0.05% Native Hawaiian and Other
5,095,130 58.7% White alone 1,594,785 18.4% Black alone 905,750 10.4% Hispanic 602,881 6.9% Asian alone 406,047 4.7% Two or more races 60,419 0.7% Other race alone 11,738 0.1% American Indian alone 6,869 0.08% Native Hawaiian and Other
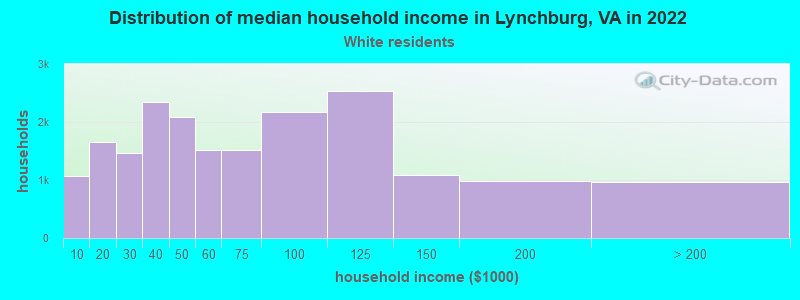
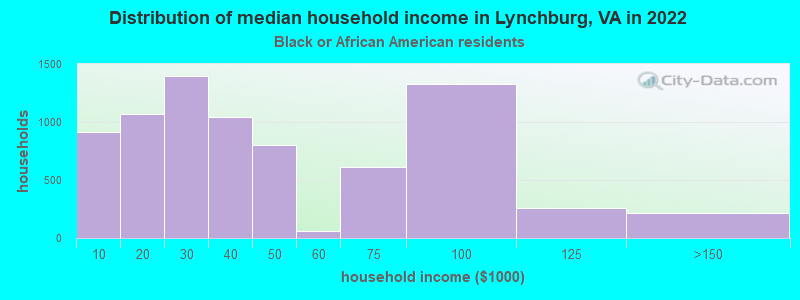
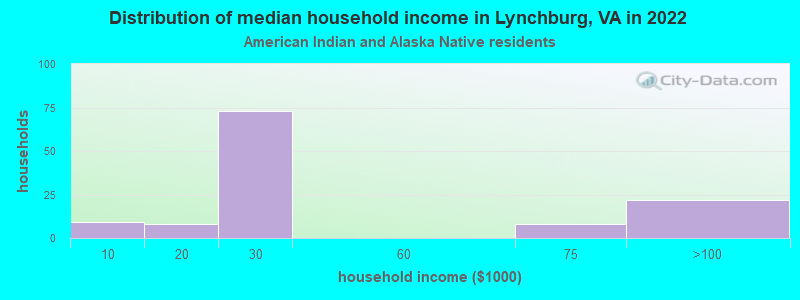
Income and house value in Lynchburg Median household income in 2022 $56,113 White non-Hispanic householders$34,012 Black householders$70,201 Asian householders$45,822 Some other race householders$58,417 Two or more races householders$91,216 Hispanic or Latino race householdersMedian 2022 house value $237,759 White Non-Hispanic householders$145,494 Black or African American householders$232,436 American Indian or Alaska Native householders $326,475 Asian householders$168,814 Some other race householders$213,679 Two or more races householders$225,592 Hispanic or Latino householders
Median age by race in Lynchburg
29.0 Median age for White residents27.7 30.4 30.1 Median age for Black or African American residents26.6 33.8 62.1 Median age for American Indian / Alaska Native residents-666,666,666.0 62.1 19.8 Median age for Asian residents19.8 19.8 -666,666,666.0 Median age for Native Hawaiian / Pacific Islander residents-666,666,666.0 -666,666,666.0 23.5 Median age for Other race residents19.4 24.0 20.6 Median age for Two or more races residents22.2 20.3 29.8 Median age for White alone residents29.1 30.8 21.4 Median age for Hispanic or Latino residents19.5 23.6
Owner/renter occupied households by race in Lynchburg
House owners and renters - White residents 10,870 55.9% Owner occupied8,562 44.1% Renter occupiedHouse owners and renters - Black or African American residents 2,117 27.5% Owner occupied5,577 72.5% Renter occupiedHouse owners and renters - American Indian / Alaska Native residents 19 16.4% Owner occupied97 83.6% Renter occupiedHouse owners and renters - Asian residents 164 41.1% Owner occupied235 58.9% Renter occupiedHouse owners and renters - Native Hawaiian / Pacific Islander residents 85 100.0% Renter occupiedHouse owners and renters - Other race residents 160 30.5% Owner occupied364 69.5% Renter occupiedHouse owners and renters - Two or more races residents 559 44.5% Owner occupied697 55.5% Renter occupiedHouse owners and renters - White alone residents 10,870 56.3% Owner occupied8,452 43.7% Renter occupiedHouse owners and renters - Hispanic or Latino residents 364 41.0% Owner occupied523 59.0% Renter occupied
Language usage in Lynchburg
English speakers - Total 93.5% of residents of Lynchburg speak English at home.
2.8% of residents speak Spanish at home 1,271 61.3% Speak English very well804 38.7% Speak English less than very well3.8% of residents speak other language at home 2,391 85.0% Speak English very well422 15.0% Speak English less than very well
English speakers - Born in the United States 95.3% of residents of Lynchburg speak English at home.
1.8% of residents speak Spanish at home 393 76.5% Speak English very well121 23.5% Speak English less than very well2.9% of residents speak other language at home 782 94.3% Speak English very well47 5.7% Speak English less than very well
English speakers - Native, born elsewhere 93.8% of residents of Lynchburg speak English at home.
6.2% of residents speak Spanish at home 40 100.0% Speak English very well
English speakers - Foreign-born 21.3% of residents of Lynchburg speak English at home.
21.8% of residents speak Spanish at home 153 28.7% Speak English very well381 71.3% Speak English less than very well56.9% of residents speak other language at home 1,153 82.8% Speak English very well239 17.2% Speak English less than very well
White (Caucasian) - Speak only English Native:
97.8% (45,145)Foreign-born:
30.8% (223)
White (Caucasian) - Speak another language Native:
2.2% (1,012)Foreign-born:
69.2% (501)
Black or African American - Speak only English Native:
97.9% (18,908)Foreign-born:
37.5% (347)
Black or African American - Speak another language Native:
2.0% (393)Foreign-born:
60.5% (558)
American Indian / Alaska Native - Speak another language Native:
42.0% (109)Foreign-born:
100.0% (12)
Asian - Speak only English Native:
33.5% (369)Foreign-born:
42.5% (259)
Asian - Speak another language Native:
66.5% (733)Foreign-born:
57.5% (351)
Other race - Speak only English Native:
80.9% (1,239)Foreign-born:
6.4% (13)
Other race - Speak another language Native:
24.2% (371)Foreign-born:
93.2% (194)
Two or more races - Speak only English Native:
80.8% (3,175)Foreign-born:
6.1% (36)
Two or more races - Speak another language Native:
19.0% (749)Foreign-born:
94.2% (555)
White alone - Speak only English Native:
98.7% (44,181)Foreign-born:
30.8% (223)
White alone - Speak another language Native:
1.3% (597)Foreign-born:
69.2% (501)
Hispanic or Latino - Speak another language Native:
33.0% (1,046)Foreign-born:
100.0% (534)
Foreign-born residents in Lynchburg 3,348 residents are foreign born (1.5% Asia , 1.0% Africa , 0.9% Latin America , 0.5% Europe ).
This city:
4.2%Virginia:
12.6%
Marital status for residents in Lynchburg Marital status - White (Caucasian) population 15 years and over
Males 47.3% Never married38.5% Now married0.5% Separated4.7% Widowed9.0% DivorcedFemales 42.9% Never married37.6% Now married0.8% Separated6.8% Widowed12.0% DivorcedWomen who gave birth in the past 12 months Now married:
74.3% (694)Unmarried:
25.7% (240)
Women who did not give birth in the past 12 months Now married:
30.0% (4,267)Unmarried:
70.0% (9,954)
Marital status - Black or African American population 15 years and over
Males 65.2% Never married24.4% Now married1.6% Separated6.1% Widowed2.7% DivorcedFemales 53.7% Never married15.7% Now married8.2% Separated5.1% Widowed17.4% DivorcedWomen who gave birth in the past 12 months Now married:
4.4% (15)Unmarried:
95.6% (324)
Women who did not give birth in the past 12 months Now married:
19.3% (1,098)Unmarried:
80.7% (4,605)
Marital status - American Indian / Alaska Native population 15 years and over
Males 72.8% Never married17.5% Now married9.7% Separated0.0% Widowed0.0% DivorcedFemales 8.1% Never married76.3% Now married11.6% Separated4.0% Widowed0.0% DivorcedWomen who did not give birth in the past 12 months Now married:
83.3% (74)Unmarried:
16.7% (15)
Marital status - Asian population 15 years and over
Males 67.7% Never married27.5% Now married0.0% Separated0.0% Widowed4.8% DivorcedFemales 61.0% Never married36.8% Now married0.0% Separated0.0% Widowed2.2% DivorcedWomen who did not give birth in the past 12 months Now married:
23.3% (198)Unmarried:
76.7% (651)
Marital status - Native Hawaiian / Pacific Islander population 15 years and over
Males 0.0% Never married100.0% Now married0.0% Separated0.0% Widowed0.0% DivorcedFemales 0.0% Never married100.0% Now married0.0% Separated0.0% Widowed0.0% DivorcedWomen who did not give birth in the past 12 months Now married:
100.0% (51)Unmarried:
0.0% (0)
Marital status - Other race population 15 years and over
Males 31.8% Never married61.2% Now married7.0% Separated0.0% Widowed0.0% DivorcedFemales 47.4% Never married46.2% Now married0.0% Separated0.0% Widowed6.4% DivorcedWomen who gave birth in the past 12 months Now married:
70.0% (92)Unmarried:
30.0% (39)
Women who did not give birth in the past 12 months Now married:
33.0% (192)Unmarried:
67.0% (389)
Marital status - Two or more races population 15 years and over
Males 45.3% Never married42.9% Now married1.1% Separated0.7% Widowed9.9% DivorcedFemales 73.5% Never married22.7% Now married0.0% Separated3.1% Widowed0.8% DivorcedWomen who did not give birth in the past 12 months Now married:
21.1% (343)Unmarried:
78.9% (1,287)
Marital status - White alone, not Hispanic / Latino population 15 years and over
Males 46.3% Never married39.3% Now married0.5% Separated4.8% Widowed9.1% DivorcedFemales 42.9% Never married37.5% Now married0.8% Separated7.0% Widowed11.8% DivorcedWomen who gave birth in the past 12 months Now married:
70.9% (584)Unmarried:
29.1% (240)
Women who did not give birth in the past 12 months Now married:
30.0% (4,071)Unmarried:
70.0% (9,513)
Marital status - Hispanic or Latino population 15 years and over
Males 54.6% Never married37.3% Now married3.2% Separated1.8% Widowed3.1% DivorcedFemales 47.9% Never married43.6% Now married0.3% Separated0.1% Widowed8.0% DivorcedWomen who gave birth in the past 12 months Now married:
34.0% (17)Unmarried:
66.0% (33)
Women who did not give birth in the past 12 months Now married:
35.7% (463)Unmarried:
64.3% (833)
Ancestries in Lynchburg
16,147 37.1% American3,536 8.1% English1,521 3.5% German1,391 3.2% Irish998 2.3% European758 1.7% Italian605 1.4% Scottish383 0.9% African321 0.7% Scotch-Irish319 0.7% Nigerian209 0.5% Dutch177 0.4% Norwegian175 0.4% Polish164 0.4% British110 0.3% Lebanese99 0.2% Brazilian80 0.2% Kenyan78 0.2% Northern European74 0.2% French68 0.2% Greek66 0.2% Eastern European59 0.1% Welsh55 0.1% Russian52 0.1% Swedish49 0.1% Ghanaian43 0.10% Jamaican42 0.10% Czech40 0.09% Ukrainian38 0.09% Romanian37 0.09% Hungarian34 0.08% Danish34 0.08% Cajun33 0.08% Scandinavian29 0.07% Belgian27 0.06% Haitian24 0.06% Finnish24 0.06% Palestinian23 0.05% Canadian22 0.05% French Canadian21 0.05% Yugoslavian20 0.05% Ethiopian18 0.04% Cypriot17 0.04% Sudanese15 0.03% Austrian15 0.03% Swiss14 0.03% Pennsylvania German14 0.03% Portuguese14 0.03% Israeli12 0.03% Trinidadian and Tobagonian11 0.03% Maltese9 0.02% Latvian9 0.02% Lithuanian7 0.02% Iranian4 0.01% Croatian4 0.01% Arab4 0.01% Sierra Leonean3 0.01% Afghan3 0.01% Serbian3 0.01% Zimbabwean3 0.01% Egyptian
Geographical mobility in Lynchburg Same house 1 year ago 37,653 78.0% White (Caucasian)17,110 82.7% Black or African American268 88.8% American Indian / Alaska Native1,182 65.6% Asian18 9.5% Native Hawaiian / Pacific Islander1,118 60.0% Other race3,785 73.8% Two or more races36,473 78.0% White alone, not Hispanic / Latino2,459 65.7% Hispanic or LatinoMoved within same county 3,368 7.0% White / Caucasian1,680 8.1% Black or African American23 7.5% American Indian / Alaska Native144 8.0% Asian249 100.0% Native Hawaiian / Pacific Islander218 11.7% Other race382 7.5% Two or more races3,258 7.0% White alone, not Hispanic / Latino301 8.0% Hispanic or LatinoMoved within same state 5,124 10.6% White / Caucasian1,480 7.2% Black or African American267 14.8% Asian387 20.7% Other race578 11.3% Two or more races5,081 10.9% White alone, not Hispanic / Latino712 19.0% Hispanic or LatinoMoved from different state 2,122 4.4% White / Caucasian301 1.5% Black or African American8 2.6% American Indian / Alaska Native167 9.3% Asian47 2.5% Other race363 7.1% Two or more races1,959 4.2% White alone, not Hispanic / Latino264 7.1% Hispanic or LatinoMoved from abroad 109 0.5% Black or African American3 0.9% American Indian / Alaska Native64 3.6% Asian23 1.2% Other race23 0.4% Two or more races30 0.8% Hispanic or Latino
Children Nativity (place of birth) in Lynchburg
Children under 6 years - Living with two parents Both parents native 2,334 100.0% NativeBoth parents foreign-born 32 100.0% NativeOne native, one foreign-born parent 251 100.0% NativeChildren under 6 years - Living with one parent Native parent 2,353 100.0% NativeForeign-born parent 17 100.0% NativeChildren 6 to 17 years - Living with two parents Both parents native 4,201 99.6% Native19 0.4% Foreign-bornBoth parents foreign-born 206 97.6% Native5 2.4% Foreign-bornOne native, one foreign-born parent 322 100.0% NativeChildren 6 to 17 years - Living with one parent Native parent 4,378 100.0% NativeForeign-born parent 144 54.2% Native122 45.8% Foreign-born
Grandparents responsible for own grandchildren in Lynchburg
Grandparents (30 to 59 years) White / Caucasian 24 19.2% Responsible for grandchildren99 80.8% Not responsible for grandchildrenBlack or African American 250 63.3% Responsible for grandchildren145 36.7% Not responsible for grandchildrenOther race 29 100.0% Not responsible for grandchildrenWhite alone, not Hispanic / Latino 24 17.8% Responsible for grandchildren110 82.2% Not responsible for grandchildrenHispanic or Latino 16 100.0% Not responsible for grandchildrenGrandparents (60 years and over) White / Caucasian 27 19.0% Responsible for grandchildren113 81.0% Not responsible for grandchildrenBlack or African American 32 15.2% Responsible for grandchildren176 84.8% Not responsible for grandchildrenWhite alone, not Hispanic / Latino 27 18.3% Responsible for grandchildren120 81.7% Not responsible for grandchildrenHispanic or Latino 40 100.0% Not responsible for grandchildren