Races in Lorton, Virginia (VA) Detailed Stats
Data:
Races - White alone (%)
Races - White alone (% change since 2000)
Races - Black alone (%)
Races - Black alone (% change since 2000)
Races - American Indian alone (%)
Races - American Indian alone (% change since 2000)
Races - Asian alone (%)
Races - Asian alone (% change since 2000)
Races - Hispanic (%)
Races - Hispanic (% change since 2000)
Races - Native Hawaiian and Other Pacific Islander alone (%)
Races - Native Hawaiian and Other Pacific Islander alone (% change since 2000)
Races - Two or more races(%)
Races - Two or more races(% change since 2000)
Races - Other race alone (%)
Races - Other race alone (% change since 2000)
Racial diversity
Place of birth - Born in state of residence (%)
Place of birth - Born in state of residence (%) - White
Place of birth - Born in state of residence (%) - Black or African American
Place of birth - Born in state of residence (%) - Asian
Place of birth - Born in state of residence (%) - Hispanic or Latino
Place of birth - Born in state of residence (%) - American Indian and Alaska Native
Place of birth - Born in state of residence (%) - Multirace
Place of birth - Born in state of residence (%) - Other Race
Place of birth - Born in other state (%)
Place of birth - Born in other state (%) - White
Place of birth - Born in other state (%) - Black or African American
Place of birth - Born in other state (%) - Asian
Place of birth - Born in other state (%) - Hispanic or Latino
Place of birth - Born in other state (%) - American Indian and Alaska Native
Place of birth - Born in other state (%) - Multirace
Place of birth - Born in other state (%) - Other Race
Place of birth - Native, outside of US (%)
Place of birth - Native, outside of US (%) - White
Place of birth - Native, outside of US (%) - Black or African American
Place of birth - Native, outside of US (%) - Asian
Place of birth - Native, outside of US (%) - Hispanic or Latino
Place of birth - Native, outside of US (%) - American Indian and Alaska Native
Place of birth - Native, outside of US (%) - Multirace
Place of birth - Native, outside of US (%) - Other Race
Place of birth - Foreign born (%)
Place of birth - Foreign born (%) - White
Place of birth - Foreign born (%) - Black or African American
Place of birth - Foreign born (%) - Asian
Place of birth - Foreign born (%) - Hispanic or Latino
Place of birth - Foreign born (%) - American Indian and Alaska Native
Place of birth - Foreign born (%) - Multirace
Place of birth - Foreign born (%) - Other Race
Residents speaking English at home (%)
Residents speaking English at home - Born in the United States (%)
Residents speaking English at home - Native, born elsewhere (%)
Residents speaking English at home - Foreign born (%)
Residents speaking Spanish at home (%)
Residents speaking Spanish at home - Born in the United States (%)
Residents speaking Spanish at home - Native, born elsewhere (%)
Residents speaking Spanish at home - Foreign born (%)
Residents speaking other language at home (%)
Residents speaking other language at home - Born in the United States (%)
Residents speaking other language at home - Native, born elsewhere (%)
Residents speaking other language at home - Foreign born (%)
Marital status - Never married (%)
Marital status - Now married (%)
Marital status - Separated (%)
Marital status - Widowed (%)
Marital status - Divorced (%)
Ancestries Reported - Arab (%)
Ancestries Reported - Czech (%)
Ancestries Reported - Danish (%)
Ancestries Reported - Dutch (%)
Ancestries Reported - English (%)
Ancestries Reported - French (%)
Ancestries Reported - French Canadian (%)
Ancestries Reported - German (%)
Ancestries Reported - Greek (%)
Ancestries Reported - Hungarian (%)
Ancestries Reported - Irish (%)
Ancestries Reported - Italian (%)
Ancestries Reported - Lithuanian (%)
Ancestries Reported - Norwegian (%)
Ancestries Reported - Polish (%)
Ancestries Reported - Portuguese (%)
Ancestries Reported - Russian (%)
Ancestries Reported - Scotch-Irish (%)
Ancestries Reported - Scottish (%)
Ancestries Reported - Slovak (%)
Ancestries Reported - Subsaharan African (%)
Ancestries Reported - Swedish (%)
Ancestries Reported - Swiss (%)
Ancestries Reported - Ukrainian (%)
Ancestries Reported - United States (%)
Ancestries Reported - Welsh (%)
Ancestries Reported - West Indian (%)
Ancestries Reported - Other (%)
Geographical mobility - Same house 1 year ago (%)
Geographical mobility - Same house 1 year ago (%) - White
Geographical mobility - Same house 1 year ago (%) - Black or African American
Geographical mobility - Same house 1 year ago (%) - Asian
Geographical mobility - Same house 1 year ago (%) - Hispanic or Latino
Geographical mobility - Same house 1 year ago (%) - American Indian and Alaska Native
Geographical mobility - Same house 1 year ago (%) - Multirace
Geographical mobility - Same house 1 year ago (%) - Other Race
Geographical mobility - Moved within same county (%)
Geographical mobility - Moved within same county (%) - White
Geographical mobility - Moved within same county (%) - Black or African American
Geographical mobility - Moved within same county (%) - Asian
Geographical mobility - Moved within same county (%) - Hispanic or Latino
Geographical mobility - Moved within same county (%) - American Indian and Alaska Native
Geographical mobility - Moved within same county (%) - Multirace
Geographical mobility - Moved within same county (%) - Other Race
Geographical mobility - Moved from different county within same state (%)
Geographical mobility - Moved from different county within same state (%) - White
Geographical mobility - Moved from different county within same state (%) - Black or African American
Geographical mobility - Moved from different county within same state (%) - Asian
Geographical mobility - Moved from different county within same state (%) - Hispanic or Latino
Geographical mobility - Moved from different county within same state (%) - American Indian and Alaska Native
Geographical mobility - Moved from different county within same state (%) - Multirace
Geographical mobility - Moved from different county within same state (%) - Other Race
Geographical mobility - Moved from different state (%)
Geographical mobility - Moved from different state (%) - White
Geographical mobility - Moved from different state (%) - Black or African American
Geographical mobility - Moved from different state (%) - Asian
Geographical mobility - Moved from different state (%) - Hispanic or Latino
Geographical mobility - Moved from different state (%) - American Indian and Alaska Native
Geographical mobility - Moved from different state (%) - Multirace
Geographical mobility - Moved from different state (%) - Other Race
Geographical mobility - Moved from abroad (%)
Geographical mobility - Moved from abroad (%) - White
Geographical mobility - Moved from abroad (%) - Black or African American
Geographical mobility - Moved from abroad (%) - Asian
Geographical mobility - Moved from abroad (%) - Hispanic or Latino
Geographical mobility - Moved from abroad (%) - American Indian and Alaska Native
Geographical mobility - Moved from abroad (%) - Multirace
Geographical mobility - Moved from abroad (%) - Other Race
Place of birth for the foreign-born population - Ireland (%)
Place of birth for the foreign-born population - Denmark (%)
Place of birth for the foreign-born population - Norway (%)
Place of birth for the foreign-born population - Sweden (%)
Place of birth for the foreign-born population - United Kingdom (%)
Place of birth for the foreign-born population - England (%)
Place of birth for the foreign-born population - Scotland (%)
Place of birth for the foreign-born population - Other Northern Europe (%)
Place of birth for the foreign-born population - Austria (%)
Place of birth for the foreign-born population - Belgium (%)
Place of birth for the foreign-born population - France (%)
Place of birth for the foreign-born population - Germany (%)
Place of birth for the foreign-born population - Netherlands (%)
Place of birth for the foreign-born population - Switzerland (%)
Place of birth for the foreign-born population - Other Western Europe (%)
Place of birth for the foreign-born population - Greece (%)
Place of birth for the foreign-born population - Italy (%)
Place of birth for the foreign-born population - Portugal (%)
Place of birth for the foreign-born population - Spain (%)
Place of birth for the foreign-born population - Other Southern Europe (%)
Place of birth for the foreign-born population - Albania (%)
Place of birth for the foreign-born population - Belarus (%)
Place of birth for the foreign-born population - Bosnia and Herzegovina (%)
Place of birth for the foreign-born population - Bulgaria (%)
Place of birth for the foreign-born population - Croatia (%)
Place of birth for the foreign-born population - Czechoslovakia (%)
Place of birth for the foreign-born population - Hungary (%)
Place of birth for the foreign-born population - Latvia (%)
Place of birth for the foreign-born population - Lithuania (%)
Place of birth for the foreign-born population - North Macedonia (Macedonia) (%)
Place of birth for the foreign-born population - Moldova (%)
Place of birth for the foreign-born population - Poland (%)
Place of birth for the foreign-born population - Romania (%)
Place of birth for the foreign-born population - Russia (%)
Place of birth for the foreign-born population - Serbia (%)
Place of birth for the foreign-born population - Ukraine (%)
Place of birth for the foreign-born population - Other Eastern Europe (%)
Place of birth for the foreign-born population - China (%)
Place of birth for the foreign-born population - Hong Kong (%)
Place of birth for the foreign-born population - Taiwan (%)
Place of birth for the foreign-born population - Japan (%)
Place of birth for the foreign-born population - Korea (%)
Place of birth for the foreign-born population - Other Eastern Asia (%)
Place of birth for the foreign-born population - Afghanistan (%)
Place of birth for the foreign-born population - Bangladesh (%)
Place of birth for the foreign-born population - India (%)
Place of birth for the foreign-born population - Iran (%)
Place of birth for the foreign-born population - Kazakhstan (%)
Place of birth for the foreign-born population - Nepal (%)
Place of birth for the foreign-born population - Pakistan (%)
Place of birth for the foreign-born population - Sri Lanka (%)
Place of birth for the foreign-born population - Uzbekistan (%)
Place of birth for the foreign-born population - Other South Central Asia (%)
Place of birth for the foreign-born population - Burma (%)
Place of birth for the foreign-born population - Cambodia (%)
Place of birth for the foreign-born population - Indonesia (%)
Place of birth for the foreign-born population - Laos (%)
Place of birth for the foreign-born population - Malaysia (%)
Place of birth for the foreign-born population - Philippines (%)
Place of birth for the foreign-born population - Singapore (%)
Place of birth for the foreign-born population - Thailand (%)
Place of birth for the foreign-born population - Vietnam (%)
Place of birth for the foreign-born population - Other South Eastern Asia (%)
Place of birth for the foreign-born population - Armenia (%)
Place of birth for the foreign-born population - Iraq (%)
Place of birth for the foreign-born population - Israel (%)
Place of birth for the foreign-born population - Jordan (%)
Place of birth for the foreign-born population - Kuwait (%)
Place of birth for the foreign-born population - Lebanon (%)
Place of birth for the foreign-born population - Saudi Arabia (%)
Place of birth for the foreign-born population - Syria (%)
Place of birth for the foreign-born population - Turkey (%)
Place of birth for the foreign-born population - Yemen (%)
Place of birth for the foreign-born population - Other Western Asia (%)
Place of birth for the foreign-born population - Eritrea (%)
Place of birth for the foreign-born population - Ethiopia (%)
Place of birth for the foreign-born population - Kenya (%)
Place of birth for the foreign-born population - Somalia (%)
Place of birth for the foreign-born population - Uganda (%)
Place of birth for the foreign-born population - Zimbabwe (%)
Place of birth for the foreign-born population - Other Eastern Africa (%)
Place of birth for the foreign-born population - Cameroon (%)
Place of birth for the foreign-born population - Congo (%)
Place of birth for the foreign-born population - Democratic Republic of Congo (Zaire) (%)
Place of birth for the foreign-born population - Other Middle Africa (%)
Place of birth for the foreign-born population - Egypt (%)
Place of birth for the foreign-born population - Morocco (%)
Place of birth for the foreign-born population - Sudan (%)
Place of birth for the foreign-born population - Other Northern Africa (%)
Place of birth for the foreign-born population - South Africa (%)
Place of birth for the foreign-born population - Other Southern Africa (%)
Place of birth for the foreign-born population - Cabo Verde (%)
Place of birth for the foreign-born population - Ghana (%)
Place of birth for the foreign-born population - Liberia (%)
Place of birth for the foreign-born population - Nigeria (%)
Place of birth for the foreign-born population - Senegal (%)
Place of birth for the foreign-born population - Sierra Leone (%)
Place of birth for the foreign-born population - Other Western Africa (%)
Place of birth for the foreign-born population - Australia (%)
Place of birth for the foreign-born population - New Zealand (%)
Place of birth for the foreign-born population - Fiji (%)
Place of birth for the foreign-born population - Micronesia (%)
Place of birth for the foreign-born population - Bahamas (%)
Place of birth for the foreign-born population - Barbados (%)
Place of birth for the foreign-born population - Cuba (%)
Place of birth for the foreign-born population - Dominica (%)
Place of birth for the foreign-born population - Dominican Republic (%)
Place of birth for the foreign-born population - Grenada (%)
Place of birth for the foreign-born population - Haiti (%)
Place of birth for the foreign-born population - Jamaica (%)
Place of birth for the foreign-born population - St. Vincent and the Grenadines (%)
Place of birth for the foreign-born population - Trinidad and Tobago (%)
Place of birth for the foreign-born population - West Indies (%)
Place of birth for the foreign-born population - Other Caribbean (%)
Place of birth for the foreign-born population - Belize (%)
Place of birth for the foreign-born population - Costa Rica (%)
Place of birth for the foreign-born population - El Salvador (%)
Place of birth for the foreign-born population - Guatemala (%)
Place of birth for the foreign-born population - Honduras (%)
Place of birth for the foreign-born population - Mexico (%)
Place of birth for the foreign-born population - Nicaragua (%)
Place of birth for the foreign-born population - Panama (%)
Place of birth for the foreign-born population - Other Central America (%)
Place of birth for the foreign-born population - Argentina (%)
Place of birth for the foreign-born population - Bolivia (%)
Place of birth for the foreign-born population - Brazil (%)
Place of birth for the foreign-born population - Chile (%)
Place of birth for the foreign-born population - Colombia (%)
Place of birth for the foreign-born population - Ecuador (%)
Place of birth for the foreign-born population - Guyana (%)
Place of birth for the foreign-born population - Peru (%)
Place of birth for the foreign-born population - Uruguay (%)
Place of birth for the foreign-born population - Venezuela (%)
Place of birth for the foreign-born population - Other South America (%)
Place of birth for the foreign-born population - Canada (%)
Place of birth for the foreign-born population - Other Northern America (%)
Place of birth for the foreign-born population - Other (%)
Latest news about races in Lorton, VA collected exclusively by city-data.com from local newspapers, TV, and radio stations
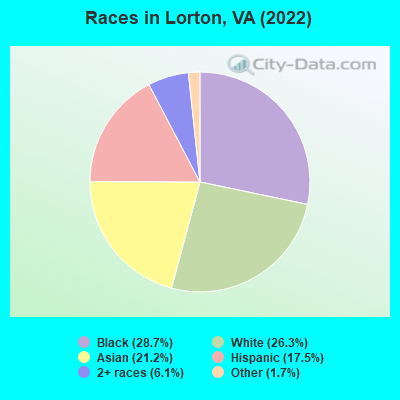
According to 2022 data, the most numerous races in Lorton, VA are White alone (5,761 residents), Black alone (6,286 residents), and Hispanic (3,837 residents). 56.2% of Lorton residents speak English at home. 34.2% of Lorton, VA residents are foreign-born (16.2% born in Asia, 8.4% born in Africa, 7.9% born in Latin America), which is 64.9% greater than the foreign-born rate of 12.0% across the entire state of Virginia.
Race distribution in Lorton
2000 2022
4,965,637 70.2% White alone 1,376,378 19.4% Black alone 329,540 4.7% Hispanic 259,277 3.7% Asian alone 114,022 1.6% Two or more races 18,596 0.3% American Indian alone 11,685 0.2% Other race alone 3,380 0.05% Native Hawaiian and Other
5,095,130 58.7% White alone 1,594,785 18.4% Black alone 905,750 10.4% Hispanic 602,881 6.9% Asian alone 406,047 4.7% Two or more races 60,419 0.7% Other race alone 11,738 0.1% American Indian alone 6,869 0.08% Native Hawaiian and Other
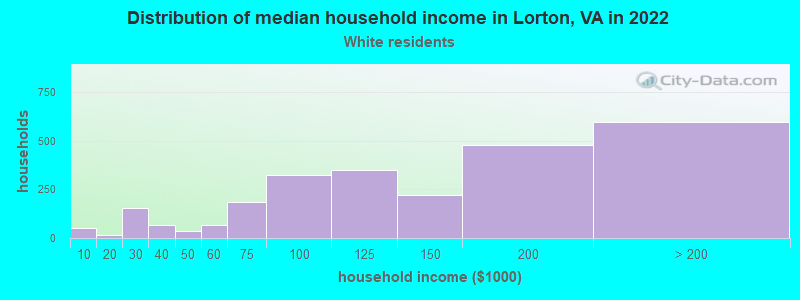
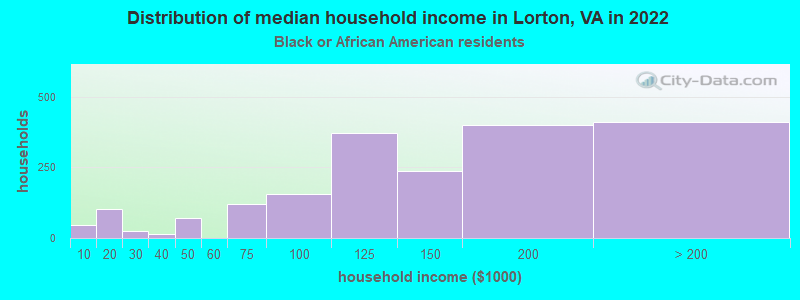
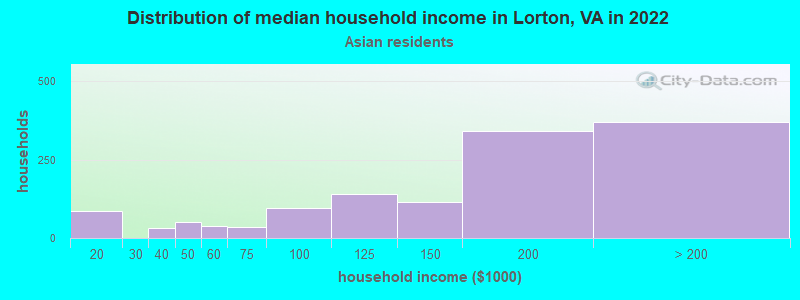
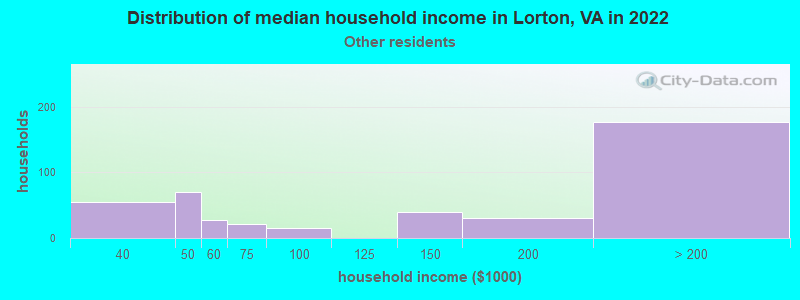
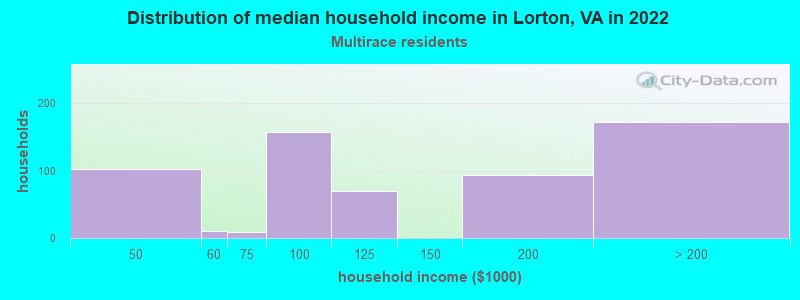
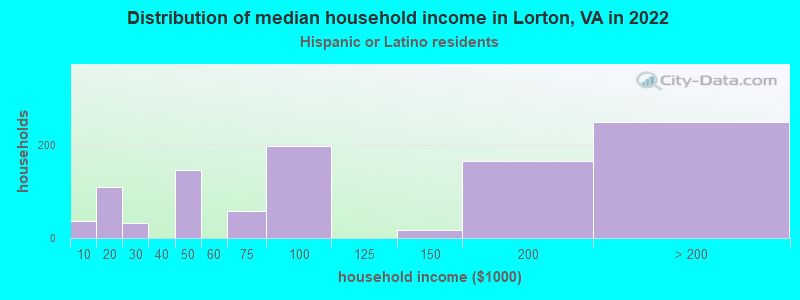
Income and house value in Lorton Median household income in 2022 $131,253 White non-Hispanic householders$130,002 Black householders$168,262 Asian householders$132,389 Some other race householders$105,639 Two or more races householders$85,848 Hispanic or Latino race householdersMedian 2022 house value $627,218 White Non-Hispanic householders$601,224 Black or African American householders$564,748 American Indian or Alaska Native householders $677,949 Asian householders$581,099 Some other race householders$498,924 Two or more races householders$557,201 Hispanic or Latino householders
Median age by race in Lorton
37.8 Median age for White residents39.1 37.0 43.5 Median age for Black or African American residents33.5 46.0 -754,182,753.4 Median age for American Indian / Alaska Native residents-964,539,006.1 -669,005,847.3 43.4 Median age for Asian residents42.7 43.4 -666,666,666.0 Median age for Native Hawaiian / Pacific Islander residents-558,791,801.0 -584,518,166.9 39.3 Median age for Other race residents38.1 41.5 20.2 Median age for Two or more races residents19.8 20.8 39.3 Median age for White alone residents43.3 38.0 28.9 Median age for Hispanic or Latino residents29.0 28.9
Owner/renter occupied households by race in Lorton
House owners and renters - White residents 1,483 57.3% Owner occupied1,107 42.7% Renter occupiedHouse owners and renters - Black or African American residents 1,007 52.9% Owner occupied896 47.1% Renter occupiedHouse owners and renters - Asian residents 1,235 91.2% Owner occupied120 8.8% Renter occupiedHouse owners and renters - Other race residents 288 73.8% Owner occupied102 26.2% Renter occupiedHouse owners and renters - Two or more races residents 218 33.3% Owner occupied438 66.7% Renter occupiedHouse owners and renters - White alone residents 1,270 53.2% Owner occupied1,117 46.8% Renter occupiedHouse owners and renters - Hispanic or Latino residents 521 54.7% Owner occupied432 45.3% Renter occupied
Language usage in Lorton
English speakers - Total 56.2% of residents of Lorton speak English at home.
12.1% of residents speak Spanish at home 1,713 68.8% Speak English very well776 31.2% Speak English less than very well31.4% of residents speak other language at home 4,238 65.7% Speak English very well2,208 34.3% Speak English less than very well
English speakers - Born in the United States 93.2% of residents of Lorton speak English at home.
2.1% of residents speak Spanish at home 141 100.0% Speak English very well4.5% of residents speak other language at home 305 100.0% Speak English very well
English speakers - Native, born elsewhere 70.4% of residents of Lorton speak English at home.
14.3% of residents speak Spanish at home 104 100.0% Speak English very well14.1% of residents speak other language at home 103 100.0% Speak English very well
English speakers - Foreign-born 13.0% of residents of Lorton speak English at home.
21.5% of residents speak Spanish at home 845 52.5% Speak English very well765 47.5% Speak English less than very well65.1% of residents speak other language at home 2,700 55.3% Speak English very well2,182 44.7% Speak English less than very well
White (Caucasian) - Speak only English Native:
94.2% (4,333)Foreign-born:
12.2% (119)
White (Caucasian) - Speak another language Native:
6.0% (276)Foreign-born:
83.0% (811)
Black or African American - Speak only English Native:
80.2% (3,605)Foreign-born:
27.0% (459)
Black or African American - Speak another language Native:
21.5% (969)Foreign-born:
73.7% (1,255)
Asian - Speak only English Native:
53.2% (686)Foreign-born:
12.2% (381)
Asian - Speak another language Native:
46.5% (600)Foreign-born:
87.7% (2,737)
Other race - Speak only English Native:
79.2% (480)Foreign-born:
5.8% (41)
Other race - Speak another language Native:
31.7% (192)Foreign-born:
93.7% (663)
Two or more races - Speak only English Native:
69.3% (1,727)Foreign-born:
2.3% (27)
Two or more races - Speak another language Native:
31.0% (773)Foreign-born:
97.8% (1,136)
White alone - Speak only English Native:
97.1% (4,236)Foreign-born:
15.2% (129)
White alone - Speak another language Native:
3.1% (136)Foreign-born:
83.0% (707)
Hispanic or Latino - Speak only English Native:
55.8% (1,042)Foreign-born:
0.8% (13)
Hispanic or Latino - Speak another language Native:
45.8% (857)Foreign-born:
99.1% (1,639)
Foreign-born residents in Lorton 7,488 residents are foreign born (16.2% Asia , 8.4% Africa , 7.9% Latin America ).
This city:
34.2%Virginia:
12.6%
Marital status for residents in Lorton Marital status - White (Caucasian) population 15 years and over
Males 29.9% Never married62.0% Now married1.4% Separated2.3% Widowed4.5% DivorcedFemales 25.7% Never married60.1% Now married0.0% Separated8.9% Widowed5.3% DivorcedWomen who gave birth in the past 12 months Now married:
82.0% (94)Unmarried:
18.0% (20)
Women who did not give birth in the past 12 months Now married:
60.3% (889)Unmarried:
39.7% (584)
Marital status - Black or African American population 15 years and over
Males 43.8% Never married48.4% Now married0.5% Separated3.4% Widowed3.9% DivorcedFemales 40.7% Never married39.9% Now married3.0% Separated4.9% Widowed11.5% DivorcedWomen who did not give birth in the past 12 months Now married:
44.8% (773)Unmarried:
55.2% (950)
Marital status - Asian population 15 years and over
Males 19.1% Never married78.7% Now married0.5% Separated0.0% Widowed1.6% DivorcedFemales 27.4% Never married66.2% Now married0.0% Separated3.2% Widowed3.2% DivorcedWomen who gave birth in the past 12 months Now married:
100.0% (16)Unmarried:
0.0% (0)
Women who did not give birth in the past 12 months Now married:
62.4% (915)Unmarried:
37.6% (552)
Marital status - Other race population 15 years and over
Males 35.6% Never married45.9% Now married0.0% Separated0.0% Widowed18.5% DivorcedFemales 23.8% Never married50.8% Now married10.5% Separated3.8% Widowed11.1% DivorcedWomen who did not give birth in the past 12 months Now married:
57.5% (211)Unmarried:
42.5% (156)
Marital status - Two or more races population 15 years and over
Males 29.9% Never married68.1% Now married0.0% Separated0.0% Widowed2.0% DivorcedFemales 49.3% Never married34.3% Now married0.0% Separated11.1% Widowed5.2% DivorcedWomen who did not give birth in the past 12 months Now married:
31.0% (348)Unmarried:
69.0% (773)
Marital status - White alone, not Hispanic / Latino population 15 years and over
Males 30.2% Never married61.7% Now married1.0% Separated2.2% Widowed5.0% DivorcedFemales 21.3% Never married62.2% Now married0.0% Separated10.7% Widowed5.7% DivorcedWomen who gave birth in the past 12 months Now married:
82.0% (102)Unmarried:
18.0% (22)
Women who did not give birth in the past 12 months Now married:
66.3% (834)Unmarried:
33.7% (424)
Marital status - Hispanic or Latino population 15 years and over
Males 30.9% Never married60.7% Now married1.0% Separated0.6% Widowed6.8% DivorcedFemales 35.7% Never married54.0% Now married8.0% Separated1.3% Widowed1.0% DivorcedWomen who did not give birth in the past 12 months Now married:
53.7% (588)Unmarried:
46.3% (507)
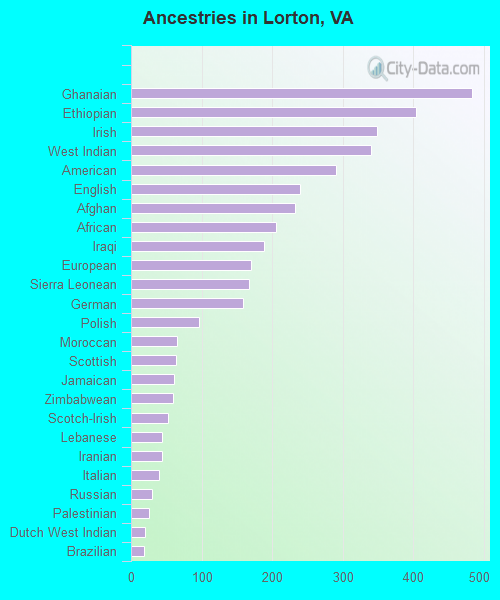
Ancestries in Lorton
483 3.7% Ghanaian404 3.1% Ethiopian348 2.6% Irish340 2.6% West Indian291 2.2% American240 1.8% English233 1.8% Afghan205 1.5% African189 1.4% Iraqi170 1.3% European167 1.3% Sierra Leonean158 1.2% German96 0.7% Polish65 0.5% Moroccan64 0.5% Scottish61 0.5% Jamaican60 0.5% Zimbabwean53 0.4% Scotch-Irish44 0.3% Lebanese44 0.3% Iranian39 0.3% Italian30 0.2% Russian26 0.2% Palestinian20 0.2% Dutch West Indian18 0.1% Brazilian16 0.1% British15 0.1% Eastern European9 0.07% Norwegian9 0.07% Slovak9 0.07% Welsh5 0.04% Pennsylvania German4 0.03% Canadian2 0.02% French
Geographical mobility in Lorton Same house 1 year ago 5,181 83.9% White (Caucasian)5,316 83.3% Black or African American4,375 94.3% Asian1,318 91.8% Other race2,896 75.0% Two or more races4,646 83.7% White alone, not Hispanic / Latino3,060 79.6% Hispanic or LatinoMoved within same county 430 7.0% White / Caucasian376 5.9% Black or African American113 2.4% Asian64 4.5% Other race448 11.6% Two or more races470 8.5% White alone, not Hispanic / Latino442 11.5% Hispanic or LatinoMoved within same state 168 2.7% White / Caucasian51 0.8% Black or African American14 0.3% Asian56 3.9% Other race21 0.5% Two or more races78 1.4% White alone, not Hispanic / Latino142 3.7% Hispanic or LatinoMoved from different state 323 5.2% White / Caucasian747 11.7% Black or African American58 1.2% Asian413 10.7% Two or more races307 5.5% White alone, not Hispanic / Latino123 3.2% Hispanic or LatinoMoved from abroad 67 1.1% White47 0.7% Black or African American49 1.1% Asian83 2.1% Two or more races45 0.8% White alone, not Hispanic / Latino97 2.5% Hispanic or Latino
Children Nativity (place of birth) in Lorton
Children under 6 years - Living with two parents Both parents native 156 100.0% NativeBoth parents foreign-born 653 100.0% NativeOne native, one foreign-born parent 370 100.0% NativeChildren under 6 years - Living with one parent Native parent 122 100.0% NativeForeign-born parent 184 100.0% NativeChildren 6 to 17 years - Living with two parents Both parents native 1,559 100.0% NativeBoth parents foreign-born 1,283 87.5% Native184 12.5% Foreign-bornOne native, one foreign-born parent 519 100.0% NativeChildren 6 to 17 years - Living with one parent Native parent 640 100.0% NativeForeign-born parent 280 52.0% Native259 48.0% Foreign-born
Grandparents responsible for own grandchildren in Lorton
Grandparents (30 to 59 years) White / Caucasian 5 27.0% Responsible for grandchildren15 73.0% Not responsible for grandchildrenBlack or African American 23 100.0% Responsible for grandchildrenAsian 57 100.0% Not responsible for grandchildrenOther race 132 100.0% Not responsible for grandchildrenWhite alone, not Hispanic / Latino 10 100.0% Responsible for grandchildrenHispanic or Latino 102 100.0% Not responsible for grandchildrenGrandparents (60 years and over) White / Caucasian 41 67.5% Responsible for grandchildren20 32.5% Not responsible for grandchildrenBlack or African American 119 100.0% Not responsible for grandchildrenAsian 280 100.0% Not responsible for grandchildrenOther race 158 100.0% Not responsible for grandchildrenWhite alone, not Hispanic / Latino 16 41.9% Responsible for grandchildren22 58.1% Not responsible for grandchildrenHispanic or Latino 38 26.7% Responsible for grandchildren104 73.3% Not responsible for grandchildren