Races in Longmeadow, Massachusetts (MA) Detailed Stats
Data:
Races - White alone (%)
Races - White alone (% change since 2000)
Races - Black alone (%)
Races - Black alone (% change since 2000)
Races - American Indian alone (%)
Races - American Indian alone (% change since 2000)
Races - Asian alone (%)
Races - Asian alone (% change since 2000)
Races - Hispanic (%)
Races - Hispanic (% change since 2000)
Races - Native Hawaiian and Other Pacific Islander alone (%)
Races - Native Hawaiian and Other Pacific Islander alone (% change since 2000)
Races - Two or more races(%)
Races - Two or more races(% change since 2000)
Races - Other race alone (%)
Races - Other race alone (% change since 2000)
Racial diversity
Place of birth - Born in state of residence (%)
Place of birth - Born in state of residence (%) - White
Place of birth - Born in state of residence (%) - Black or African American
Place of birth - Born in state of residence (%) - Asian
Place of birth - Born in state of residence (%) - Hispanic or Latino
Place of birth - Born in state of residence (%) - American Indian and Alaska Native
Place of birth - Born in state of residence (%) - Multirace
Place of birth - Born in state of residence (%) - Other Race
Place of birth - Born in other state (%)
Place of birth - Born in other state (%) - White
Place of birth - Born in other state (%) - Black or African American
Place of birth - Born in other state (%) - Asian
Place of birth - Born in other state (%) - Hispanic or Latino
Place of birth - Born in other state (%) - American Indian and Alaska Native
Place of birth - Born in other state (%) - Multirace
Place of birth - Born in other state (%) - Other Race
Place of birth - Native, outside of US (%)
Place of birth - Native, outside of US (%) - White
Place of birth - Native, outside of US (%) - Black or African American
Place of birth - Native, outside of US (%) - Asian
Place of birth - Native, outside of US (%) - Hispanic or Latino
Place of birth - Native, outside of US (%) - American Indian and Alaska Native
Place of birth - Native, outside of US (%) - Multirace
Place of birth - Native, outside of US (%) - Other Race
Place of birth - Foreign born (%)
Place of birth - Foreign born (%) - White
Place of birth - Foreign born (%) - Black or African American
Place of birth - Foreign born (%) - Asian
Place of birth - Foreign born (%) - Hispanic or Latino
Place of birth - Foreign born (%) - American Indian and Alaska Native
Place of birth - Foreign born (%) - Multirace
Place of birth - Foreign born (%) - Other Race
Residents speaking English at home (%)
Residents speaking English at home - Born in the United States (%)
Residents speaking English at home - Native, born elsewhere (%)
Residents speaking English at home - Foreign born (%)
Residents speaking Spanish at home (%)
Residents speaking Spanish at home - Born in the United States (%)
Residents speaking Spanish at home - Native, born elsewhere (%)
Residents speaking Spanish at home - Foreign born (%)
Residents speaking other language at home (%)
Residents speaking other language at home - Born in the United States (%)
Residents speaking other language at home - Native, born elsewhere (%)
Residents speaking other language at home - Foreign born (%)
Marital status - Never married (%)
Marital status - Now married (%)
Marital status - Separated (%)
Marital status - Widowed (%)
Marital status - Divorced (%)
Ancestries Reported - Arab (%)
Ancestries Reported - Czech (%)
Ancestries Reported - Danish (%)
Ancestries Reported - Dutch (%)
Ancestries Reported - English (%)
Ancestries Reported - French (%)
Ancestries Reported - French Canadian (%)
Ancestries Reported - German (%)
Ancestries Reported - Greek (%)
Ancestries Reported - Hungarian (%)
Ancestries Reported - Irish (%)
Ancestries Reported - Italian (%)
Ancestries Reported - Lithuanian (%)
Ancestries Reported - Norwegian (%)
Ancestries Reported - Polish (%)
Ancestries Reported - Portuguese (%)
Ancestries Reported - Russian (%)
Ancestries Reported - Scotch-Irish (%)
Ancestries Reported - Scottish (%)
Ancestries Reported - Slovak (%)
Ancestries Reported - Subsaharan African (%)
Ancestries Reported - Swedish (%)
Ancestries Reported - Swiss (%)
Ancestries Reported - Ukrainian (%)
Ancestries Reported - United States (%)
Ancestries Reported - Welsh (%)
Ancestries Reported - West Indian (%)
Ancestries Reported - Other (%)
Geographical mobility - Same house 1 year ago (%)
Geographical mobility - Same house 1 year ago (%) - White
Geographical mobility - Same house 1 year ago (%) - Black or African American
Geographical mobility - Same house 1 year ago (%) - Asian
Geographical mobility - Same house 1 year ago (%) - Hispanic or Latino
Geographical mobility - Same house 1 year ago (%) - American Indian and Alaska Native
Geographical mobility - Same house 1 year ago (%) - Multirace
Geographical mobility - Same house 1 year ago (%) - Other Race
Geographical mobility - Moved within same county (%)
Geographical mobility - Moved within same county (%) - White
Geographical mobility - Moved within same county (%) - Black or African American
Geographical mobility - Moved within same county (%) - Asian
Geographical mobility - Moved within same county (%) - Hispanic or Latino
Geographical mobility - Moved within same county (%) - American Indian and Alaska Native
Geographical mobility - Moved within same county (%) - Multirace
Geographical mobility - Moved within same county (%) - Other Race
Geographical mobility - Moved from different county within same state (%)
Geographical mobility - Moved from different county within same state (%) - White
Geographical mobility - Moved from different county within same state (%) - Black or African American
Geographical mobility - Moved from different county within same state (%) - Asian
Geographical mobility - Moved from different county within same state (%) - Hispanic or Latino
Geographical mobility - Moved from different county within same state (%) - American Indian and Alaska Native
Geographical mobility - Moved from different county within same state (%) - Multirace
Geographical mobility - Moved from different county within same state (%) - Other Race
Geographical mobility - Moved from different state (%)
Geographical mobility - Moved from different state (%) - White
Geographical mobility - Moved from different state (%) - Black or African American
Geographical mobility - Moved from different state (%) - Asian
Geographical mobility - Moved from different state (%) - Hispanic or Latino
Geographical mobility - Moved from different state (%) - American Indian and Alaska Native
Geographical mobility - Moved from different state (%) - Multirace
Geographical mobility - Moved from different state (%) - Other Race
Geographical mobility - Moved from abroad (%)
Geographical mobility - Moved from abroad (%) - White
Geographical mobility - Moved from abroad (%) - Black or African American
Geographical mobility - Moved from abroad (%) - Asian
Geographical mobility - Moved from abroad (%) - Hispanic or Latino
Geographical mobility - Moved from abroad (%) - American Indian and Alaska Native
Geographical mobility - Moved from abroad (%) - Multirace
Geographical mobility - Moved from abroad (%) - Other Race
Place of birth for the foreign-born population - Ireland (%)
Place of birth for the foreign-born population - Denmark (%)
Place of birth for the foreign-born population - Norway (%)
Place of birth for the foreign-born population - Sweden (%)
Place of birth for the foreign-born population - United Kingdom (%)
Place of birth for the foreign-born population - England (%)
Place of birth for the foreign-born population - Scotland (%)
Place of birth for the foreign-born population - Other Northern Europe (%)
Place of birth for the foreign-born population - Austria (%)
Place of birth for the foreign-born population - Belgium (%)
Place of birth for the foreign-born population - France (%)
Place of birth for the foreign-born population - Germany (%)
Place of birth for the foreign-born population - Netherlands (%)
Place of birth for the foreign-born population - Switzerland (%)
Place of birth for the foreign-born population - Other Western Europe (%)
Place of birth for the foreign-born population - Greece (%)
Place of birth for the foreign-born population - Italy (%)
Place of birth for the foreign-born population - Portugal (%)
Place of birth for the foreign-born population - Spain (%)
Place of birth for the foreign-born population - Other Southern Europe (%)
Place of birth for the foreign-born population - Albania (%)
Place of birth for the foreign-born population - Belarus (%)
Place of birth for the foreign-born population - Bosnia and Herzegovina (%)
Place of birth for the foreign-born population - Bulgaria (%)
Place of birth for the foreign-born population - Croatia (%)
Place of birth for the foreign-born population - Czechoslovakia (%)
Place of birth for the foreign-born population - Hungary (%)
Place of birth for the foreign-born population - Latvia (%)
Place of birth for the foreign-born population - Lithuania (%)
Place of birth for the foreign-born population - North Macedonia (Macedonia) (%)
Place of birth for the foreign-born population - Moldova (%)
Place of birth for the foreign-born population - Poland (%)
Place of birth for the foreign-born population - Romania (%)
Place of birth for the foreign-born population - Russia (%)
Place of birth for the foreign-born population - Serbia (%)
Place of birth for the foreign-born population - Ukraine (%)
Place of birth for the foreign-born population - Other Eastern Europe (%)
Place of birth for the foreign-born population - China (%)
Place of birth for the foreign-born population - Hong Kong (%)
Place of birth for the foreign-born population - Taiwan (%)
Place of birth for the foreign-born population - Japan (%)
Place of birth for the foreign-born population - Korea (%)
Place of birth for the foreign-born population - Other Eastern Asia (%)
Place of birth for the foreign-born population - Afghanistan (%)
Place of birth for the foreign-born population - Bangladesh (%)
Place of birth for the foreign-born population - India (%)
Place of birth for the foreign-born population - Iran (%)
Place of birth for the foreign-born population - Kazakhstan (%)
Place of birth for the foreign-born population - Nepal (%)
Place of birth for the foreign-born population - Pakistan (%)
Place of birth for the foreign-born population - Sri Lanka (%)
Place of birth for the foreign-born population - Uzbekistan (%)
Place of birth for the foreign-born population - Other South Central Asia (%)
Place of birth for the foreign-born population - Burma (%)
Place of birth for the foreign-born population - Cambodia (%)
Place of birth for the foreign-born population - Indonesia (%)
Place of birth for the foreign-born population - Laos (%)
Place of birth for the foreign-born population - Malaysia (%)
Place of birth for the foreign-born population - Philippines (%)
Place of birth for the foreign-born population - Singapore (%)
Place of birth for the foreign-born population - Thailand (%)
Place of birth for the foreign-born population - Vietnam (%)
Place of birth for the foreign-born population - Other South Eastern Asia (%)
Place of birth for the foreign-born population - Armenia (%)
Place of birth for the foreign-born population - Iraq (%)
Place of birth for the foreign-born population - Israel (%)
Place of birth for the foreign-born population - Jordan (%)
Place of birth for the foreign-born population - Kuwait (%)
Place of birth for the foreign-born population - Lebanon (%)
Place of birth for the foreign-born population - Saudi Arabia (%)
Place of birth for the foreign-born population - Syria (%)
Place of birth for the foreign-born population - Turkey (%)
Place of birth for the foreign-born population - Yemen (%)
Place of birth for the foreign-born population - Other Western Asia (%)
Place of birth for the foreign-born population - Eritrea (%)
Place of birth for the foreign-born population - Ethiopia (%)
Place of birth for the foreign-born population - Kenya (%)
Place of birth for the foreign-born population - Somalia (%)
Place of birth for the foreign-born population - Uganda (%)
Place of birth for the foreign-born population - Zimbabwe (%)
Place of birth for the foreign-born population - Other Eastern Africa (%)
Place of birth for the foreign-born population - Cameroon (%)
Place of birth for the foreign-born population - Congo (%)
Place of birth for the foreign-born population - Democratic Republic of Congo (Zaire) (%)
Place of birth for the foreign-born population - Other Middle Africa (%)
Place of birth for the foreign-born population - Egypt (%)
Place of birth for the foreign-born population - Morocco (%)
Place of birth for the foreign-born population - Sudan (%)
Place of birth for the foreign-born population - Other Northern Africa (%)
Place of birth for the foreign-born population - South Africa (%)
Place of birth for the foreign-born population - Other Southern Africa (%)
Place of birth for the foreign-born population - Cabo Verde (%)
Place of birth for the foreign-born population - Ghana (%)
Place of birth for the foreign-born population - Liberia (%)
Place of birth for the foreign-born population - Nigeria (%)
Place of birth for the foreign-born population - Senegal (%)
Place of birth for the foreign-born population - Sierra Leone (%)
Place of birth for the foreign-born population - Other Western Africa (%)
Place of birth for the foreign-born population - Australia (%)
Place of birth for the foreign-born population - New Zealand (%)
Place of birth for the foreign-born population - Fiji (%)
Place of birth for the foreign-born population - Micronesia (%)
Place of birth for the foreign-born population - Bahamas (%)
Place of birth for the foreign-born population - Barbados (%)
Place of birth for the foreign-born population - Cuba (%)
Place of birth for the foreign-born population - Dominica (%)
Place of birth for the foreign-born population - Dominican Republic (%)
Place of birth for the foreign-born population - Grenada (%)
Place of birth for the foreign-born population - Haiti (%)
Place of birth for the foreign-born population - Jamaica (%)
Place of birth for the foreign-born population - St. Vincent and the Grenadines (%)
Place of birth for the foreign-born population - Trinidad and Tobago (%)
Place of birth for the foreign-born population - West Indies (%)
Place of birth for the foreign-born population - Other Caribbean (%)
Place of birth for the foreign-born population - Belize (%)
Place of birth for the foreign-born population - Costa Rica (%)
Place of birth for the foreign-born population - El Salvador (%)
Place of birth for the foreign-born population - Guatemala (%)
Place of birth for the foreign-born population - Honduras (%)
Place of birth for the foreign-born population - Mexico (%)
Place of birth for the foreign-born population - Nicaragua (%)
Place of birth for the foreign-born population - Panama (%)
Place of birth for the foreign-born population - Other Central America (%)
Place of birth for the foreign-born population - Argentina (%)
Place of birth for the foreign-born population - Bolivia (%)
Place of birth for the foreign-born population - Brazil (%)
Place of birth for the foreign-born population - Chile (%)
Place of birth for the foreign-born population - Colombia (%)
Place of birth for the foreign-born population - Ecuador (%)
Place of birth for the foreign-born population - Guyana (%)
Place of birth for the foreign-born population - Peru (%)
Place of birth for the foreign-born population - Uruguay (%)
Place of birth for the foreign-born population - Venezuela (%)
Place of birth for the foreign-born population - Other South America (%)
Place of birth for the foreign-born population - Canada (%)
Place of birth for the foreign-born population - Other Northern America (%)
Place of birth for the foreign-born population - Other (%)
Latest news about races in Longmeadow, MA collected exclusively by city-data.com from local newspapers, TV, and radio stations
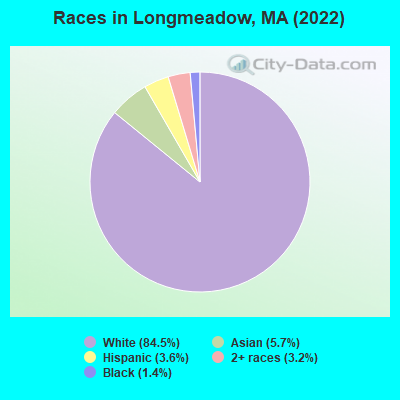
According to 2022 data, the most numerous races in Longmeadow, MA are White alone (13,237 residents), Hispanic (565 residents), and Asian alone (886 residents). 87.7% of Longmeadow residents speak English at home. 13.3% of Longmeadow, MA residents are foreign-born (6.0% born in Asia, 3.9% born in Europe, 1.7% born in North America), which is 35.5% less than the foreign-born rate of 18.0% across the entire state of Massachusetts.
Race distribution in Longmeadow
2000 2022
5,198,359 81.9% White alone 428,729 6.8% Hispanic 318,329 5.0% Black alone 236,786 3.7% Asian alone 110,338 1.7% Two or more races 43,586 0.7% Other race alone 11,264 0.2% American Indian alone 1,706 0.03% Native Hawaiian and Other
4,676,627 67.0% White alone 911,038 13.0% Hispanic 501,463 7.2% Asian alone 459,740 6.6% Black alone 341,889 4.9% Two or more races 84,403 1.2% Other race alone 5,838 0.08% American Indian alone 976 0.01% Native Hawaiian and Other
Income and house value in Longmeadow Median household income in 2022 $132,691 White non-Hispanic householders$153,425 Black householdersover $200,000 Asian householders$132,695 Two or more races householders$152,571 Hispanic or Latino race householdersMedian 2022 house value $447,464 White Non-Hispanic householders$390,944 Black or African American householders$418,869 American Indian or Alaska Native householders $574,577 Asian householders$212,227 Some other race householders$502,643 Two or more races householders$221,163 Hispanic or Latino householders
Median age by race in Longmeadow
48.9 Median age for White residents45.7 50.4 30.3 Median age for Black or African American residents30.0 21.7 -655,238,094.6 Median age for American Indian / Alaska Native residents-649,474,688.9 -657,223,795.4 46.7 Median age for Asian residents51.0 43.0 -514,227,641.8 Median age for Native Hawaiian / Pacific Islander residents-666,666,666.0 -508,717,948.2 39.3 Median age for Other race residents-713,286,712.6 38.6 16.9 Median age for Two or more races residents28.7 15.9 47.2 Median age for White alone residents43.6 49.0 21.1 Median age for Hispanic or Latino residents30.9 19.4
Owner/renter occupied households by race in Longmeadow
House owners and renters - White residents 4,674 94.1% Owner occupied295 5.9% Renter occupiedHouse owners and renters - Black or African American residents 101 100.0% Owner occupiedHouse owners and renters - Asian residents 280 100.0% Owner occupiedHouse owners and renters - Two or more races residents 81 41.5% Owner occupied115 58.5% Renter occupiedHouse owners and renters - White alone residents 4,663 92.4% Owner occupied384 7.6% Renter occupiedHouse owners and renters - Hispanic or Latino residents 119 66.1% Owner occupied61 33.9% Renter occupied
Language usage in Longmeadow
English speakers - Total 87.7% of residents of Longmeadow speak English at home.
1.5% of residents speak Spanish at home 203 91.9% Speak English very well18 8.1% Speak English less than very well11.1% of residents speak other language at home 1,251 76.3% Speak English very well389 23.7% Speak English less than very well
English speakers - Born in the United States 96.7% of residents of Longmeadow speak English at home.
1.5% of residents speak Spanish at home 76 100.0% Speak English very well2.7% of residents speak other language at home 136 100.0% Speak English very well
All residents speak only English at home
English speakers - Foreign-born 33.8% of residents of Longmeadow speak English at home.
4.8% of residents speak Spanish at home 98 100.0% Speak English very well57.4% of residents speak other language at home 811 68.8% Speak English very well367 31.2% Speak English less than very well
White (Caucasian) - Speak only English Native:
100.0% (10,455)Foreign-born:
49.1% (528)
White (Caucasian) - Speak another language Native:
1.7% (179)Foreign-born:
48.5% (522)
Black or African American - Speak only English Native:
96.0% (166)Foreign-born:
33.6% (7)
Black or African American - Speak another language Native:
5.2% (9)Foreign-born:
65.9% (15)
Asian - Speak only English Native:
76.9% (77)Foreign-born:
7.8% (59)
Asian - Speak another language Native:
28.9% (29)Foreign-born:
92.3% (698)
Two or more races - Speak only English Native:
81.3% (571)Foreign-born:
16.3% (29)
Two or more races - Speak another language Native:
14.5% (102)Foreign-born:
83.6% (150)
White alone - Speak only English Native:
96.2% (10,960)Foreign-born:
47.1% (523)
White alone - Speak another language Native:
3.8% (431)Foreign-born:
49.6% (551)
Hispanic or Latino - Speak only English Native:
90.4% (338)Foreign-born:
38.6% (51)
Hispanic or Latino - Speak another language Native:
19.3% (72)Foreign-born:
67.4% (89)
Foreign-born residents in Longmeadow 2,081 residents are foreign born (6.0% Asia , 3.9% Europe , 1.7% North America ).
This city:
13.3%Massachusetts:
17.6%
Marital status for residents in Longmeadow Marital status - White (Caucasian) population 15 years and over
Males 26.6% Never married64.2% Now married0.2% Separated2.7% Widowed6.3% DivorcedFemales 20.2% Never married55.8% Now married1.0% Separated11.9% Widowed11.1% DivorcedWomen who gave birth in the past 12 months Now married:
100.0% (119)Unmarried:
0.0% (0)
Women who did not give birth in the past 12 months Now married:
52.8% (1,116)Unmarried:
47.2% (997)
Marital status - Black or African American population 15 years and over
Males 0.9% Never married99.1% Now married0.0% Separated0.0% Widowed0.0% DivorcedFemales 81.0% Never married0.0% Now married0.0% Separated0.0% Widowed19.0% DivorcedWomen who did not give birth in the past 12 months Now married:
0.0% (0)Unmarried:
100.0% (48)
Marital status - Asian population 15 years and over
Males 16.4% Never married81.2% Now married0.0% Separated0.0% Widowed2.4% DivorcedFemales 6.7% Never married70.5% Now married0.0% Separated21.0% Widowed1.8% DivorcedWomen who gave birth in the past 12 months Now married:
100.0% (8)Unmarried:
0.0% (0)
Women who did not give birth in the past 12 months Now married:
83.7% (175)Unmarried:
16.3% (34)
Marital status - Two or more races population 15 years and over
Males 25.7% Never married74.3% Now married0.0% Separated0.0% Widowed0.0% DivorcedFemales 69.4% Never married20.6% Now married0.0% Separated5.9% Widowed4.1% DivorcedWomen who did not give birth in the past 12 months Now married:
7.8% (14)Unmarried:
92.2% (168)
Marital status - White alone, not Hispanic / Latino population 15 years and over
Males 26.6% Never married64.1% Now married0.2% Separated2.8% Widowed6.3% DivorcedFemales 20.2% Never married56.3% Now married1.0% Separated12.0% Widowed10.5% DivorcedWomen who gave birth in the past 12 months Now married:
100.0% (137)Unmarried:
0.0% (0)
Women who did not give birth in the past 12 months Now married:
52.7% (1,252)Unmarried:
47.3% (1,124)
Marital status - Hispanic or Latino population 15 years and over
Males 10.8% Never married89.2% Now married0.0% Separated0.0% Widowed0.0% DivorcedFemales 46.5% Never married22.3% Now married0.0% Separated4.5% Widowed26.7% DivorcedWomen who did not give birth in the past 12 months Now married:
34.1% (45)Unmarried:
65.9% (88)
Ancestries in Longmeadow
985 15.8% Irish790 12.7% Italian548 8.8% American378 6.1% Polish340 5.4% Canadian229 3.7% German206 3.3% Russian202 3.2% French Canadian199 3.2% English182 2.9% Greek124 2.0% European124 2.0% French104 1.7% Eastern European89 1.4% Iranian41 0.7% Portuguese31 0.5% Israeli29 0.5% Swedish25 0.4% Lebanese25 0.4% Scottish23 0.4% Ukrainian19 0.3% Austrian18 0.3% Scotch-Irish17 0.3% Lithuanian14 0.2% Hungarian14 0.2% Albanian14 0.2% Jamaican12 0.2% Jordanian11 0.2% Haitian9 0.1% Australian7 0.1% Nigerian6 0.10% Iraqi5 0.08% Arab4 0.06% Northern European4 0.06% British2 0.03% Slavic
Children Nativity (place of birth) in Longmeadow
Children under 6 years - Living with two parents Both parents native 596 100.0% NativeBoth parents foreign-born 108 95.9% Native5 4.1% Foreign-bornOne native, one foreign-born parent 308 100.0% NativeChildren under 6 years - Living with one parent Native parent 5 100.0% NativeForeign-born parent 13 100.0% NativeChildren 6 to 17 years - Living with two parents Both parents native 1,484 99.1% Native14 0.9% Foreign-bornBoth parents foreign-born 353 88.7% Native45 11.3% Foreign-bornOne native, one foreign-born parent 351 94.7% Native20 5.3% Foreign-bornChildren 6 to 17 years - Living with one parent Native parent 410 100.0% NativeForeign-born parent 33 50.6% Native32 49.4% Foreign-born