Races in Linganore, Maryland (MD) Detailed Stats
Data:
Races - White alone (%)
Races - White alone (% change since 2000)
Races - Black alone (%)
Races - Black alone (% change since 2000)
Races - American Indian alone (%)
Races - American Indian alone (% change since 2000)
Races - Asian alone (%)
Races - Asian alone (% change since 2000)
Races - Hispanic (%)
Races - Hispanic (% change since 2000)
Races - Native Hawaiian and Other Pacific Islander alone (%)
Races - Native Hawaiian and Other Pacific Islander alone (% change since 2000)
Races - Two or more races(%)
Races - Two or more races(% change since 2000)
Races - Other race alone (%)
Races - Other race alone (% change since 2000)
Racial diversity
Place of birth - Born in state of residence (%)
Place of birth - Born in state of residence (%) - White
Place of birth - Born in state of residence (%) - Black or African American
Place of birth - Born in state of residence (%) - Asian
Place of birth - Born in state of residence (%) - Hispanic or Latino
Place of birth - Born in state of residence (%) - American Indian and Alaska Native
Place of birth - Born in state of residence (%) - Multirace
Place of birth - Born in state of residence (%) - Other Race
Place of birth - Born in other state (%)
Place of birth - Born in other state (%) - White
Place of birth - Born in other state (%) - Black or African American
Place of birth - Born in other state (%) - Asian
Place of birth - Born in other state (%) - Hispanic or Latino
Place of birth - Born in other state (%) - American Indian and Alaska Native
Place of birth - Born in other state (%) - Multirace
Place of birth - Born in other state (%) - Other Race
Place of birth - Native, outside of US (%)
Place of birth - Native, outside of US (%) - White
Place of birth - Native, outside of US (%) - Black or African American
Place of birth - Native, outside of US (%) - Asian
Place of birth - Native, outside of US (%) - Hispanic or Latino
Place of birth - Native, outside of US (%) - American Indian and Alaska Native
Place of birth - Native, outside of US (%) - Multirace
Place of birth - Native, outside of US (%) - Other Race
Place of birth - Foreign born (%)
Place of birth - Foreign born (%) - White
Place of birth - Foreign born (%) - Black or African American
Place of birth - Foreign born (%) - Asian
Place of birth - Foreign born (%) - Hispanic or Latino
Place of birth - Foreign born (%) - American Indian and Alaska Native
Place of birth - Foreign born (%) - Multirace
Place of birth - Foreign born (%) - Other Race
Residents speaking English at home (%)
Residents speaking English at home - Born in the United States (%)
Residents speaking English at home - Native, born elsewhere (%)
Residents speaking English at home - Foreign born (%)
Residents speaking Spanish at home (%)
Residents speaking Spanish at home - Born in the United States (%)
Residents speaking Spanish at home - Native, born elsewhere (%)
Residents speaking Spanish at home - Foreign born (%)
Residents speaking other language at home (%)
Residents speaking other language at home - Born in the United States (%)
Residents speaking other language at home - Native, born elsewhere (%)
Residents speaking other language at home - Foreign born (%)
Marital status - Never married (%)
Marital status - Now married (%)
Marital status - Separated (%)
Marital status - Widowed (%)
Marital status - Divorced (%)
Ancestries Reported - Arab (%)
Ancestries Reported - Czech (%)
Ancestries Reported - Danish (%)
Ancestries Reported - Dutch (%)
Ancestries Reported - English (%)
Ancestries Reported - French (%)
Ancestries Reported - French Canadian (%)
Ancestries Reported - German (%)
Ancestries Reported - Greek (%)
Ancestries Reported - Hungarian (%)
Ancestries Reported - Irish (%)
Ancestries Reported - Italian (%)
Ancestries Reported - Lithuanian (%)
Ancestries Reported - Norwegian (%)
Ancestries Reported - Polish (%)
Ancestries Reported - Portuguese (%)
Ancestries Reported - Russian (%)
Ancestries Reported - Scotch-Irish (%)
Ancestries Reported - Scottish (%)
Ancestries Reported - Slovak (%)
Ancestries Reported - Subsaharan African (%)
Ancestries Reported - Swedish (%)
Ancestries Reported - Swiss (%)
Ancestries Reported - Ukrainian (%)
Ancestries Reported - United States (%)
Ancestries Reported - Welsh (%)
Ancestries Reported - West Indian (%)
Ancestries Reported - Other (%)
Geographical mobility - Same house 1 year ago (%)
Geographical mobility - Same house 1 year ago (%) - White
Geographical mobility - Same house 1 year ago (%) - Black or African American
Geographical mobility - Same house 1 year ago (%) - Asian
Geographical mobility - Same house 1 year ago (%) - Hispanic or Latino
Geographical mobility - Same house 1 year ago (%) - American Indian and Alaska Native
Geographical mobility - Same house 1 year ago (%) - Multirace
Geographical mobility - Same house 1 year ago (%) - Other Race
Geographical mobility - Moved within same county (%)
Geographical mobility - Moved within same county (%) - White
Geographical mobility - Moved within same county (%) - Black or African American
Geographical mobility - Moved within same county (%) - Asian
Geographical mobility - Moved within same county (%) - Hispanic or Latino
Geographical mobility - Moved within same county (%) - American Indian and Alaska Native
Geographical mobility - Moved within same county (%) - Multirace
Geographical mobility - Moved within same county (%) - Other Race
Geographical mobility - Moved from different county within same state (%)
Geographical mobility - Moved from different county within same state (%) - White
Geographical mobility - Moved from different county within same state (%) - Black or African American
Geographical mobility - Moved from different county within same state (%) - Asian
Geographical mobility - Moved from different county within same state (%) - Hispanic or Latino
Geographical mobility - Moved from different county within same state (%) - American Indian and Alaska Native
Geographical mobility - Moved from different county within same state (%) - Multirace
Geographical mobility - Moved from different county within same state (%) - Other Race
Geographical mobility - Moved from different state (%)
Geographical mobility - Moved from different state (%) - White
Geographical mobility - Moved from different state (%) - Black or African American
Geographical mobility - Moved from different state (%) - Asian
Geographical mobility - Moved from different state (%) - Hispanic or Latino
Geographical mobility - Moved from different state (%) - American Indian and Alaska Native
Geographical mobility - Moved from different state (%) - Multirace
Geographical mobility - Moved from different state (%) - Other Race
Geographical mobility - Moved from abroad (%)
Geographical mobility - Moved from abroad (%) - White
Geographical mobility - Moved from abroad (%) - Black or African American
Geographical mobility - Moved from abroad (%) - Asian
Geographical mobility - Moved from abroad (%) - Hispanic or Latino
Geographical mobility - Moved from abroad (%) - American Indian and Alaska Native
Geographical mobility - Moved from abroad (%) - Multirace
Geographical mobility - Moved from abroad (%) - Other Race
Place of birth for the foreign-born population - Ireland (%)
Place of birth for the foreign-born population - Denmark (%)
Place of birth for the foreign-born population - Norway (%)
Place of birth for the foreign-born population - Sweden (%)
Place of birth for the foreign-born population - United Kingdom (%)
Place of birth for the foreign-born population - England (%)
Place of birth for the foreign-born population - Scotland (%)
Place of birth for the foreign-born population - Other Northern Europe (%)
Place of birth for the foreign-born population - Austria (%)
Place of birth for the foreign-born population - Belgium (%)
Place of birth for the foreign-born population - France (%)
Place of birth for the foreign-born population - Germany (%)
Place of birth for the foreign-born population - Netherlands (%)
Place of birth for the foreign-born population - Switzerland (%)
Place of birth for the foreign-born population - Other Western Europe (%)
Place of birth for the foreign-born population - Greece (%)
Place of birth for the foreign-born population - Italy (%)
Place of birth for the foreign-born population - Portugal (%)
Place of birth for the foreign-born population - Spain (%)
Place of birth for the foreign-born population - Other Southern Europe (%)
Place of birth for the foreign-born population - Albania (%)
Place of birth for the foreign-born population - Belarus (%)
Place of birth for the foreign-born population - Bosnia and Herzegovina (%)
Place of birth for the foreign-born population - Bulgaria (%)
Place of birth for the foreign-born population - Croatia (%)
Place of birth for the foreign-born population - Czechoslovakia (%)
Place of birth for the foreign-born population - Hungary (%)
Place of birth for the foreign-born population - Latvia (%)
Place of birth for the foreign-born population - Lithuania (%)
Place of birth for the foreign-born population - North Macedonia (Macedonia) (%)
Place of birth for the foreign-born population - Moldova (%)
Place of birth for the foreign-born population - Poland (%)
Place of birth for the foreign-born population - Romania (%)
Place of birth for the foreign-born population - Russia (%)
Place of birth for the foreign-born population - Serbia (%)
Place of birth for the foreign-born population - Ukraine (%)
Place of birth for the foreign-born population - Other Eastern Europe (%)
Place of birth for the foreign-born population - China (%)
Place of birth for the foreign-born population - Hong Kong (%)
Place of birth for the foreign-born population - Taiwan (%)
Place of birth for the foreign-born population - Japan (%)
Place of birth for the foreign-born population - Korea (%)
Place of birth for the foreign-born population - Other Eastern Asia (%)
Place of birth for the foreign-born population - Afghanistan (%)
Place of birth for the foreign-born population - Bangladesh (%)
Place of birth for the foreign-born population - India (%)
Place of birth for the foreign-born population - Iran (%)
Place of birth for the foreign-born population - Kazakhstan (%)
Place of birth for the foreign-born population - Nepal (%)
Place of birth for the foreign-born population - Pakistan (%)
Place of birth for the foreign-born population - Sri Lanka (%)
Place of birth for the foreign-born population - Uzbekistan (%)
Place of birth for the foreign-born population - Other South Central Asia (%)
Place of birth for the foreign-born population - Burma (%)
Place of birth for the foreign-born population - Cambodia (%)
Place of birth for the foreign-born population - Indonesia (%)
Place of birth for the foreign-born population - Laos (%)
Place of birth for the foreign-born population - Malaysia (%)
Place of birth for the foreign-born population - Philippines (%)
Place of birth for the foreign-born population - Singapore (%)
Place of birth for the foreign-born population - Thailand (%)
Place of birth for the foreign-born population - Vietnam (%)
Place of birth for the foreign-born population - Other South Eastern Asia (%)
Place of birth for the foreign-born population - Armenia (%)
Place of birth for the foreign-born population - Iraq (%)
Place of birth for the foreign-born population - Israel (%)
Place of birth for the foreign-born population - Jordan (%)
Place of birth for the foreign-born population - Kuwait (%)
Place of birth for the foreign-born population - Lebanon (%)
Place of birth for the foreign-born population - Saudi Arabia (%)
Place of birth for the foreign-born population - Syria (%)
Place of birth for the foreign-born population - Turkey (%)
Place of birth for the foreign-born population - Yemen (%)
Place of birth for the foreign-born population - Other Western Asia (%)
Place of birth for the foreign-born population - Eritrea (%)
Place of birth for the foreign-born population - Ethiopia (%)
Place of birth for the foreign-born population - Kenya (%)
Place of birth for the foreign-born population - Somalia (%)
Place of birth for the foreign-born population - Uganda (%)
Place of birth for the foreign-born population - Zimbabwe (%)
Place of birth for the foreign-born population - Other Eastern Africa (%)
Place of birth for the foreign-born population - Cameroon (%)
Place of birth for the foreign-born population - Congo (%)
Place of birth for the foreign-born population - Democratic Republic of Congo (Zaire) (%)
Place of birth for the foreign-born population - Other Middle Africa (%)
Place of birth for the foreign-born population - Egypt (%)
Place of birth for the foreign-born population - Morocco (%)
Place of birth for the foreign-born population - Sudan (%)
Place of birth for the foreign-born population - Other Northern Africa (%)
Place of birth for the foreign-born population - South Africa (%)
Place of birth for the foreign-born population - Other Southern Africa (%)
Place of birth for the foreign-born population - Cabo Verde (%)
Place of birth for the foreign-born population - Ghana (%)
Place of birth for the foreign-born population - Liberia (%)
Place of birth for the foreign-born population - Nigeria (%)
Place of birth for the foreign-born population - Senegal (%)
Place of birth for the foreign-born population - Sierra Leone (%)
Place of birth for the foreign-born population - Other Western Africa (%)
Place of birth for the foreign-born population - Australia (%)
Place of birth for the foreign-born population - New Zealand (%)
Place of birth for the foreign-born population - Fiji (%)
Place of birth for the foreign-born population - Micronesia (%)
Place of birth for the foreign-born population - Bahamas (%)
Place of birth for the foreign-born population - Barbados (%)
Place of birth for the foreign-born population - Cuba (%)
Place of birth for the foreign-born population - Dominica (%)
Place of birth for the foreign-born population - Dominican Republic (%)
Place of birth for the foreign-born population - Grenada (%)
Place of birth for the foreign-born population - Haiti (%)
Place of birth for the foreign-born population - Jamaica (%)
Place of birth for the foreign-born population - St. Vincent and the Grenadines (%)
Place of birth for the foreign-born population - Trinidad and Tobago (%)
Place of birth for the foreign-born population - West Indies (%)
Place of birth for the foreign-born population - Other Caribbean (%)
Place of birth for the foreign-born population - Belize (%)
Place of birth for the foreign-born population - Costa Rica (%)
Place of birth for the foreign-born population - El Salvador (%)
Place of birth for the foreign-born population - Guatemala (%)
Place of birth for the foreign-born population - Honduras (%)
Place of birth for the foreign-born population - Mexico (%)
Place of birth for the foreign-born population - Nicaragua (%)
Place of birth for the foreign-born population - Panama (%)
Place of birth for the foreign-born population - Other Central America (%)
Place of birth for the foreign-born population - Argentina (%)
Place of birth for the foreign-born population - Bolivia (%)
Place of birth for the foreign-born population - Brazil (%)
Place of birth for the foreign-born population - Chile (%)
Place of birth for the foreign-born population - Colombia (%)
Place of birth for the foreign-born population - Ecuador (%)
Place of birth for the foreign-born population - Guyana (%)
Place of birth for the foreign-born population - Peru (%)
Place of birth for the foreign-born population - Uruguay (%)
Place of birth for the foreign-born population - Venezuela (%)
Place of birth for the foreign-born population - Other South America (%)
Place of birth for the foreign-born population - Canada (%)
Place of birth for the foreign-born population - Other Northern America (%)
Place of birth for the foreign-born population - Other (%)
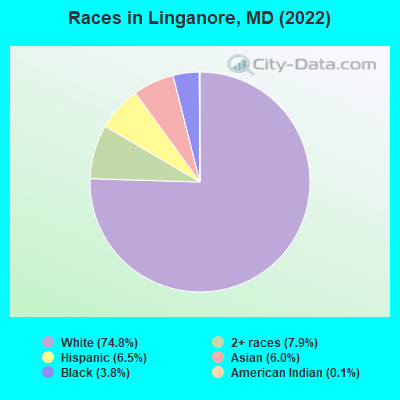
According to 2022 data, the most numerous races in Linganore, MD are White alone (9,306 residents), Black alone (474 residents), and Hispanic (809 residents). 87.1% of Linganore residents speak English at home.
Race distribution in Linganore 9,306 74.8% White alone 977 7.9% Two or more races 809 6.5% Hispanic 744 6.0% Asian alone 474 3.8% Black alone 14 0.1% American Indian alone
2000 2022
3,286,547 62.1% White alone 1,464,735 27.7% Black alone 227,916 4.3% Hispanic 209,738 4.0% Asian alone 82,946 1.6% Two or more races 13,312 0.3% American Indian alone 9,379 0.2% Other race alone 1,913 0.04% Native Hawaiian and Other
2,906,492 47.1% White alone 1,800,914 29.2% Black alone 705,842 11.4% Hispanic 401,818 6.5% Asian alone 291,317 4.7% Two or more races 46,930 0.8% Other race alone 8,930 0.1% American Indian alone 2,417 0.04% Native Hawaiian and Other
Income and house value in Linganore Median household income in 2022 $153,693 White non-Hispanic householdersover $200,000 Black householders$164,285 Asian householdersover $200,000 Two or more races householders$157,876 Hispanic or Latino race householders
Median age by race in Linganore
38.7 Median age for White residents36.7 40.4 37.3 Median age for Black or African American residents35.7 45.5 29.4 Median age for American Indian / Alaska Native residents39.2 -532,350,531.8 40.7 Median age for Asian residents41.1 39.5 -763,333,332.6 Median age for Native Hawaiian / Pacific Islander residents-720,061,021.4 -760,942,760.2 -585,034,013.0 Median age for Other race residents-619,607,842.5 -568,115,941.5 25.7 Median age for Two or more races residents17.5 31.4 38.0 Median age for White alone residents35.9 39.5 22.5 Median age for Hispanic or Latino residents27.6 22.4
Owner/renter occupied households by race in Linganore
House owners and renters - White residents 3,228 94.2% Owner occupied200 5.8% Renter occupiedHouse owners and renters - Black or African American residents 139 90.2% Owner occupied15 9.8% Renter occupiedHouse owners and renters - American Indian / Alaska Native residents 19 100.0% Owner occupiedHouse owners and renters - Asian residents 254 100.0% Owner occupiedHouse owners and renters - Two or more races residents 222 93.8% Owner occupied15 6.2% Renter occupiedHouse owners and renters - White alone residents 3,237 93.9% Owner occupied211 6.1% Renter occupiedHouse owners and renters - Hispanic or Latino residents 122 100.0% Owner occupied
Language usage in Linganore
English speakers - Total 87.1% of residents of Linganore speak English at home.
3.0% of residents speak Spanish at home 313 91.5% Speak English very well29 8.5% Speak English less than very well9.3% of residents speak other language at home 844 78.7% Speak English very well228 21.3% Speak English less than very well
English speakers - Born in the United States 95.1% of residents of Linganore speak English at home.
1.7% of residents speak Spanish at home 84 100.0% Speak English very well1.6% of residents speak other language at home 55 67.9% Speak English very well26 32.1% Speak English less than very well
All residents speak only English at home
English speakers - Foreign-born 15.7% of residents of Linganore speak English at home.
13.1% of residents speak Spanish at home 131 82.9% Speak English very well27 17.1% Speak English less than very well76.9% of residents speak other language at home 758 81.5% Speak English very well172 18.5% Speak English less than very well
White (Caucasian) - Speak only English Native:
99.3% (8,444)Foreign-born:
100.0% (115)
White (Caucasian) - Speak another language Native:
1.2% (99)Foreign-born:
30.4% (35)
Black or African American - Speak only English Native:
91.0% (366)Foreign-born:
38.5% (12)
American Indian / Alaska Native - Speak another language Native:
55.0% (15)Foreign-born:
100.0% (12)
Asian - Speak only English Native:
36.2% (51)Foreign-born:
6.2% (34)
Asian - Speak another language Native:
54.4% (77)Foreign-born:
94.3% (513)
Two or more races - Speak only English Native:
92.0% (1,015)Foreign-born:
1.1% (7)
Two or more races - Speak another language Native:
7.8% (86)Foreign-born:
100.0% (636)
White alone - Speak only English Native:
98.8% (8,399)Foreign-born:
83.2% (129)
White alone - Speak another language Native:
1.3% (111)Foreign-born:
20.7% (32)
Hispanic or Latino - Speak only English Native:
90.8% (532)Foreign-born:
3.9% (6)
Hispanic or Latino - Speak another language Native:
8.1% (47)Foreign-born:
96.8% (158)
Foreign-born residents in Linganore
Marital status for residents in Linganore Marital status - White (Caucasian) population 15 years and over
Males 24.2% Never married69.5% Now married0.8% Separated1.6% Widowed3.9% DivorcedFemales 18.6% Never married67.8% Now married2.0% Separated4.9% Widowed6.7% DivorcedWomen who gave birth in the past 12 months Now married:
100.0% (188)Unmarried:
0.0% (0)
Women who did not give birth in the past 12 months Now married:
64.8% (1,234)Unmarried:
35.2% (671)
Marital status - Black or African American population 15 years and over
Males 46.3% Never married36.6% Now married7.0% Separated0.0% Widowed10.1% DivorcedFemales 0.0% Never married79.1% Now married0.0% Separated0.0% Widowed20.9% DivorcedWomen who gave birth in the past 12 months Now married:
100.0% (6)Unmarried:
0.0% (0)
Women who did not give birth in the past 12 months Now married:
100.0% (93)Unmarried:
0.0% (0)
Marital status - American Indian / Alaska Native population 15 years and over
Males 0.0% Never married100.0% Now married0.0% Separated0.0% Widowed0.0% DivorcedFemales 0.0% Never married0.0% Now married0.0% Separated0.0% Widowed100.0% DivorcedWomen who did not give birth in the past 12 months Now married:
0.0% (0)Unmarried:
100.0% (10)
Marital status - Asian population 15 years and over
Males 9.0% Never married82.9% Now married0.0% Separated0.0% Widowed8.1% DivorcedFemales 5.6% Never married82.7% Now married0.0% Separated11.7% Widowed0.0% DivorcedWomen who gave birth in the past 12 months Now married:
100.0% (48)Unmarried:
0.0% (0)
Women who did not give birth in the past 12 months Now married:
90.4% (123)Unmarried:
9.6% (13)
Marital status - Other race population 15 years and over
Males 100.0% Never married0.0% Now married0.0% Separated0.0% Widowed0.0% DivorcedFemales 0.0% Never married100.0% Now married0.0% Separated0.0% Widowed0.0% DivorcedMarital status - Two or more races population 15 years and over
Males 11.8% Never married80.8% Now married0.0% Separated0.0% Widowed7.4% DivorcedFemales 19.1% Never married71.5% Now married0.0% Separated0.0% Widowed9.4% DivorcedWomen who did not give birth in the past 12 months Now married:
64.9% (230)Unmarried:
35.1% (124)
Marital status - White alone, not Hispanic / Latino population 15 years and over
Males 24.0% Never married69.7% Now married0.8% Separated1.6% Widowed3.9% DivorcedFemales 18.6% Never married67.5% Now married2.0% Separated5.0% Widowed6.9% DivorcedWomen who gave birth in the past 12 months Now married:
100.0% (198)Unmarried:
0.0% (0)
Women who did not give birth in the past 12 months Now married:
64.2% (1,240)Unmarried:
35.8% (691)
Marital status - Hispanic or Latino population 15 years and over
Males 22.2% Never married67.2% Now married0.0% Separated0.0% Widowed10.6% DivorcedFemales 30.7% Never married66.2% Now married0.0% Separated0.0% Widowed3.1% DivorcedWomen who did not give birth in the past 12 months Now married:
56.2% (115)Unmarried:
43.8% (89)
Ancestries in Linganore
516 13.1% Irish358 9.1% English341 8.7% German290 7.4% American259 6.6% Italian128 3.3% South African118 3.0% European113 2.9% Polish54 1.4% Ukrainian46 1.2% Norwegian36 0.9% Eastern European35 0.9% Scottish33 0.8% Lebanese33 0.8% Canadian29 0.7% Croatian24 0.6% Czech18 0.5% British15 0.4% Scotch-Irish13 0.3% French Canadian11 0.3% Hungarian11 0.3% Iranian11 0.3% Russian11 0.3% Swedish10 0.3% Slovak9 0.2% African7 0.2% Dutch5 0.1% French
Children Nativity (place of birth) in Linganore
Children under 6 years - Living with two parents Both parents native 934 100.0% NativeBoth parents foreign-born 197 100.0% NativeOne native, one foreign-born parent 86 100.0% NativeChildren under 6 years - Living with one parent Native parent 45 100.0% NativeForeign-born parent 4 100.0% NativeChildren 6 to 17 years - Living with two parents Both parents native 1,919 99.7% Native6 0.3% Foreign-bornBoth parents foreign-born 197 93.4% Native14 6.6% Foreign-bornOne native, one foreign-born parent 137 100.0% NativeChildren 6 to 17 years - Living with one parent Native parent 254 100.0% Native
Grandparents responsible for own grandchildren in Linganore
Grandparents (30 to 59 years) White / Caucasian 4 100.0% Responsible for grandchildrenBlack or African American 7 100.0% Responsible for grandchildrenWhite alone, not Hispanic / Latino 4 100.0% Responsible for grandchildren
Grandparents (60 years and over) White / Caucasian 107 100.0% Not responsible for grandchildrenWhite alone, not Hispanic / Latino 118 100.0% Not responsible for grandchildren