Races in Lindenhurst, New York (NY) Detailed Stats
Data:
Races - White alone (%)
Races - White alone (% change since 2000)
Races - Black alone (%)
Races - Black alone (% change since 2000)
Races - American Indian alone (%)
Races - American Indian alone (% change since 2000)
Races - Asian alone (%)
Races - Asian alone (% change since 2000)
Races - Hispanic (%)
Races - Hispanic (% change since 2000)
Races - Native Hawaiian and Other Pacific Islander alone (%)
Races - Native Hawaiian and Other Pacific Islander alone (% change since 2000)
Races - Two or more races(%)
Races - Two or more races(% change since 2000)
Races - Other race alone (%)
Races - Other race alone (% change since 2000)
Racial diversity
Place of birth - Born in state of residence (%)
Place of birth - Born in state of residence (%) - White
Place of birth - Born in state of residence (%) - Black or African American
Place of birth - Born in state of residence (%) - Asian
Place of birth - Born in state of residence (%) - Hispanic or Latino
Place of birth - Born in state of residence (%) - American Indian and Alaska Native
Place of birth - Born in state of residence (%) - Multirace
Place of birth - Born in state of residence (%) - Other Race
Place of birth - Born in other state (%)
Place of birth - Born in other state (%) - White
Place of birth - Born in other state (%) - Black or African American
Place of birth - Born in other state (%) - Asian
Place of birth - Born in other state (%) - Hispanic or Latino
Place of birth - Born in other state (%) - American Indian and Alaska Native
Place of birth - Born in other state (%) - Multirace
Place of birth - Born in other state (%) - Other Race
Place of birth - Native, outside of US (%)
Place of birth - Native, outside of US (%) - White
Place of birth - Native, outside of US (%) - Black or African American
Place of birth - Native, outside of US (%) - Asian
Place of birth - Native, outside of US (%) - Hispanic or Latino
Place of birth - Native, outside of US (%) - American Indian and Alaska Native
Place of birth - Native, outside of US (%) - Multirace
Place of birth - Native, outside of US (%) - Other Race
Place of birth - Foreign born (%)
Place of birth - Foreign born (%) - White
Place of birth - Foreign born (%) - Black or African American
Place of birth - Foreign born (%) - Asian
Place of birth - Foreign born (%) - Hispanic or Latino
Place of birth - Foreign born (%) - American Indian and Alaska Native
Place of birth - Foreign born (%) - Multirace
Place of birth - Foreign born (%) - Other Race
Residents speaking English at home (%)
Residents speaking English at home - Born in the United States (%)
Residents speaking English at home - Native, born elsewhere (%)
Residents speaking English at home - Foreign born (%)
Residents speaking Spanish at home (%)
Residents speaking Spanish at home - Born in the United States (%)
Residents speaking Spanish at home - Native, born elsewhere (%)
Residents speaking Spanish at home - Foreign born (%)
Residents speaking other language at home (%)
Residents speaking other language at home - Born in the United States (%)
Residents speaking other language at home - Native, born elsewhere (%)
Residents speaking other language at home - Foreign born (%)
Marital status - Never married (%)
Marital status - Now married (%)
Marital status - Separated (%)
Marital status - Widowed (%)
Marital status - Divorced (%)
Ancestries Reported - Arab (%)
Ancestries Reported - Czech (%)
Ancestries Reported - Danish (%)
Ancestries Reported - Dutch (%)
Ancestries Reported - English (%)
Ancestries Reported - French (%)
Ancestries Reported - French Canadian (%)
Ancestries Reported - German (%)
Ancestries Reported - Greek (%)
Ancestries Reported - Hungarian (%)
Ancestries Reported - Irish (%)
Ancestries Reported - Italian (%)
Ancestries Reported - Lithuanian (%)
Ancestries Reported - Norwegian (%)
Ancestries Reported - Polish (%)
Ancestries Reported - Portuguese (%)
Ancestries Reported - Russian (%)
Ancestries Reported - Scotch-Irish (%)
Ancestries Reported - Scottish (%)
Ancestries Reported - Slovak (%)
Ancestries Reported - Subsaharan African (%)
Ancestries Reported - Swedish (%)
Ancestries Reported - Swiss (%)
Ancestries Reported - Ukrainian (%)
Ancestries Reported - United States (%)
Ancestries Reported - Welsh (%)
Ancestries Reported - West Indian (%)
Ancestries Reported - Other (%)
Geographical mobility - Same house 1 year ago (%)
Geographical mobility - Same house 1 year ago (%) - White
Geographical mobility - Same house 1 year ago (%) - Black or African American
Geographical mobility - Same house 1 year ago (%) - Asian
Geographical mobility - Same house 1 year ago (%) - Hispanic or Latino
Geographical mobility - Same house 1 year ago (%) - American Indian and Alaska Native
Geographical mobility - Same house 1 year ago (%) - Multirace
Geographical mobility - Same house 1 year ago (%) - Other Race
Geographical mobility - Moved within same county (%)
Geographical mobility - Moved within same county (%) - White
Geographical mobility - Moved within same county (%) - Black or African American
Geographical mobility - Moved within same county (%) - Asian
Geographical mobility - Moved within same county (%) - Hispanic or Latino
Geographical mobility - Moved within same county (%) - American Indian and Alaska Native
Geographical mobility - Moved within same county (%) - Multirace
Geographical mobility - Moved within same county (%) - Other Race
Geographical mobility - Moved from different county within same state (%)
Geographical mobility - Moved from different county within same state (%) - White
Geographical mobility - Moved from different county within same state (%) - Black or African American
Geographical mobility - Moved from different county within same state (%) - Asian
Geographical mobility - Moved from different county within same state (%) - Hispanic or Latino
Geographical mobility - Moved from different county within same state (%) - American Indian and Alaska Native
Geographical mobility - Moved from different county within same state (%) - Multirace
Geographical mobility - Moved from different county within same state (%) - Other Race
Geographical mobility - Moved from different state (%)
Geographical mobility - Moved from different state (%) - White
Geographical mobility - Moved from different state (%) - Black or African American
Geographical mobility - Moved from different state (%) - Asian
Geographical mobility - Moved from different state (%) - Hispanic or Latino
Geographical mobility - Moved from different state (%) - American Indian and Alaska Native
Geographical mobility - Moved from different state (%) - Multirace
Geographical mobility - Moved from different state (%) - Other Race
Geographical mobility - Moved from abroad (%)
Geographical mobility - Moved from abroad (%) - White
Geographical mobility - Moved from abroad (%) - Black or African American
Geographical mobility - Moved from abroad (%) - Asian
Geographical mobility - Moved from abroad (%) - Hispanic or Latino
Geographical mobility - Moved from abroad (%) - American Indian and Alaska Native
Geographical mobility - Moved from abroad (%) - Multirace
Geographical mobility - Moved from abroad (%) - Other Race
Place of birth for the foreign-born population - Ireland (%)
Place of birth for the foreign-born population - Denmark (%)
Place of birth for the foreign-born population - Norway (%)
Place of birth for the foreign-born population - Sweden (%)
Place of birth for the foreign-born population - United Kingdom (%)
Place of birth for the foreign-born population - England (%)
Place of birth for the foreign-born population - Scotland (%)
Place of birth for the foreign-born population - Other Northern Europe (%)
Place of birth for the foreign-born population - Austria (%)
Place of birth for the foreign-born population - Belgium (%)
Place of birth for the foreign-born population - France (%)
Place of birth for the foreign-born population - Germany (%)
Place of birth for the foreign-born population - Netherlands (%)
Place of birth for the foreign-born population - Switzerland (%)
Place of birth for the foreign-born population - Other Western Europe (%)
Place of birth for the foreign-born population - Greece (%)
Place of birth for the foreign-born population - Italy (%)
Place of birth for the foreign-born population - Portugal (%)
Place of birth for the foreign-born population - Spain (%)
Place of birth for the foreign-born population - Other Southern Europe (%)
Place of birth for the foreign-born population - Albania (%)
Place of birth for the foreign-born population - Belarus (%)
Place of birth for the foreign-born population - Bosnia and Herzegovina (%)
Place of birth for the foreign-born population - Bulgaria (%)
Place of birth for the foreign-born population - Croatia (%)
Place of birth for the foreign-born population - Czechoslovakia (%)
Place of birth for the foreign-born population - Hungary (%)
Place of birth for the foreign-born population - Latvia (%)
Place of birth for the foreign-born population - Lithuania (%)
Place of birth for the foreign-born population - North Macedonia (Macedonia) (%)
Place of birth for the foreign-born population - Moldova (%)
Place of birth for the foreign-born population - Poland (%)
Place of birth for the foreign-born population - Romania (%)
Place of birth for the foreign-born population - Russia (%)
Place of birth for the foreign-born population - Serbia (%)
Place of birth for the foreign-born population - Ukraine (%)
Place of birth for the foreign-born population - Other Eastern Europe (%)
Place of birth for the foreign-born population - China (%)
Place of birth for the foreign-born population - Hong Kong (%)
Place of birth for the foreign-born population - Taiwan (%)
Place of birth for the foreign-born population - Japan (%)
Place of birth for the foreign-born population - Korea (%)
Place of birth for the foreign-born population - Other Eastern Asia (%)
Place of birth for the foreign-born population - Afghanistan (%)
Place of birth for the foreign-born population - Bangladesh (%)
Place of birth for the foreign-born population - India (%)
Place of birth for the foreign-born population - Iran (%)
Place of birth for the foreign-born population - Kazakhstan (%)
Place of birth for the foreign-born population - Nepal (%)
Place of birth for the foreign-born population - Pakistan (%)
Place of birth for the foreign-born population - Sri Lanka (%)
Place of birth for the foreign-born population - Uzbekistan (%)
Place of birth for the foreign-born population - Other South Central Asia (%)
Place of birth for the foreign-born population - Burma (%)
Place of birth for the foreign-born population - Cambodia (%)
Place of birth for the foreign-born population - Indonesia (%)
Place of birth for the foreign-born population - Laos (%)
Place of birth for the foreign-born population - Malaysia (%)
Place of birth for the foreign-born population - Philippines (%)
Place of birth for the foreign-born population - Singapore (%)
Place of birth for the foreign-born population - Thailand (%)
Place of birth for the foreign-born population - Vietnam (%)
Place of birth for the foreign-born population - Other South Eastern Asia (%)
Place of birth for the foreign-born population - Armenia (%)
Place of birth for the foreign-born population - Iraq (%)
Place of birth for the foreign-born population - Israel (%)
Place of birth for the foreign-born population - Jordan (%)
Place of birth for the foreign-born population - Kuwait (%)
Place of birth for the foreign-born population - Lebanon (%)
Place of birth for the foreign-born population - Saudi Arabia (%)
Place of birth for the foreign-born population - Syria (%)
Place of birth for the foreign-born population - Turkey (%)
Place of birth for the foreign-born population - Yemen (%)
Place of birth for the foreign-born population - Other Western Asia (%)
Place of birth for the foreign-born population - Eritrea (%)
Place of birth for the foreign-born population - Ethiopia (%)
Place of birth for the foreign-born population - Kenya (%)
Place of birth for the foreign-born population - Somalia (%)
Place of birth for the foreign-born population - Uganda (%)
Place of birth for the foreign-born population - Zimbabwe (%)
Place of birth for the foreign-born population - Other Eastern Africa (%)
Place of birth for the foreign-born population - Cameroon (%)
Place of birth for the foreign-born population - Congo (%)
Place of birth for the foreign-born population - Democratic Republic of Congo (Zaire) (%)
Place of birth for the foreign-born population - Other Middle Africa (%)
Place of birth for the foreign-born population - Egypt (%)
Place of birth for the foreign-born population - Morocco (%)
Place of birth for the foreign-born population - Sudan (%)
Place of birth for the foreign-born population - Other Northern Africa (%)
Place of birth for the foreign-born population - South Africa (%)
Place of birth for the foreign-born population - Other Southern Africa (%)
Place of birth for the foreign-born population - Cabo Verde (%)
Place of birth for the foreign-born population - Ghana (%)
Place of birth for the foreign-born population - Liberia (%)
Place of birth for the foreign-born population - Nigeria (%)
Place of birth for the foreign-born population - Senegal (%)
Place of birth for the foreign-born population - Sierra Leone (%)
Place of birth for the foreign-born population - Other Western Africa (%)
Place of birth for the foreign-born population - Australia (%)
Place of birth for the foreign-born population - New Zealand (%)
Place of birth for the foreign-born population - Fiji (%)
Place of birth for the foreign-born population - Micronesia (%)
Place of birth for the foreign-born population - Bahamas (%)
Place of birth for the foreign-born population - Barbados (%)
Place of birth for the foreign-born population - Cuba (%)
Place of birth for the foreign-born population - Dominica (%)
Place of birth for the foreign-born population - Dominican Republic (%)
Place of birth for the foreign-born population - Grenada (%)
Place of birth for the foreign-born population - Haiti (%)
Place of birth for the foreign-born population - Jamaica (%)
Place of birth for the foreign-born population - St. Vincent and the Grenadines (%)
Place of birth for the foreign-born population - Trinidad and Tobago (%)
Place of birth for the foreign-born population - West Indies (%)
Place of birth for the foreign-born population - Other Caribbean (%)
Place of birth for the foreign-born population - Belize (%)
Place of birth for the foreign-born population - Costa Rica (%)
Place of birth for the foreign-born population - El Salvador (%)
Place of birth for the foreign-born population - Guatemala (%)
Place of birth for the foreign-born population - Honduras (%)
Place of birth for the foreign-born population - Mexico (%)
Place of birth for the foreign-born population - Nicaragua (%)
Place of birth for the foreign-born population - Panama (%)
Place of birth for the foreign-born population - Other Central America (%)
Place of birth for the foreign-born population - Argentina (%)
Place of birth for the foreign-born population - Bolivia (%)
Place of birth for the foreign-born population - Brazil (%)
Place of birth for the foreign-born population - Chile (%)
Place of birth for the foreign-born population - Colombia (%)
Place of birth for the foreign-born population - Ecuador (%)
Place of birth for the foreign-born population - Guyana (%)
Place of birth for the foreign-born population - Peru (%)
Place of birth for the foreign-born population - Uruguay (%)
Place of birth for the foreign-born population - Venezuela (%)
Place of birth for the foreign-born population - Other South America (%)
Place of birth for the foreign-born population - Canada (%)
Place of birth for the foreign-born population - Other Northern America (%)
Place of birth for the foreign-born population - Other (%)
Latest news about races in Lindenhurst, NY collected exclusively by city-data.com from local newspapers, TV, and radio stations
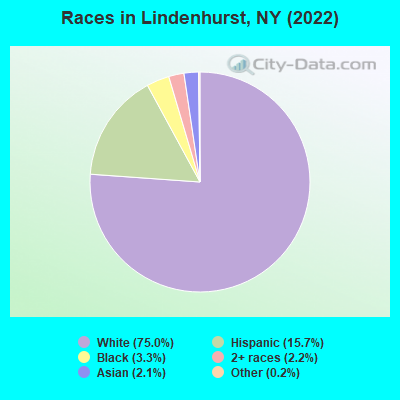
According to 2022 data, the most numerous races in Lindenhurst, NY are White alone (20,372 residents), Hispanic (4,269 residents), and Black alone (884 residents). 75.7% of Lindenhurst residents speak English at home. 14.1% of Lindenhurst, NY residents are foreign-born (7.5% born in Europe, 5.3% born in Latin America), which is 56.2% less than the foreign-born rate of 22.0% across the entire state of New York.
Race distribution in Lindenhurst
2000 2022
11,760,981 62.0% White alone 2,867,583 15.1% Hispanic 2,812,623 14.8% Black alone 1,035,926 5.5% Asian alone 366,116 1.9% Two or more races 75,499 0.4% Other race alone 52,499 0.3% American Indian alone 5,230 0.03% Native Hawaiian and Other
10,408,933 52.9% White alone 3,867,299 19.7% Hispanic 2,633,840 13.4% Black alone 1,776,286 9.0% Asian alone 732,670 3.7% Two or more races 216,110 1.1% Other race alone 35,082 0.2% American Indian alone 6,931 0.04% Native Hawaiian and Other
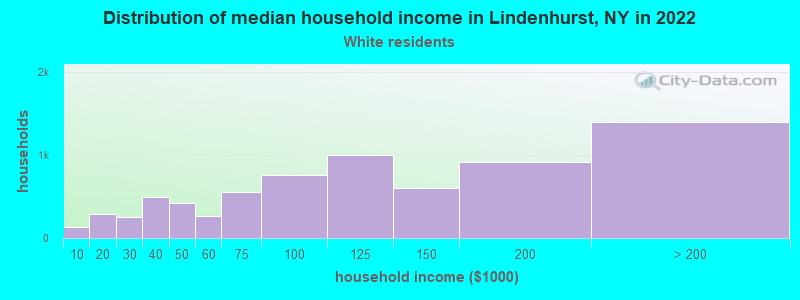
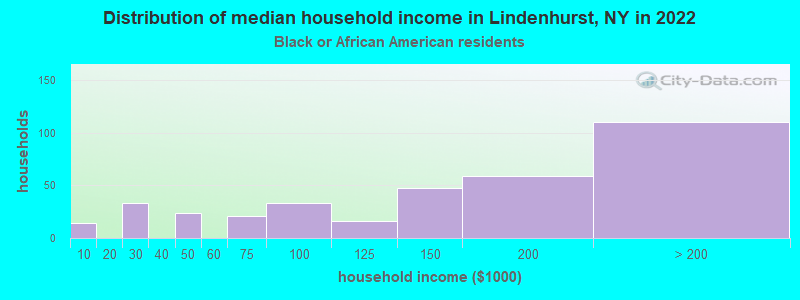
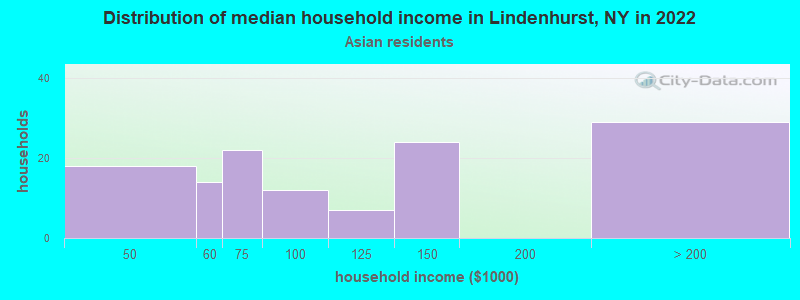
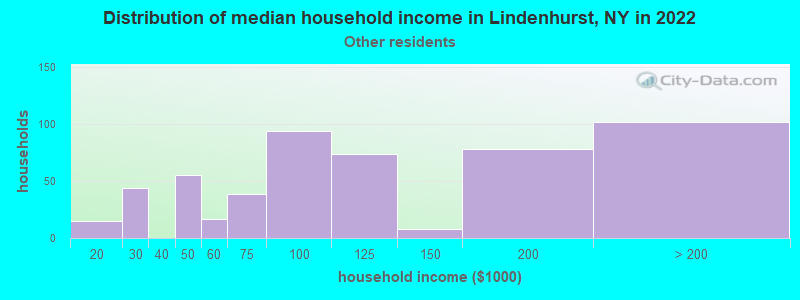
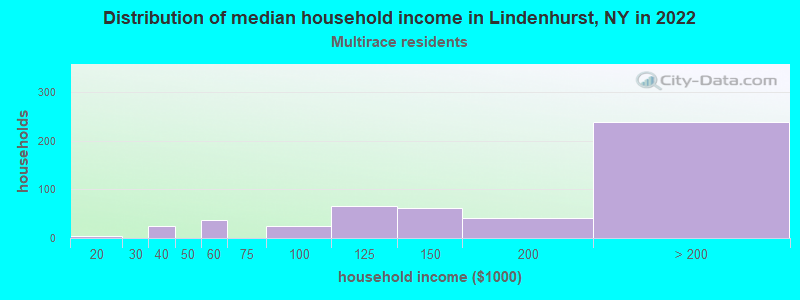
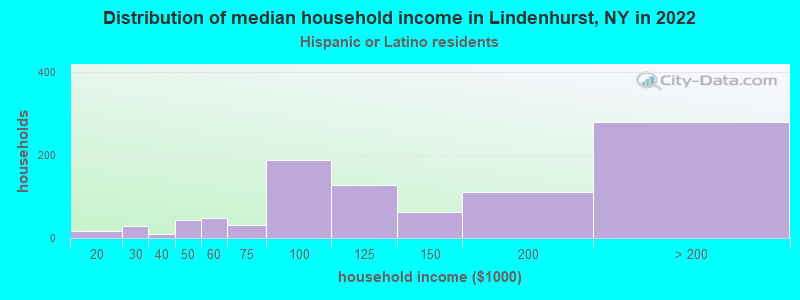
Income and house value in Lindenhurst Median household income in 2022 $110,094 White non-Hispanic householders$145,068 Black householders$93,520 Some other race householdersover $200,000 Two or more races householders$125,493 Hispanic or Latino race householdersMedian 2022 house value $502,267 White Non-Hispanic householders$784,342 Black or African American householders$582,173 American Indian or Alaska Native householders $497,460 Asian householders$610,110 Some other race householders$605,604 Two or more races householders$513,081 Hispanic or Latino householders
Median age by race in Lindenhurst
46.0 Median age for White residents43.0 49.2 29.2 Median age for Black or African American residents23.7 35.4 60.2 Median age for American Indian / Alaska Native residents-807,017,543.1 41.3 37.0 Median age for Asian residents42.9 33.3 -742,816,091.2 Median age for Native Hawaiian / Pacific Islander residents-831,187,409.8 -771,300,447.7 21.0 Median age for Other race residents15.7 27.1 34.4 Median age for Two or more races residents34.1 30.7 46.1 Median age for White alone residents43.0 48.4 29.6 Median age for Hispanic or Latino residents25.1 32.3
Owner/renter occupied households by race in Lindenhurst
House owners and renters - White residents 6,125 86.4% Owner occupied961 13.6% Renter occupiedHouse owners and renters - Black or African American residents 255 67.9% Owner occupied120 32.1% Renter occupiedHouse owners and renters - Asian residents 143 95.3% Owner occupied7 4.7% Renter occupiedHouse owners and renters - Other race residents 340 61.7% Owner occupied211 38.3% Renter occupiedHouse owners and renters - Two or more races residents 444 89.4% Owner occupied53 10.6% Renter occupiedHouse owners and renters - White alone residents 6,165 85.8% Owner occupied1,022 14.2% Renter occupiedHouse owners and renters - Hispanic or Latino residents 747 77.8% Owner occupied213 22.2% Renter occupied
Language usage in Lindenhurst
English speakers - Total 75.7% of residents of Lindenhurst speak English at home.
10.0% of residents speak Spanish at home 1,595 62.3% Speak English very well967 37.7% Speak English less than very well14.4% of residents speak other language at home 2,540 68.4% Speak English very well1,176 31.6% Speak English less than very well
English speakers - Born in the United States 93.9% of residents of Lindenhurst speak English at home.
4.8% of residents speak Spanish at home 46 100.0% Speak English very well1.7% of residents speak other language at home 7 43.8% Speak English very well9 56.2% Speak English less than very well
English speakers - Native, born elsewhere 59.3% of residents of Lindenhurst speak English at home.
31.3% of residents speak Spanish at home 134 88.2% Speak English very well18 11.8% Speak English less than very well16.7% of residents speak other language at home 81 100.0% Speak English very well
English speakers - Foreign-born 20.9% of residents of Lindenhurst speak English at home.
27.5% of residents speak Spanish at home 355 31.2% Speak English very well784 68.8% Speak English less than very well50.2% of residents speak other language at home 973 46.7% Speak English very well1,109 53.3% Speak English less than very well
White (Caucasian) - Speak only English Native:
94.3% (16,444)Foreign-born:
29.7% (504)
White (Caucasian) - Speak another language Native:
5.6% (975)Foreign-born:
70.3% (1,194)
Black or African American - Speak only English Native:
83.7% (555)Foreign-born:
67.4% (272)
Black or African American - Speak another language Native:
17.8% (118)Foreign-born:
35.2% (142)
American Indian / Alaska Native - Speak another language Native:
100.0% (34)Foreign-born:
100.0% (10)
Asian - Speak only English Native:
18.5% (56)Foreign-born:
5.6% (13)
Asian - Speak another language Native:
86.5% (261)Foreign-born:
98.4% (231)
Other race - Speak only English Native:
43.6% (659)Foreign-born:
3.9% (32)
Other race - Speak another language Native:
56.9% (860)Foreign-born:
96.8% (785)
Two or more races - Speak only English Native:
54.1% (781)Foreign-born:
10.1% (34)
Two or more races - Speak another language Native:
45.5% (657)Foreign-born:
90.2% (307)
White alone - Speak only English Native:
92.9% (16,272)Foreign-born:
22.6% (491)
White alone - Speak another language Native:
7.3% (1,275)Foreign-born:
77.3% (1,679)
Hispanic or Latino - Speak only English Native:
51.0% (1,304)Foreign-born:
7.4% (87)
Hispanic or Latino - Speak another language Native:
49.1% (1,257)Foreign-born:
92.5% (1,075)
Foreign-born residents in Lindenhurst 3,826 residents are foreign born (7.5% Europe , 5.3% Latin America ).
This city:
14.1%New York:
22.6%
Marital status for residents in Lindenhurst Marital status - White (Caucasian) population 15 years and over
Males 36.1% Never married54.3% Now married1.5% Separated2.0% Widowed6.2% DivorcedFemales 26.6% Never married51.0% Now married2.1% Separated11.2% Widowed9.0% DivorcedWomen who gave birth in the past 12 months Now married:
77.8% (127)Unmarried:
22.2% (36)
Women who did not give birth in the past 12 months Now married:
47.7% (1,832)Unmarried:
52.3% (2,008)
Marital status - Black or African American population 15 years and over
Males 50.1% Never married49.4% Now married0.5% Separated0.0% Widowed0.0% DivorcedFemales 48.8% Never married27.3% Now married3.9% Separated12.6% Widowed7.4% DivorcedWomen who gave birth in the past 12 months Now married:
100.0% (9)Unmarried:
0.0% (0)
Women who did not give birth in the past 12 months Now married:
34.2% (103)Unmarried:
65.8% (199)
Marital status - Asian population 15 years and over
Males 38.9% Never married61.1% Now married0.0% Separated0.0% Widowed0.0% DivorcedFemales 29.8% Never married42.0% Now married0.0% Separated16.5% Widowed11.8% DivorcedWomen who gave birth in the past 12 months Now married:
100.0% (23)Unmarried:
0.0% (0)
Women who did not give birth in the past 12 months Now married:
41.3% (59)Unmarried:
58.7% (84)
Marital status - Other race population 15 years and over
Males 30.6% Never married63.6% Now married0.0% Separated1.7% Widowed4.1% DivorcedFemales 38.8% Never married41.9% Now married0.0% Separated0.0% Widowed19.3% DivorcedWomen who gave birth in the past 12 months Now married:
36.2% (36)Unmarried:
63.8% (64)
Women who did not give birth in the past 12 months Now married:
38.5% (254)Unmarried:
61.5% (405)
Marital status - Two or more races population 15 years and over
Males 60.8% Never married27.1% Now married0.0% Separated0.3% Widowed11.8% DivorcedFemales 37.6% Never married43.0% Now married1.0% Separated7.9% Widowed10.5% DivorcedWomen who gave birth in the past 12 months Now married:
0.0% (0)Unmarried:
100.0% (9)
Women who did not give birth in the past 12 months Now married:
40.0% (138)Unmarried:
60.0% (206)
Marital status - White alone, not Hispanic / Latino population 15 years and over
Males 35.1% Never married55.2% Now married1.5% Separated2.0% Widowed6.1% DivorcedFemales 26.5% Never married50.6% Now married2.2% Separated11.7% Widowed9.0% DivorcedWomen who gave birth in the past 12 months Now married:
77.8% (138)Unmarried:
22.2% (39)
Women who did not give birth in the past 12 months Now married:
46.5% (1,793)Unmarried:
53.5% (2,061)
Marital status - Hispanic or Latino population 15 years and over
Males 48.4% Never married43.6% Now married0.0% Separated0.7% Widowed7.2% DivorcedFemales 35.6% Never married47.5% Now married0.0% Separated2.2% Widowed14.7% DivorcedWomen who gave birth in the past 12 months Now married:
36.2% (26)Unmarried:
63.8% (45)
Women who did not give birth in the past 12 months Now married:
46.9% (480)Unmarried:
53.1% (544)
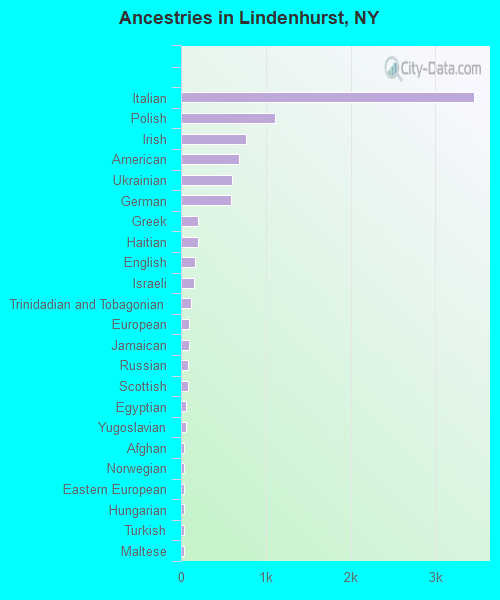
Ancestries in Lindenhurst
3,460 30.9% Italian1,111 9.9% Polish763 6.8% Irish683 6.1% American596 5.3% Ukrainian586 5.2% German199 1.8% Greek196 1.8% Haitian170 1.5% English149 1.3% Israeli113 1.0% Trinidadian and Tobagonian91 0.8% European91 0.8% Jamaican83 0.7% Russian82 0.7% Scottish64 0.6% Egyptian54 0.5% Yugoslavian41 0.4% Afghan39 0.3% Norwegian38 0.3% Eastern European37 0.3% Hungarian33 0.3% Turkish32 0.3% Maltese19 0.2% Austrian17 0.2% Albanian14 0.1% Jordanian14 0.1% Scotch-Irish13 0.1% Iranian11 0.10% French10 0.09% Swiss9 0.08% Swedish1 0.01% Nigerian
Geographical mobility in Lindenhurst Same house 1 year ago 18,922 95.1% White (Caucasian)1,013 87.1% Black or African American41 100.0% American Indian / Alaska Native452 79.4% Asian2,239 91.4% Other race1,845 96.7% Two or more races19,195 94.8% White alone, not Hispanic / Latino3,768 94.0% Hispanic or LatinoMoved within same county 749 3.8% White / Caucasian28 2.4% Black or African American68 11.9% Asian105 4.3% Other race30 1.6% Two or more races797 3.9% White alone, not Hispanic / Latino125 3.1% Hispanic or LatinoMoved within same state 215 1.1% White / Caucasian146 12.6% Black or African American42 7.4% Asian86 3.5% Other race27 1.4% Two or more races222 1.1% White alone, not Hispanic / Latino103 2.6% Hispanic or LatinoMoved from different state 19 0.1% White / Caucasian21 1.1% Two or more races20 0.1% White alone, not Hispanic / Latino5 0.1% Hispanic or LatinoMoved from abroad 21 0.1% White27 0.1% White alone, not Hispanic / Latino
Children Nativity (place of birth) in Lindenhurst
Children under 6 years - Living with two parents Both parents native 627 100.0% NativeBoth parents foreign-born 155 100.0% NativeOne native, one foreign-born parent 233 100.0% NativeChildren under 6 years - Living with one parent Native parent 522 100.0% NativeForeign-born parent 44 100.0% NativeChildren 6 to 17 years - Living with two parents Both parents native 1,462 100.0% Native0 0.0% Foreign-bornBoth parents foreign-born 646 98.1% Native13 1.9% Foreign-bornOne native, one foreign-born parent 353 100.0% NativeChildren 6 to 17 years - Living with one parent Native parent 759 100.0% NativeForeign-born parent 182 56.4% Native141 43.6% Foreign-born
Grandparents responsible for own grandchildren in Lindenhurst
Grandparents (30 to 59 years) White / Caucasian 61 73.4% Responsible for grandchildren22 26.6% Not responsible for grandchildrenOther race 48 100.0% Not responsible for grandchildrenWhite alone, not Hispanic / Latino 59 70.2% Responsible for grandchildren25 29.8% Not responsible for grandchildrenHispanic or Latino 49 100.0% Not responsible for grandchildrenGrandparents (60 years and over) White / Caucasian 114 35.6% Responsible for grandchildren205 64.4% Not responsible for grandchildrenOther race 6 100.0% Not responsible for grandchildrenWhite alone, not Hispanic / Latino 138 38.5% Responsible for grandchildren220 61.5% Not responsible for grandchildrenHispanic or Latino 1 10.1% Responsible for grandchildren12 89.9% Not responsible for grandchildren