Races in Lincoln Village, Ohio (OH) Detailed Stats
Data:
Races - White alone (%)
Races - White alone (% change since 2000)
Races - Black alone (%)
Races - Black alone (% change since 2000)
Races - American Indian alone (%)
Races - American Indian alone (% change since 2000)
Races - Asian alone (%)
Races - Asian alone (% change since 2000)
Races - Hispanic (%)
Races - Hispanic (% change since 2000)
Races - Native Hawaiian and Other Pacific Islander alone (%)
Races - Native Hawaiian and Other Pacific Islander alone (% change since 2000)
Races - Two or more races(%)
Races - Two or more races(% change since 2000)
Races - Other race alone (%)
Races - Other race alone (% change since 2000)
Racial diversity
Place of birth - Born in state of residence (%)
Place of birth - Born in state of residence (%) - White
Place of birth - Born in state of residence (%) - Black or African American
Place of birth - Born in state of residence (%) - Asian
Place of birth - Born in state of residence (%) - Hispanic or Latino
Place of birth - Born in state of residence (%) - American Indian and Alaska Native
Place of birth - Born in state of residence (%) - Multirace
Place of birth - Born in state of residence (%) - Other Race
Place of birth - Born in other state (%)
Place of birth - Born in other state (%) - White
Place of birth - Born in other state (%) - Black or African American
Place of birth - Born in other state (%) - Asian
Place of birth - Born in other state (%) - Hispanic or Latino
Place of birth - Born in other state (%) - American Indian and Alaska Native
Place of birth - Born in other state (%) - Multirace
Place of birth - Born in other state (%) - Other Race
Place of birth - Native, outside of US (%)
Place of birth - Native, outside of US (%) - White
Place of birth - Native, outside of US (%) - Black or African American
Place of birth - Native, outside of US (%) - Asian
Place of birth - Native, outside of US (%) - Hispanic or Latino
Place of birth - Native, outside of US (%) - American Indian and Alaska Native
Place of birth - Native, outside of US (%) - Multirace
Place of birth - Native, outside of US (%) - Other Race
Place of birth - Foreign born (%)
Place of birth - Foreign born (%) - White
Place of birth - Foreign born (%) - Black or African American
Place of birth - Foreign born (%) - Asian
Place of birth - Foreign born (%) - Hispanic or Latino
Place of birth - Foreign born (%) - American Indian and Alaska Native
Place of birth - Foreign born (%) - Multirace
Place of birth - Foreign born (%) - Other Race
Residents speaking English at home (%)
Residents speaking English at home - Born in the United States (%)
Residents speaking English at home - Native, born elsewhere (%)
Residents speaking English at home - Foreign born (%)
Residents speaking Spanish at home (%)
Residents speaking Spanish at home - Born in the United States (%)
Residents speaking Spanish at home - Native, born elsewhere (%)
Residents speaking Spanish at home - Foreign born (%)
Residents speaking other language at home (%)
Residents speaking other language at home - Born in the United States (%)
Residents speaking other language at home - Native, born elsewhere (%)
Residents speaking other language at home - Foreign born (%)
Marital status - Never married (%)
Marital status - Now married (%)
Marital status - Separated (%)
Marital status - Widowed (%)
Marital status - Divorced (%)
Ancestries Reported - Arab (%)
Ancestries Reported - Czech (%)
Ancestries Reported - Danish (%)
Ancestries Reported - Dutch (%)
Ancestries Reported - English (%)
Ancestries Reported - French (%)
Ancestries Reported - French Canadian (%)
Ancestries Reported - German (%)
Ancestries Reported - Greek (%)
Ancestries Reported - Hungarian (%)
Ancestries Reported - Irish (%)
Ancestries Reported - Italian (%)
Ancestries Reported - Lithuanian (%)
Ancestries Reported - Norwegian (%)
Ancestries Reported - Polish (%)
Ancestries Reported - Portuguese (%)
Ancestries Reported - Russian (%)
Ancestries Reported - Scotch-Irish (%)
Ancestries Reported - Scottish (%)
Ancestries Reported - Slovak (%)
Ancestries Reported - Subsaharan African (%)
Ancestries Reported - Swedish (%)
Ancestries Reported - Swiss (%)
Ancestries Reported - Ukrainian (%)
Ancestries Reported - United States (%)
Ancestries Reported - Welsh (%)
Ancestries Reported - West Indian (%)
Ancestries Reported - Other (%)
Geographical mobility - Same house 1 year ago (%)
Geographical mobility - Same house 1 year ago (%) - White
Geographical mobility - Same house 1 year ago (%) - Black or African American
Geographical mobility - Same house 1 year ago (%) - Asian
Geographical mobility - Same house 1 year ago (%) - Hispanic or Latino
Geographical mobility - Same house 1 year ago (%) - American Indian and Alaska Native
Geographical mobility - Same house 1 year ago (%) - Multirace
Geographical mobility - Same house 1 year ago (%) - Other Race
Geographical mobility - Moved within same county (%)
Geographical mobility - Moved within same county (%) - White
Geographical mobility - Moved within same county (%) - Black or African American
Geographical mobility - Moved within same county (%) - Asian
Geographical mobility - Moved within same county (%) - Hispanic or Latino
Geographical mobility - Moved within same county (%) - American Indian and Alaska Native
Geographical mobility - Moved within same county (%) - Multirace
Geographical mobility - Moved within same county (%) - Other Race
Geographical mobility - Moved from different county within same state (%)
Geographical mobility - Moved from different county within same state (%) - White
Geographical mobility - Moved from different county within same state (%) - Black or African American
Geographical mobility - Moved from different county within same state (%) - Asian
Geographical mobility - Moved from different county within same state (%) - Hispanic or Latino
Geographical mobility - Moved from different county within same state (%) - American Indian and Alaska Native
Geographical mobility - Moved from different county within same state (%) - Multirace
Geographical mobility - Moved from different county within same state (%) - Other Race
Geographical mobility - Moved from different state (%)
Geographical mobility - Moved from different state (%) - White
Geographical mobility - Moved from different state (%) - Black or African American
Geographical mobility - Moved from different state (%) - Asian
Geographical mobility - Moved from different state (%) - Hispanic or Latino
Geographical mobility - Moved from different state (%) - American Indian and Alaska Native
Geographical mobility - Moved from different state (%) - Multirace
Geographical mobility - Moved from different state (%) - Other Race
Geographical mobility - Moved from abroad (%)
Geographical mobility - Moved from abroad (%) - White
Geographical mobility - Moved from abroad (%) - Black or African American
Geographical mobility - Moved from abroad (%) - Asian
Geographical mobility - Moved from abroad (%) - Hispanic or Latino
Geographical mobility - Moved from abroad (%) - American Indian and Alaska Native
Geographical mobility - Moved from abroad (%) - Multirace
Geographical mobility - Moved from abroad (%) - Other Race
Place of birth for the foreign-born population - Ireland (%)
Place of birth for the foreign-born population - Denmark (%)
Place of birth for the foreign-born population - Norway (%)
Place of birth for the foreign-born population - Sweden (%)
Place of birth for the foreign-born population - United Kingdom (%)
Place of birth for the foreign-born population - England (%)
Place of birth for the foreign-born population - Scotland (%)
Place of birth for the foreign-born population - Other Northern Europe (%)
Place of birth for the foreign-born population - Austria (%)
Place of birth for the foreign-born population - Belgium (%)
Place of birth for the foreign-born population - France (%)
Place of birth for the foreign-born population - Germany (%)
Place of birth for the foreign-born population - Netherlands (%)
Place of birth for the foreign-born population - Switzerland (%)
Place of birth for the foreign-born population - Other Western Europe (%)
Place of birth for the foreign-born population - Greece (%)
Place of birth for the foreign-born population - Italy (%)
Place of birth for the foreign-born population - Portugal (%)
Place of birth for the foreign-born population - Spain (%)
Place of birth for the foreign-born population - Other Southern Europe (%)
Place of birth for the foreign-born population - Albania (%)
Place of birth for the foreign-born population - Belarus (%)
Place of birth for the foreign-born population - Bosnia and Herzegovina (%)
Place of birth for the foreign-born population - Bulgaria (%)
Place of birth for the foreign-born population - Croatia (%)
Place of birth for the foreign-born population - Czechoslovakia (%)
Place of birth for the foreign-born population - Hungary (%)
Place of birth for the foreign-born population - Latvia (%)
Place of birth for the foreign-born population - Lithuania (%)
Place of birth for the foreign-born population - North Macedonia (Macedonia) (%)
Place of birth for the foreign-born population - Moldova (%)
Place of birth for the foreign-born population - Poland (%)
Place of birth for the foreign-born population - Romania (%)
Place of birth for the foreign-born population - Russia (%)
Place of birth for the foreign-born population - Serbia (%)
Place of birth for the foreign-born population - Ukraine (%)
Place of birth for the foreign-born population - Other Eastern Europe (%)
Place of birth for the foreign-born population - China (%)
Place of birth for the foreign-born population - Hong Kong (%)
Place of birth for the foreign-born population - Taiwan (%)
Place of birth for the foreign-born population - Japan (%)
Place of birth for the foreign-born population - Korea (%)
Place of birth for the foreign-born population - Other Eastern Asia (%)
Place of birth for the foreign-born population - Afghanistan (%)
Place of birth for the foreign-born population - Bangladesh (%)
Place of birth for the foreign-born population - India (%)
Place of birth for the foreign-born population - Iran (%)
Place of birth for the foreign-born population - Kazakhstan (%)
Place of birth for the foreign-born population - Nepal (%)
Place of birth for the foreign-born population - Pakistan (%)
Place of birth for the foreign-born population - Sri Lanka (%)
Place of birth for the foreign-born population - Uzbekistan (%)
Place of birth for the foreign-born population - Other South Central Asia (%)
Place of birth for the foreign-born population - Burma (%)
Place of birth for the foreign-born population - Cambodia (%)
Place of birth for the foreign-born population - Indonesia (%)
Place of birth for the foreign-born population - Laos (%)
Place of birth for the foreign-born population - Malaysia (%)
Place of birth for the foreign-born population - Philippines (%)
Place of birth for the foreign-born population - Singapore (%)
Place of birth for the foreign-born population - Thailand (%)
Place of birth for the foreign-born population - Vietnam (%)
Place of birth for the foreign-born population - Other South Eastern Asia (%)
Place of birth for the foreign-born population - Armenia (%)
Place of birth for the foreign-born population - Iraq (%)
Place of birth for the foreign-born population - Israel (%)
Place of birth for the foreign-born population - Jordan (%)
Place of birth for the foreign-born population - Kuwait (%)
Place of birth for the foreign-born population - Lebanon (%)
Place of birth for the foreign-born population - Saudi Arabia (%)
Place of birth for the foreign-born population - Syria (%)
Place of birth for the foreign-born population - Turkey (%)
Place of birth for the foreign-born population - Yemen (%)
Place of birth for the foreign-born population - Other Western Asia (%)
Place of birth for the foreign-born population - Eritrea (%)
Place of birth for the foreign-born population - Ethiopia (%)
Place of birth for the foreign-born population - Kenya (%)
Place of birth for the foreign-born population - Somalia (%)
Place of birth for the foreign-born population - Uganda (%)
Place of birth for the foreign-born population - Zimbabwe (%)
Place of birth for the foreign-born population - Other Eastern Africa (%)
Place of birth for the foreign-born population - Cameroon (%)
Place of birth for the foreign-born population - Congo (%)
Place of birth for the foreign-born population - Democratic Republic of Congo (Zaire) (%)
Place of birth for the foreign-born population - Other Middle Africa (%)
Place of birth for the foreign-born population - Egypt (%)
Place of birth for the foreign-born population - Morocco (%)
Place of birth for the foreign-born population - Sudan (%)
Place of birth for the foreign-born population - Other Northern Africa (%)
Place of birth for the foreign-born population - South Africa (%)
Place of birth for the foreign-born population - Other Southern Africa (%)
Place of birth for the foreign-born population - Cabo Verde (%)
Place of birth for the foreign-born population - Ghana (%)
Place of birth for the foreign-born population - Liberia (%)
Place of birth for the foreign-born population - Nigeria (%)
Place of birth for the foreign-born population - Senegal (%)
Place of birth for the foreign-born population - Sierra Leone (%)
Place of birth for the foreign-born population - Other Western Africa (%)
Place of birth for the foreign-born population - Australia (%)
Place of birth for the foreign-born population - New Zealand (%)
Place of birth for the foreign-born population - Fiji (%)
Place of birth for the foreign-born population - Micronesia (%)
Place of birth for the foreign-born population - Bahamas (%)
Place of birth for the foreign-born population - Barbados (%)
Place of birth for the foreign-born population - Cuba (%)
Place of birth for the foreign-born population - Dominica (%)
Place of birth for the foreign-born population - Dominican Republic (%)
Place of birth for the foreign-born population - Grenada (%)
Place of birth for the foreign-born population - Haiti (%)
Place of birth for the foreign-born population - Jamaica (%)
Place of birth for the foreign-born population - St. Vincent and the Grenadines (%)
Place of birth for the foreign-born population - Trinidad and Tobago (%)
Place of birth for the foreign-born population - West Indies (%)
Place of birth for the foreign-born population - Other Caribbean (%)
Place of birth for the foreign-born population - Belize (%)
Place of birth for the foreign-born population - Costa Rica (%)
Place of birth for the foreign-born population - El Salvador (%)
Place of birth for the foreign-born population - Guatemala (%)
Place of birth for the foreign-born population - Honduras (%)
Place of birth for the foreign-born population - Mexico (%)
Place of birth for the foreign-born population - Nicaragua (%)
Place of birth for the foreign-born population - Panama (%)
Place of birth for the foreign-born population - Other Central America (%)
Place of birth for the foreign-born population - Argentina (%)
Place of birth for the foreign-born population - Bolivia (%)
Place of birth for the foreign-born population - Brazil (%)
Place of birth for the foreign-born population - Chile (%)
Place of birth for the foreign-born population - Colombia (%)
Place of birth for the foreign-born population - Ecuador (%)
Place of birth for the foreign-born population - Guyana (%)
Place of birth for the foreign-born population - Peru (%)
Place of birth for the foreign-born population - Uruguay (%)
Place of birth for the foreign-born population - Venezuela (%)
Place of birth for the foreign-born population - Other South America (%)
Place of birth for the foreign-born population - Canada (%)
Place of birth for the foreign-born population - Other Northern America (%)
Place of birth for the foreign-born population - Other (%)
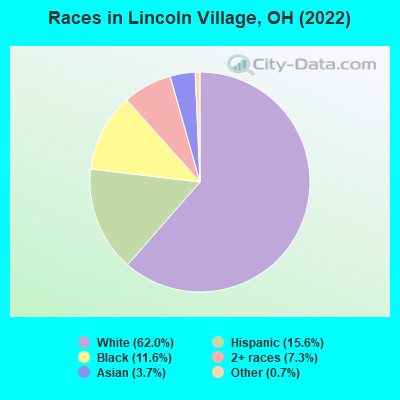
According to 2022 data, the most numerous races in Lincoln Village, OH are White alone (5,939 residents), Black alone (1,111 residents), and Two or more races (695 residents). 84.1% of Lincoln Village residents speak English at home. 9.8% of Lincoln Village, OH residents are foreign-born (5.3% born in Latin America, 2.3% born in Asia, 1.0% born in Africa), which is 59.2% greater than the foreign-born rate of 4.0% across the entire state of Ohio.
Race distribution in Lincoln Village
2000 2022
9,538,111 84.0% White alone 1,290,662 11.4% Black alone 217,123 1.9% Hispanic 137,770 1.2% Two or more races 131,670 1.2% Asian alone 21,985 0.2% American Indian alone 13,483 0.1% Other race alone 2,336 0.02% Native Hawaiian and Other
8,948,793 76.1% White alone 1,401,403 11.9% Black alone 529,291 4.5% Two or more races 517,232 4.4% Hispanic 293,387 2.5% Asian alone 52,805 0.4% Other race alone 9,785 0.08% American Indian alone 3,362 0.03% Native Hawaiian and Other
Income and house value in Lincoln Village Median household income in 2022 $56,396 White non-Hispanic householders$67,732 Black householders$50,450 Asian householders$93,226 Some other race householders$41,045 Two or more races householders$62,606 Hispanic or Latino race householdersMedian 2022 house value $171,228 White Non-Hispanic householders$151,798 Black or African American householders$263,927 American Indian or Alaska Native householders $242,472 Asian householders$188,027 Some other race householders$192,278 Two or more races householders$173,252 Hispanic or Latino householders
Median age by race in Lincoln Village
44.8 Median age for White residents39.7 48.6 31.0 Median age for Black or African American residents24.1 41.4 31.3 Median age for American Indian / Alaska Native residents-670,953,911.4 17.1 31.3 Median age for Asian residents29.6 34.9 -497,206,703.4 Median age for Native Hawaiian / Pacific Islander residents-544,891,640.3 -805,394,989.6 26.8 Median age for Other race residents26.3 24.2 35.3 Median age for Two or more races residents42.6 23.6 46.1 Median age for White alone residents42.9 49.7 26.0 Median age for Hispanic or Latino residents22.4 27.2
Owner/renter occupied households by race in Lincoln Village
House owners and renters - White residents 1,835 64.3% Owner occupied1,021 35.7% Renter occupiedHouse owners and renters - Black or African American residents 84 19.8% Owner occupied341 80.2% Renter occupiedHouse owners and renters - American Indian / Alaska Native residents 3 14.3% Owner occupied15 85.7% Renter occupiedHouse owners and renters - Asian residents 46 45.2% Owner occupied56 54.8% Renter occupiedHouse owners and renters - Other race residents 121 72.6% Owner occupied46 27.4% Renter occupiedHouse owners and renters - Two or more races residents 309 63.1% Owner occupied180 36.9% Renter occupiedHouse owners and renters - White alone residents 1,814 64.7% Owner occupied991 35.3% Renter occupiedHouse owners and renters - Hispanic or Latino residents 212 59.5% Owner occupied145 40.5% Renter occupied
Language usage in Lincoln Village
English speakers - Total 84.1% of residents of Lincoln Village speak English at home.
11.9% of residents speak Spanish at home 449 41.0% Speak English very well646 59.0% Speak English less than very well4.7% of residents speak other language at home 280 63.9% Speak English very well158 36.1% Speak English less than very well
English speakers - Born in the United States 94.4% of residents of Lincoln Village speak English at home.
5.7% of residents speak Spanish at home 112 85.5% Speak English very well19 14.5% Speak English less than very well
English speakers - Native, born elsewhere 66.2% of residents of Lincoln Village speak English at home.
29.4% of residents speak Spanish at home 20 100.0% Speak English very well
English speakers - Foreign-born 11.0% of residents of Lincoln Village speak English at home.
60.1% of residents speak Spanish at home 27 4.9% Speak English very well528 95.1% Speak English less than very well36.3% of residents speak other language at home 177 52.8% Speak English very well158 47.2% Speak English less than very well
White (Caucasian) - Speak only English Native:
96.7% (5,728)Foreign-born:
11.1% (11)
White (Caucasian) - Speak another language Native:
3.1% (184)Foreign-born:
88.3% (91)
Black or African American - Speak only English Native:
98.5% (926)Foreign-born:
51.1% (56)
American Indian / Alaska Native - Speak another language Native:
69.4% (34)Foreign-born:
99.1% (4)
Asian - Speak another language Native:
11.0% (15)Foreign-born:
100.0% (224)
Other race - Speak only English Native:
37.4% (148)Foreign-born:
5.9% (17)
Other race - Speak another language Native:
63.0% (250)Foreign-born:
88.1% (256)
Two or more races - Speak only English Native:
80.3% (789)Foreign-born:
4.7% (15)
Two or more races - Speak another language Native:
18.4% (180)Foreign-born:
95.1% (295)
White alone - Speak only English Native:
98.4% (5,650)Foreign-born:
18.8% (12)
White alone - Speak another language Native:
1.6% (91)Foreign-born:
82.5% (51)
Hispanic or Latino - Speak only English Native:
36.7% (301)Foreign-born:
8.1% (45)
Hispanic or Latino - Speak another language Native:
67.1% (551)Foreign-born:
92.2% (519)
Foreign-born residents in Lincoln Village 939 residents are foreign born (5.3% Latin America , 2.3% Asia , 1.0% Africa ).
Marital status for residents in Lincoln Village Marital status - White (Caucasian) population 15 years and over
Males 40.7% Never married41.6% Now married1.6% Separated2.1% Widowed14.0% DivorcedFemales 27.7% Never married40.3% Now married2.4% Separated8.0% Widowed21.6% DivorcedWomen who gave birth in the past 12 months Now married:
100.0% (54)Unmarried:
0.0% (0)
Women who did not give birth in the past 12 months Now married:
46.1% (614)Unmarried:
53.9% (717)
Marital status - Black or African American population 15 years and over
Males 63.7% Never married24.4% Now married8.0% Separated3.9% Widowed0.0% DivorcedFemales 42.3% Never married23.0% Now married12.7% Separated1.9% Widowed20.0% DivorcedWomen who gave birth in the past 12 months Now married:
100.0% (27)Unmarried:
0.0% (0)
Women who did not give birth in the past 12 months Now married:
36.7% (105)Unmarried:
63.3% (181)
Marital status - American Indian / Alaska Native population 15 years and over
Males 84.6% Never married15.4% Now married0.0% Separated0.0% Widowed0.0% DivorcedFemales 91.7% Never married8.3% Now married0.0% Separated0.0% Widowed0.0% DivorcedWomen who did not give birth in the past 12 months Now married:
0.0% (0)Unmarried:
100.0% (13)
Marital status - Asian population 15 years and over
Males 29.9% Never married70.1% Now married0.0% Separated0.0% Widowed0.0% DivorcedFemales 23.1% Never married71.1% Now married5.8% Separated0.0% Widowed0.0% DivorcedWomen who did not give birth in the past 12 months Now married:
73.1% (75)Unmarried:
26.9% (28)
Marital status - Other race population 15 years and over
Males 41.9% Never married52.7% Now married0.0% Separated0.0% Widowed5.4% DivorcedFemales 47.2% Never married38.0% Now married0.0% Separated4.8% Widowed10.0% DivorcedWomen who did not give birth in the past 12 months Now married:
20.2% (43)Unmarried:
79.8% (171)
Marital status - Two or more races population 15 years and over
Males 17.3% Never married59.7% Now married0.0% Separated10.1% Widowed12.9% DivorcedFemales 58.1% Never married35.3% Now married0.9% Separated0.0% Widowed5.6% DivorcedWomen who did not give birth in the past 12 months Now married:
36.6% (218)Unmarried:
63.4% (378)
Marital status - White alone, not Hispanic / Latino population 15 years and over
Males 40.2% Never married41.5% Now married1.6% Separated2.2% Widowed14.4% DivorcedFemales 27.2% Never married40.1% Now married2.5% Separated8.4% Widowed21.8% DivorcedWomen who gave birth in the past 12 months Now married:
100.0% (54)Unmarried:
0.0% (0)
Women who did not give birth in the past 12 months Now married:
46.1% (565)Unmarried:
53.9% (662)
Marital status - Hispanic or Latino population 15 years and over
Males 31.3% Never married59.3% Now married0.0% Separated0.0% Widowed9.4% DivorcedFemales 51.0% Never married37.7% Now married0.0% Separated2.1% Widowed9.1% DivorcedWomen who did not give birth in the past 12 months Now married:
32.8% (168)Unmarried:
67.2% (345)
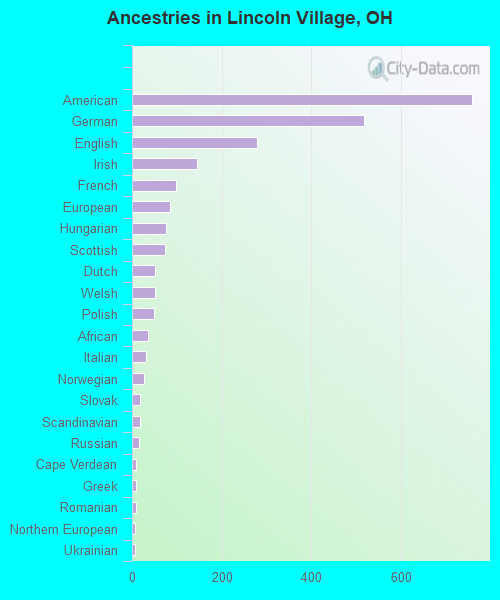
Ancestries in Lincoln Village
758 15.7% American517 10.7% German278 5.8% English146 3.0% Irish97 2.0% French85 1.8% European75 1.6% Hungarian74 1.5% Scottish51 1.1% Dutch51 1.1% Welsh49 1.0% Polish36 0.7% African32 0.7% Italian26 0.5% Norwegian18 0.4% Slovak17 0.4% Scandinavian15 0.3% Russian10 0.2% Cape Verdean8 0.2% Greek8 0.2% Romanian7 0.1% Northern European7 0.1% Ukrainian6 0.1% Ethiopian6 0.1% Swedish
Children Nativity (place of birth) in Lincoln Village
Children under 6 years - Living with two parents Both parents native 148 100.0% NativeBoth parents foreign-born 104 90.3% Native11 9.7% Foreign-bornOne native, one foreign-born parent 62 100.0% NativeChildren under 6 years - Living with one parent Native parent 145 100.0% NativeForeign-born parent 56 100.0% NativeChildren 6 to 17 years - Living with two parents Both parents native 591 100.0% NativeBoth parents foreign-born 296 96.6% Native10 3.4% Foreign-bornOne native, one foreign-born parent 86 100.0% NativeChildren 6 to 17 years - Living with one parent Native parent 250 100.0% NativeForeign-born parent 86 50.6% Native84 49.4% Foreign-born
Grandparents responsible for own grandchildren in Lincoln Village
Grandparents (30 to 59 years) White / Caucasian 9 37.8% Responsible for grandchildren15 62.2% Not responsible for grandchildrenOther race 27 100.0% Responsible for grandchildrenWhite alone, not Hispanic / Latino 9 37.2% Responsible for grandchildren16 62.8% Not responsible for grandchildrenHispanic or Latino 32 100.0% Responsible for grandchildrenGrandparents (60 years and over) White / Caucasian 67 61.4% Responsible for grandchildren42 38.6% Not responsible for grandchildrenOther race 11 100.0% Responsible for grandchildrenWhite alone, not Hispanic / Latino 37 46.1% Responsible for grandchildren44 53.9% Not responsible for grandchildrenHispanic or Latino 17 100.0% Responsible for grandchildren