Races in Lilburn, Georgia (GA) Detailed Stats
Data:
Races - White alone (%)
Races - White alone (% change since 2000)
Races - Black alone (%)
Races - Black alone (% change since 2000)
Races - American Indian alone (%)
Races - American Indian alone (% change since 2000)
Races - Asian alone (%)
Races - Asian alone (% change since 2000)
Races - Hispanic (%)
Races - Hispanic (% change since 2000)
Races - Native Hawaiian and Other Pacific Islander alone (%)
Races - Native Hawaiian and Other Pacific Islander alone (% change since 2000)
Races - Two or more races(%)
Races - Two or more races(% change since 2000)
Races - Other race alone (%)
Races - Other race alone (% change since 2000)
Racial diversity
Place of birth - Born in state of residence (%)
Place of birth - Born in state of residence (%) - White
Place of birth - Born in state of residence (%) - Black or African American
Place of birth - Born in state of residence (%) - Asian
Place of birth - Born in state of residence (%) - Hispanic or Latino
Place of birth - Born in state of residence (%) - American Indian and Alaska Native
Place of birth - Born in state of residence (%) - Multirace
Place of birth - Born in state of residence (%) - Other Race
Place of birth - Born in other state (%)
Place of birth - Born in other state (%) - White
Place of birth - Born in other state (%) - Black or African American
Place of birth - Born in other state (%) - Asian
Place of birth - Born in other state (%) - Hispanic or Latino
Place of birth - Born in other state (%) - American Indian and Alaska Native
Place of birth - Born in other state (%) - Multirace
Place of birth - Born in other state (%) - Other Race
Place of birth - Native, outside of US (%)
Place of birth - Native, outside of US (%) - White
Place of birth - Native, outside of US (%) - Black or African American
Place of birth - Native, outside of US (%) - Asian
Place of birth - Native, outside of US (%) - Hispanic or Latino
Place of birth - Native, outside of US (%) - American Indian and Alaska Native
Place of birth - Native, outside of US (%) - Multirace
Place of birth - Native, outside of US (%) - Other Race
Place of birth - Foreign born (%)
Place of birth - Foreign born (%) - White
Place of birth - Foreign born (%) - Black or African American
Place of birth - Foreign born (%) - Asian
Place of birth - Foreign born (%) - Hispanic or Latino
Place of birth - Foreign born (%) - American Indian and Alaska Native
Place of birth - Foreign born (%) - Multirace
Place of birth - Foreign born (%) - Other Race
Residents speaking English at home (%)
Residents speaking English at home - Born in the United States (%)
Residents speaking English at home - Native, born elsewhere (%)
Residents speaking English at home - Foreign born (%)
Residents speaking Spanish at home (%)
Residents speaking Spanish at home - Born in the United States (%)
Residents speaking Spanish at home - Native, born elsewhere (%)
Residents speaking Spanish at home - Foreign born (%)
Residents speaking other language at home (%)
Residents speaking other language at home - Born in the United States (%)
Residents speaking other language at home - Native, born elsewhere (%)
Residents speaking other language at home - Foreign born (%)
Marital status - Never married (%)
Marital status - Now married (%)
Marital status - Separated (%)
Marital status - Widowed (%)
Marital status - Divorced (%)
Ancestries Reported - Arab (%)
Ancestries Reported - Czech (%)
Ancestries Reported - Danish (%)
Ancestries Reported - Dutch (%)
Ancestries Reported - English (%)
Ancestries Reported - French (%)
Ancestries Reported - French Canadian (%)
Ancestries Reported - German (%)
Ancestries Reported - Greek (%)
Ancestries Reported - Hungarian (%)
Ancestries Reported - Irish (%)
Ancestries Reported - Italian (%)
Ancestries Reported - Lithuanian (%)
Ancestries Reported - Norwegian (%)
Ancestries Reported - Polish (%)
Ancestries Reported - Portuguese (%)
Ancestries Reported - Russian (%)
Ancestries Reported - Scotch-Irish (%)
Ancestries Reported - Scottish (%)
Ancestries Reported - Slovak (%)
Ancestries Reported - Subsaharan African (%)
Ancestries Reported - Swedish (%)
Ancestries Reported - Swiss (%)
Ancestries Reported - Ukrainian (%)
Ancestries Reported - United States (%)
Ancestries Reported - Welsh (%)
Ancestries Reported - West Indian (%)
Ancestries Reported - Other (%)
Geographical mobility - Same house 1 year ago (%)
Geographical mobility - Same house 1 year ago (%) - White
Geographical mobility - Same house 1 year ago (%) - Black or African American
Geographical mobility - Same house 1 year ago (%) - Asian
Geographical mobility - Same house 1 year ago (%) - Hispanic or Latino
Geographical mobility - Same house 1 year ago (%) - American Indian and Alaska Native
Geographical mobility - Same house 1 year ago (%) - Multirace
Geographical mobility - Same house 1 year ago (%) - Other Race
Geographical mobility - Moved within same county (%)
Geographical mobility - Moved within same county (%) - White
Geographical mobility - Moved within same county (%) - Black or African American
Geographical mobility - Moved within same county (%) - Asian
Geographical mobility - Moved within same county (%) - Hispanic or Latino
Geographical mobility - Moved within same county (%) - American Indian and Alaska Native
Geographical mobility - Moved within same county (%) - Multirace
Geographical mobility - Moved within same county (%) - Other Race
Geographical mobility - Moved from different county within same state (%)
Geographical mobility - Moved from different county within same state (%) - White
Geographical mobility - Moved from different county within same state (%) - Black or African American
Geographical mobility - Moved from different county within same state (%) - Asian
Geographical mobility - Moved from different county within same state (%) - Hispanic or Latino
Geographical mobility - Moved from different county within same state (%) - American Indian and Alaska Native
Geographical mobility - Moved from different county within same state (%) - Multirace
Geographical mobility - Moved from different county within same state (%) - Other Race
Geographical mobility - Moved from different state (%)
Geographical mobility - Moved from different state (%) - White
Geographical mobility - Moved from different state (%) - Black or African American
Geographical mobility - Moved from different state (%) - Asian
Geographical mobility - Moved from different state (%) - Hispanic or Latino
Geographical mobility - Moved from different state (%) - American Indian and Alaska Native
Geographical mobility - Moved from different state (%) - Multirace
Geographical mobility - Moved from different state (%) - Other Race
Geographical mobility - Moved from abroad (%)
Geographical mobility - Moved from abroad (%) - White
Geographical mobility - Moved from abroad (%) - Black or African American
Geographical mobility - Moved from abroad (%) - Asian
Geographical mobility - Moved from abroad (%) - Hispanic or Latino
Geographical mobility - Moved from abroad (%) - American Indian and Alaska Native
Geographical mobility - Moved from abroad (%) - Multirace
Geographical mobility - Moved from abroad (%) - Other Race
Place of birth for the foreign-born population - Ireland (%)
Place of birth for the foreign-born population - Denmark (%)
Place of birth for the foreign-born population - Norway (%)
Place of birth for the foreign-born population - Sweden (%)
Place of birth for the foreign-born population - United Kingdom (%)
Place of birth for the foreign-born population - England (%)
Place of birth for the foreign-born population - Scotland (%)
Place of birth for the foreign-born population - Other Northern Europe (%)
Place of birth for the foreign-born population - Austria (%)
Place of birth for the foreign-born population - Belgium (%)
Place of birth for the foreign-born population - France (%)
Place of birth for the foreign-born population - Germany (%)
Place of birth for the foreign-born population - Netherlands (%)
Place of birth for the foreign-born population - Switzerland (%)
Place of birth for the foreign-born population - Other Western Europe (%)
Place of birth for the foreign-born population - Greece (%)
Place of birth for the foreign-born population - Italy (%)
Place of birth for the foreign-born population - Portugal (%)
Place of birth for the foreign-born population - Spain (%)
Place of birth for the foreign-born population - Other Southern Europe (%)
Place of birth for the foreign-born population - Albania (%)
Place of birth for the foreign-born population - Belarus (%)
Place of birth for the foreign-born population - Bosnia and Herzegovina (%)
Place of birth for the foreign-born population - Bulgaria (%)
Place of birth for the foreign-born population - Croatia (%)
Place of birth for the foreign-born population - Czechoslovakia (%)
Place of birth for the foreign-born population - Hungary (%)
Place of birth for the foreign-born population - Latvia (%)
Place of birth for the foreign-born population - Lithuania (%)
Place of birth for the foreign-born population - North Macedonia (Macedonia) (%)
Place of birth for the foreign-born population - Moldova (%)
Place of birth for the foreign-born population - Poland (%)
Place of birth for the foreign-born population - Romania (%)
Place of birth for the foreign-born population - Russia (%)
Place of birth for the foreign-born population - Serbia (%)
Place of birth for the foreign-born population - Ukraine (%)
Place of birth for the foreign-born population - Other Eastern Europe (%)
Place of birth for the foreign-born population - China (%)
Place of birth for the foreign-born population - Hong Kong (%)
Place of birth for the foreign-born population - Taiwan (%)
Place of birth for the foreign-born population - Japan (%)
Place of birth for the foreign-born population - Korea (%)
Place of birth for the foreign-born population - Other Eastern Asia (%)
Place of birth for the foreign-born population - Afghanistan (%)
Place of birth for the foreign-born population - Bangladesh (%)
Place of birth for the foreign-born population - India (%)
Place of birth for the foreign-born population - Iran (%)
Place of birth for the foreign-born population - Kazakhstan (%)
Place of birth for the foreign-born population - Nepal (%)
Place of birth for the foreign-born population - Pakistan (%)
Place of birth for the foreign-born population - Sri Lanka (%)
Place of birth for the foreign-born population - Uzbekistan (%)
Place of birth for the foreign-born population - Other South Central Asia (%)
Place of birth for the foreign-born population - Burma (%)
Place of birth for the foreign-born population - Cambodia (%)
Place of birth for the foreign-born population - Indonesia (%)
Place of birth for the foreign-born population - Laos (%)
Place of birth for the foreign-born population - Malaysia (%)
Place of birth for the foreign-born population - Philippines (%)
Place of birth for the foreign-born population - Singapore (%)
Place of birth for the foreign-born population - Thailand (%)
Place of birth for the foreign-born population - Vietnam (%)
Place of birth for the foreign-born population - Other South Eastern Asia (%)
Place of birth for the foreign-born population - Armenia (%)
Place of birth for the foreign-born population - Iraq (%)
Place of birth for the foreign-born population - Israel (%)
Place of birth for the foreign-born population - Jordan (%)
Place of birth for the foreign-born population - Kuwait (%)
Place of birth for the foreign-born population - Lebanon (%)
Place of birth for the foreign-born population - Saudi Arabia (%)
Place of birth for the foreign-born population - Syria (%)
Place of birth for the foreign-born population - Turkey (%)
Place of birth for the foreign-born population - Yemen (%)
Place of birth for the foreign-born population - Other Western Asia (%)
Place of birth for the foreign-born population - Eritrea (%)
Place of birth for the foreign-born population - Ethiopia (%)
Place of birth for the foreign-born population - Kenya (%)
Place of birth for the foreign-born population - Somalia (%)
Place of birth for the foreign-born population - Uganda (%)
Place of birth for the foreign-born population - Zimbabwe (%)
Place of birth for the foreign-born population - Other Eastern Africa (%)
Place of birth for the foreign-born population - Cameroon (%)
Place of birth for the foreign-born population - Congo (%)
Place of birth for the foreign-born population - Democratic Republic of Congo (Zaire) (%)
Place of birth for the foreign-born population - Other Middle Africa (%)
Place of birth for the foreign-born population - Egypt (%)
Place of birth for the foreign-born population - Morocco (%)
Place of birth for the foreign-born population - Sudan (%)
Place of birth for the foreign-born population - Other Northern Africa (%)
Place of birth for the foreign-born population - South Africa (%)
Place of birth for the foreign-born population - Other Southern Africa (%)
Place of birth for the foreign-born population - Cabo Verde (%)
Place of birth for the foreign-born population - Ghana (%)
Place of birth for the foreign-born population - Liberia (%)
Place of birth for the foreign-born population - Nigeria (%)
Place of birth for the foreign-born population - Senegal (%)
Place of birth for the foreign-born population - Sierra Leone (%)
Place of birth for the foreign-born population - Other Western Africa (%)
Place of birth for the foreign-born population - Australia (%)
Place of birth for the foreign-born population - New Zealand (%)
Place of birth for the foreign-born population - Fiji (%)
Place of birth for the foreign-born population - Micronesia (%)
Place of birth for the foreign-born population - Bahamas (%)
Place of birth for the foreign-born population - Barbados (%)
Place of birth for the foreign-born population - Cuba (%)
Place of birth for the foreign-born population - Dominica (%)
Place of birth for the foreign-born population - Dominican Republic (%)
Place of birth for the foreign-born population - Grenada (%)
Place of birth for the foreign-born population - Haiti (%)
Place of birth for the foreign-born population - Jamaica (%)
Place of birth for the foreign-born population - St. Vincent and the Grenadines (%)
Place of birth for the foreign-born population - Trinidad and Tobago (%)
Place of birth for the foreign-born population - West Indies (%)
Place of birth for the foreign-born population - Other Caribbean (%)
Place of birth for the foreign-born population - Belize (%)
Place of birth for the foreign-born population - Costa Rica (%)
Place of birth for the foreign-born population - El Salvador (%)
Place of birth for the foreign-born population - Guatemala (%)
Place of birth for the foreign-born population - Honduras (%)
Place of birth for the foreign-born population - Mexico (%)
Place of birth for the foreign-born population - Nicaragua (%)
Place of birth for the foreign-born population - Panama (%)
Place of birth for the foreign-born population - Other Central America (%)
Place of birth for the foreign-born population - Argentina (%)
Place of birth for the foreign-born population - Bolivia (%)
Place of birth for the foreign-born population - Brazil (%)
Place of birth for the foreign-born population - Chile (%)
Place of birth for the foreign-born population - Colombia (%)
Place of birth for the foreign-born population - Ecuador (%)
Place of birth for the foreign-born population - Guyana (%)
Place of birth for the foreign-born population - Peru (%)
Place of birth for the foreign-born population - Uruguay (%)
Place of birth for the foreign-born population - Venezuela (%)
Place of birth for the foreign-born population - Other South America (%)
Place of birth for the foreign-born population - Canada (%)
Place of birth for the foreign-born population - Other Northern America (%)
Place of birth for the foreign-born population - Other (%)
Latest news about races in Lilburn, GA collected exclusively by city-data.com from local newspapers, TV, and radio stations
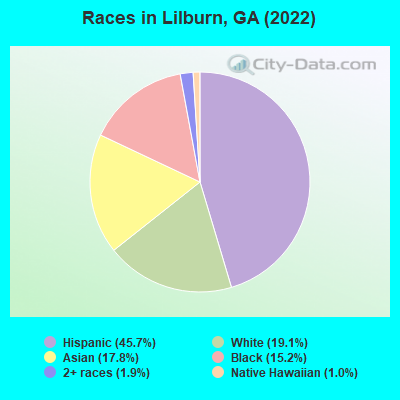
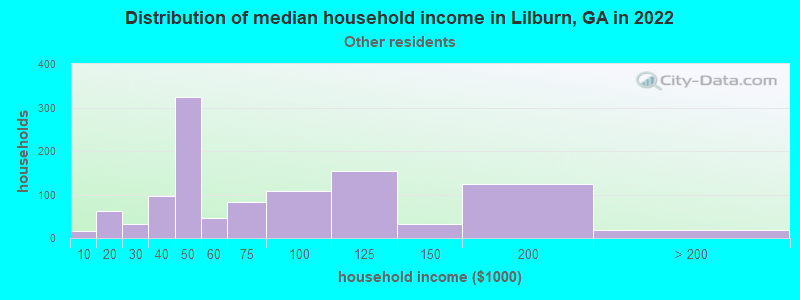
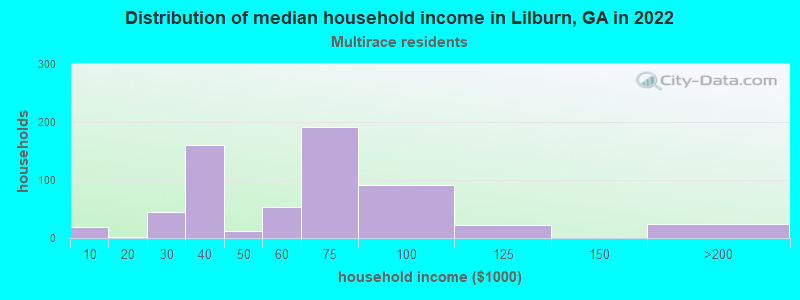
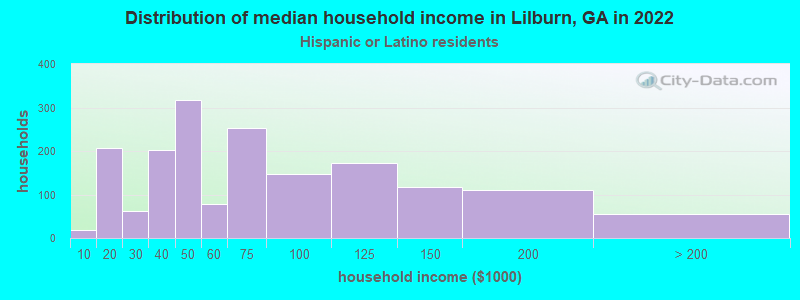
According to 2022 data, the most numerous races in Lilburn, GA are White alone (2,873 residents), Black alone (2,284 residents), and Hispanic (6,854 residents). 38.8% of Lilburn residents speak English at home. 36.7% of Lilburn, GA residents are foreign-born (17.5% born in Latin America, 12.3% born in Asia, 4.5% born in Africa), which is 72.8% greater than the foreign-born rate of 10.0% across the entire state of Georgia.
Race distribution in Lilburn
2000 2022
5,128,661 62.6% White alone 2,331,465 28.5% Black alone 435,227 5.3% Hispanic 171,513 2.1% Asian alone 87,364 1.1% Two or more races 17,670 0.2% American Indian alone 11,275 0.1% Other race alone 3,278 0.04% Native Hawaiian and Other
5,415,657 49.6% White alone 3,349,240 30.7% Black alone 1,132,604 10.4% Hispanic 479,156 4.4% Asian alone 462,923 4.2% Two or more races 54,416 0.5% Other race alone 11,923 0.1% American Indian alone 6,957 0.06% Native Hawaiian and Other
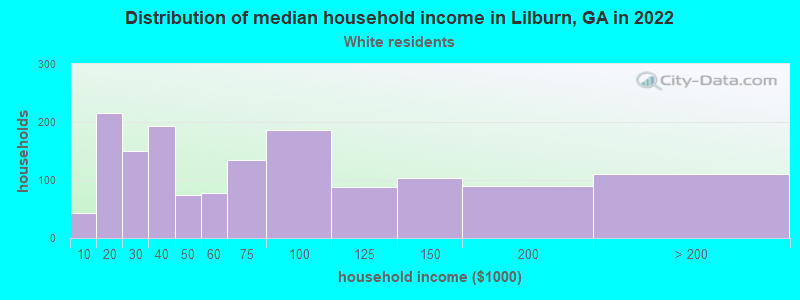
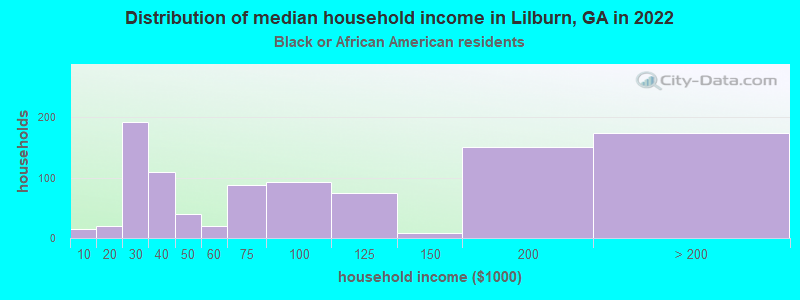
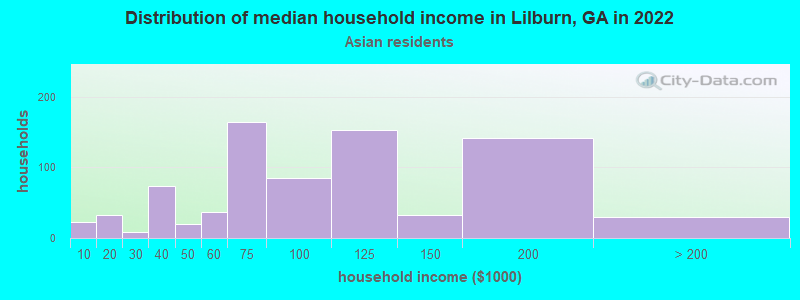
Income and house value in Lilburn Median household income in 2022 $51,481 White non-Hispanic householders$99,566 Black householders$86,849 Asian householders$48,199 Some other race householders$67,311 Two or more races householders$51,963 Hispanic or Latino race householdersMedian 2022 house value $329,717 White Non-Hispanic householders$317,193 Black or African American householders$236,028 American Indian or Alaska Native householders $318,157 Asian householders$281,548 Some other race householders$295,276 Two or more races householders$266,375 Hispanic or Latino householders
Median age by race in Lilburn
50.9 Median age for White residents49.1 55.9 40.1 Median age for Black or African American residents38.3 43.1 54.6 Median age for American Indian / Alaska Native residents50.1 -732,307,691.6 33.1 Median age for Asian residents29.1 39.9 15.9 Median age for Native Hawaiian / Pacific Islander residents38.8 8.6 33.8 Median age for Other race residents35.0 21.2 18.7 Median age for Two or more races residents10.5 44.3 56.7 Median age for White alone residents49.6 60.0 29.2 Median age for Hispanic or Latino residents28.9 31.2
Owner/renter occupied households by race in Lilburn
House owners and renters - White residents 1,045 71.7% Owner occupied411 28.3% Renter occupiedHouse owners and renters - Black or African American residents 375 40.3% Owner occupied554 59.7% Renter occupiedHouse owners and renters - American Indian / Alaska Native residents 3 100.0% Renter occupiedHouse owners and renters - Asian residents 532 68.2% Owner occupied248 31.8% Renter occupiedHouse owners and renters - Native Hawaiian / Pacific Islander residents 34 100.0% Renter occupiedHouse owners and renters - Other race residents 833 67.3% Owner occupied405 32.7% Renter occupiedHouse owners and renters - Two or more races residents 252 34.4% Owner occupied481 65.6% Renter occupiedHouse owners and renters - White alone residents 964 78.1% Owner occupied270 21.9% Renter occupiedHouse owners and renters - Hispanic or Latino residents 981 51.6% Owner occupied922 48.4% Renter occupied
Language usage in Lilburn
English speakers - Total 38.8% of residents of Lilburn speak English at home.
41.0% of residents speak Spanish at home 2,339 40.8% Speak English very well3,397 59.2% Speak English less than very well20.3% of residents speak other language at home 1,756 61.8% Speak English very well1,085 38.2% Speak English less than very well
English speakers - Born in the United States 72.7% of residents of Lilburn speak English at home.
22.4% of residents speak Spanish at home 564 92.9% Speak English very well43 7.1% Speak English less than very well3.0% of residents speak other language at home 77 93.9% Speak English very well5 6.1% Speak English less than very well
English speakers - Native, born elsewhere 38.1% of residents of Lilburn speak English at home.
44.5% of residents speak Spanish at home 150 89.8% Speak English very well17 10.2% Speak English less than very well6.7% of residents speak other language at home 25 100.0% Speak English very well
English speakers - Foreign-born 14.3% of residents of Lilburn speak English at home.
44.1% of residents speak Spanish at home 412 16.8% Speak English very well2,035 83.2% Speak English less than very well41.5% of residents speak other language at home 1,267 55.1% Speak English very well1,032 44.9% Speak English less than very well
White (Caucasian) - Speak only English Native:
87.9% (2,565)Foreign-born:
9.6% (38)
White (Caucasian) - Speak another language Native:
11.1% (323)Foreign-born:
89.0% (349)
Black or African American - Speak only English Native:
96.4% (1,228)Foreign-born:
67.6% (539)
Black or African American - Speak another language Native:
3.7% (47)Foreign-born:
35.4% (282)
Asian - Speak only English Native:
39.3% (245)Foreign-born:
11.0% (208)
Asian - Speak another language Native:
60.5% (377)Foreign-born:
88.6% (1,677)
Native Hawaiian / Pacific Islander - Speak another language Native:
48.5% (49)Foreign-born:
100.0% (50)
Other race - Speak another language Native:
92.9% (1,618)Foreign-born:
99.6% (1,485)
Two or more races - Speak only English Native:
16.4% (383)Foreign-born:
0.8% (10)
Two or more races - Speak another language Native:
76.3% (1,783)Foreign-born:
100.0% (1,231)
White alone - Speak only English Native:
95.9% (2,384)Foreign-born:
8.2% (22)
White alone - Speak another language Native:
4.1% (102)Foreign-born:
95.0% (256)
Hispanic or Latino - Speak only English Native:
14.5% (568)Foreign-born:
3.3% (85)
Hispanic or Latino - Speak another language Native:
83.9% (3,295)Foreign-born:
96.6% (2,469)
Foreign-born residents in Lilburn 5,510 residents are foreign born (17.5% Latin America , 12.3% Asia , 4.5% Africa ).
This city:
36.7%Georgia:
10.4%
Marital status for residents in Lilburn Marital status - White (Caucasian) population 15 years and over
Males 28.6% Never married50.9% Now married1.9% Separated2.4% Widowed16.2% DivorcedFemales 18.8% Never married56.9% Now married0.0% Separated9.6% Widowed14.6% DivorcedWomen who gave birth in the past 12 months Now married:
100.0% (18)Unmarried:
0.0% (0)
Women who did not give birth in the past 12 months Now married:
53.9% (269)Unmarried:
46.1% (230)
Marital status - Black or African American population 15 years and over
Males 35.0% Never married50.8% Now married0.1% Separated1.8% Widowed12.3% DivorcedFemales 27.2% Never married31.9% Now married7.2% Separated19.3% Widowed14.4% DivorcedWomen who gave birth in the past 12 months Now married:
88.1% (136)Unmarried:
11.9% (18)
Women who did not give birth in the past 12 months Now married:
43.1% (199)Unmarried:
56.9% (263)
Marital status - Asian population 15 years and over
Males 40.8% Never married57.6% Now married0.0% Separated0.0% Widowed1.6% DivorcedFemales 21.2% Never married60.8% Now married0.2% Separated13.6% Widowed4.1% DivorcedWomen who gave birth in the past 12 months Now married:
83.9% (48)Unmarried:
16.1% (9)
Women who did not give birth in the past 12 months Now married:
63.6% (379)Unmarried:
36.4% (217)
Marital status - Native Hawaiian / Pacific Islander population 15 years and over
Males 32.0% Never married68.0% Now married0.0% Separated0.0% Widowed0.0% DivorcedFemales 0.0% Never married100.0% Now married0.0% Separated0.0% Widowed0.0% DivorcedWomen who did not give birth in the past 12 months Now married:
100.0% (32)Unmarried:
0.0% (0)
Marital status - Other race population 15 years and over
Males 59.6% Never married35.0% Now married5.5% Separated0.0% Widowed0.0% DivorcedFemales 38.3% Never married60.8% Now married0.0% Separated0.0% Widowed0.9% DivorcedWomen who did not give birth in the past 12 months Now married:
55.6% (430)Unmarried:
44.4% (343)
Marital status - Two or more races population 15 years and over
Males 46.1% Never married53.9% Now married0.0% Separated0.0% Widowed0.0% DivorcedFemales 49.3% Never married46.9% Now married0.6% Separated2.9% Widowed0.3% DivorcedWomen who did not give birth in the past 12 months Now married:
52.8% (360)Unmarried:
47.2% (321)
Marital status - White alone, not Hispanic / Latino population 15 years and over
Males 27.1% Never married58.9% Now married1.7% Separated2.5% Widowed9.8% DivorcedFemales 12.2% Never married61.4% Now married0.0% Separated11.8% Widowed14.6% DivorcedWomen who gave birth in the past 12 months Now married:
100.0% (20)Unmarried:
0.0% (0)
Women who did not give birth in the past 12 months Now married:
64.8% (208)Unmarried:
35.2% (113)
Marital status - Hispanic or Latino population 15 years and over
Males 49.9% Never married38.2% Now married3.2% Separated0.4% Widowed8.3% DivorcedFemales 45.3% Never married50.3% Now married0.2% Separated1.2% Widowed3.0% DivorcedWomen who did not give birth in the past 12 months Now married:
49.9% (693)Unmarried:
50.1% (696)
Ancestries in Lilburn
713 6.8% Nigerian398 3.8% English234 2.2% American187 1.8% Scottish183 1.8% Liberian140 1.3% Irish134 1.3% German107 1.0% Afghan104 1.0% Ethiopian96 0.9% European88 0.8% Russian79 0.8% U.S. Virgin Islander48 0.5% Italian42 0.4% Czech37 0.4% Trinidadian and Tobagonian29 0.3% Iraqi24 0.2% Palestinian23 0.2% Haitian20 0.2% French Canadian16 0.2% French14 0.1% Romanian14 0.1% Ukrainian12 0.1% Slovak9 0.09% Scotch-Irish6 0.06% Norwegian2 0.02% Bulgarian
Geographical mobility in Lilburn Same house 1 year ago 3,145 91.6% White (Caucasian)2,116 96.2% Black or African American42 99.5% American Indian / Alaska Native2,453 91.8% Asian214 100.0% Native Hawaiian / Pacific Islander2,931 84.5% Other race3,526 99.6% Two or more races2,640 92.6% White alone, not Hispanic / Latino6,069 91.1% Hispanic or LatinoMoved within same county 170 4.9% White / Caucasian102 3.8% Asian298 8.6% Other race17 0.5% Two or more races103 3.6% White alone, not Hispanic / Latino334 5.0% Hispanic or LatinoMoved within same state 123 3.6% White / Caucasian18 0.7% Asian26 0.7% Other race5 0.1% Two or more races112 3.9% White alone, not Hispanic / Latino36 0.5% Hispanic or LatinoMoved from different state 4 0.1% White / Caucasian35 1.6% Black or African American121 4.5% Asian4 0.1% Two or more races4 0.2% White alone, not Hispanic / Latino3 0.0% Hispanic or LatinoMoved from abroad 2 0.1% White123 5.6% Black or African American317 9.1% Other race2 0.1% White alone, not Hispanic / Latino275 4.1% Hispanic or Latino
Children Nativity (place of birth) in Lilburn
Children under 6 years - Living with two parents Both parents native 251 99.9% Native0 0.1% Foreign-bornBoth parents foreign-born 510 98.4% Native8 1.6% Foreign-bornOne native, one foreign-born parent 66 100.0% NativeChildren under 6 years - Living with one parent Native parent 154 94.1% Native10 5.9% Foreign-bornForeign-born parent 183 100.0% NativeChildren 6 to 17 years - Living with two parents Both parents native 287 96.1% Native12 3.9% Foreign-bornBoth parents foreign-born 1,939 91.7% Native174 8.3% Foreign-bornOne native, one foreign-born parent 131 100.0% NativeChildren 6 to 17 years - Living with one parent Native parent 240 100.0% NativeForeign-born parent 239 52.1% Native220 47.9% Foreign-born
Grandparents responsible for own grandchildren in Lilburn
Grandparents (30 to 59 years) White / Caucasian 9 100.0% Not responsible for grandchildrenAsian 55 100.0% Not responsible for grandchildrenTwo or more races 14 100.0% Not responsible for grandchildrenWhite alone, not Hispanic / Latino 9 100.0% Not responsible for grandchildrenHispanic or Latino 11 100.0% Not responsible for grandchildrenGrandparents (60 years and over) White / Caucasian 23 43.7% Responsible for grandchildren29 56.3% Not responsible for grandchildrenAsian 64 100.0% Not responsible for grandchildrenWhite alone, not Hispanic / Latino 10 23.2% Responsible for grandchildren32 76.8% Not responsible for grandchildrenHispanic or Latino 6 84.7% Responsible for grandchildren1 15.3% Not responsible for grandchildren