Races in Lexington, Massachusetts (MA) Detailed Stats
Data:
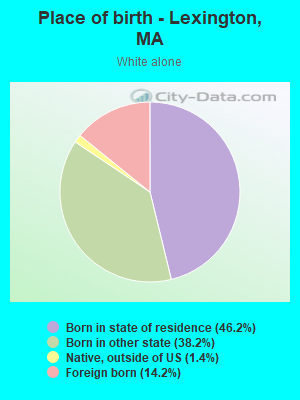
Races - White alone (%)
Races - White alone (% change since 2000)
Races - Black alone (%)
Races - Black alone (% change since 2000)
Races - American Indian alone (%)
Races - American Indian alone (% change since 2000)
Races - Asian alone (%)
Races - Asian alone (% change since 2000)
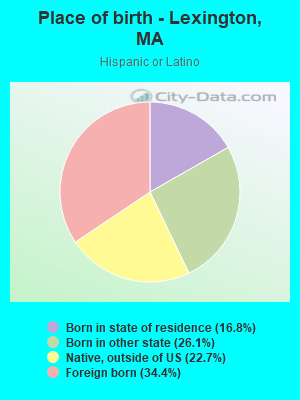
Races - Hispanic (%)
Races - Hispanic (% change since 2000)
Races - Native Hawaiian and Other Pacific Islander alone (%)
Races - Native Hawaiian and Other Pacific Islander alone (% change since 2000)
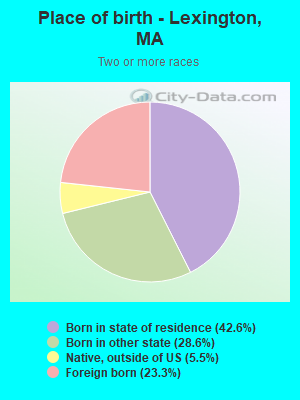
Races - Two or more races(%)
Races - Two or more races(% change since 2000)
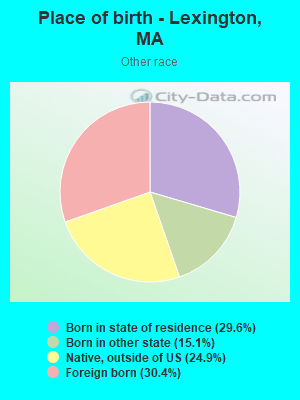
Races - Other race alone (%)
Races - Other race alone (% change since 2000)
Racial diversity
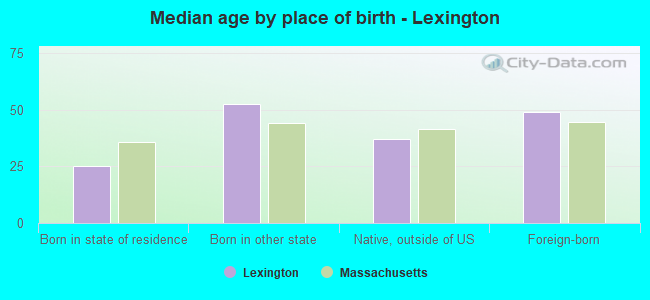
Place of birth - Born in state of residence (%)
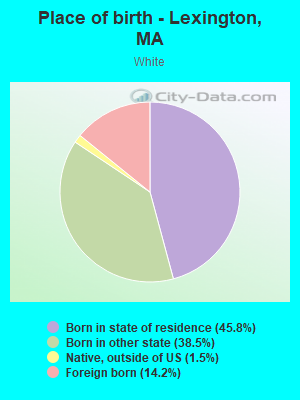
Place of birth - Born in state of residence (%) - White
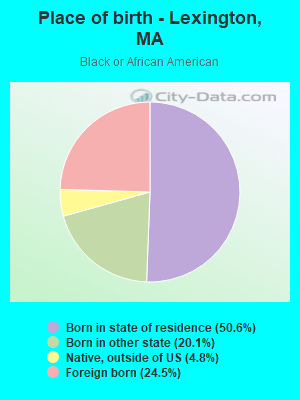
Place of birth - Born in state of residence (%) - Black or African American
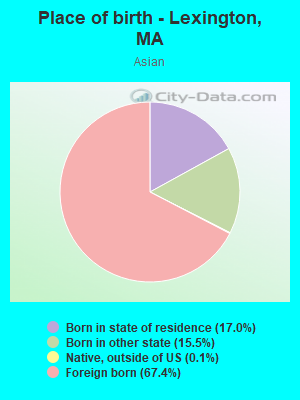
Place of birth - Born in state of residence (%) - Asian
Place of birth - Born in state of residence (%) - Hispanic or Latino
Place of birth - Born in state of residence (%) - American Indian and Alaska Native
Place of birth - Born in state of residence (%) - Multirace
Place of birth - Born in state of residence (%) - Other Race
Place of birth - Born in other state (%)
Place of birth - Born in other state (%) - White
Place of birth - Born in other state (%) - Black or African American
Place of birth - Born in other state (%) - Asian
Place of birth - Born in other state (%) - Hispanic or Latino
Place of birth - Born in other state (%) - American Indian and Alaska Native
Place of birth - Born in other state (%) - Multirace
Place of birth - Born in other state (%) - Other Race
Place of birth - Native, outside of US (%)
Place of birth - Native, outside of US (%) - White
Place of birth - Native, outside of US (%) - Black or African American
Place of birth - Native, outside of US (%) - Asian
Place of birth - Native, outside of US (%) - Hispanic or Latino
Place of birth - Native, outside of US (%) - American Indian and Alaska Native
Place of birth - Native, outside of US (%) - Multirace
Place of birth - Native, outside of US (%) - Other Race
Place of birth - Foreign born (%)
Place of birth - Foreign born (%) - White
Place of birth - Foreign born (%) - Black or African American
Place of birth - Foreign born (%) - Asian
Place of birth - Foreign born (%) - Hispanic or Latino
Place of birth - Foreign born (%) - American Indian and Alaska Native
Place of birth - Foreign born (%) - Multirace
Place of birth - Foreign born (%) - Other Race
Residents speaking English at home (%)
Residents speaking English at home - Born in the United States (%)
Residents speaking English at home - Native, born elsewhere (%)
Residents speaking English at home - Foreign born (%)
Residents speaking Spanish at home (%)
Residents speaking Spanish at home - Born in the United States (%)
Residents speaking Spanish at home - Native, born elsewhere (%)
Residents speaking Spanish at home - Foreign born (%)
Residents speaking other language at home (%)
Residents speaking other language at home - Born in the United States (%)
Residents speaking other language at home - Native, born elsewhere (%)
Residents speaking other language at home - Foreign born (%)
Marital status - Never married (%)
Marital status - Now married (%)
Marital status - Separated (%)
Marital status - Widowed (%)
Marital status - Divorced (%)
Ancestries Reported - Arab (%)
Ancestries Reported - Czech (%)
Ancestries Reported - Danish (%)
Ancestries Reported - Dutch (%)
Ancestries Reported - English (%)
Ancestries Reported - French (%)
Ancestries Reported - French Canadian (%)
Ancestries Reported - German (%)
Ancestries Reported - Greek (%)
Ancestries Reported - Hungarian (%)
Ancestries Reported - Irish (%)
Ancestries Reported - Italian (%)
Ancestries Reported - Lithuanian (%)
Ancestries Reported - Norwegian (%)
Ancestries Reported - Polish (%)
Ancestries Reported - Portuguese (%)
Ancestries Reported - Russian (%)
Ancestries Reported - Scotch-Irish (%)
Ancestries Reported - Scottish (%)
Ancestries Reported - Slovak (%)
Ancestries Reported - Subsaharan African (%)
Ancestries Reported - Swedish (%)
Ancestries Reported - Swiss (%)
Ancestries Reported - Ukrainian (%)
Ancestries Reported - United States (%)
Ancestries Reported - Welsh (%)
Ancestries Reported - West Indian (%)
Ancestries Reported - Other (%)
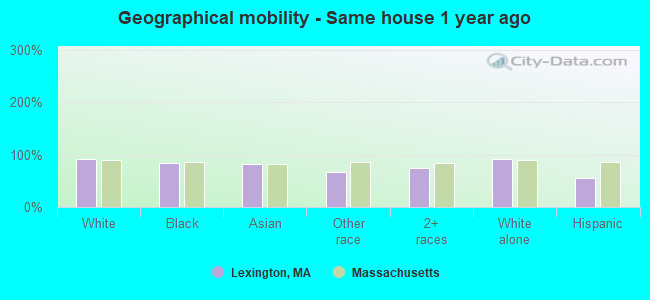
Geographical mobility - Same house 1 year ago (%)
Geographical mobility - Same house 1 year ago (%) - White
Geographical mobility - Same house 1 year ago (%) - Black or African American
Geographical mobility - Same house 1 year ago (%) - Asian
Geographical mobility - Same house 1 year ago (%) - Hispanic or Latino
Geographical mobility - Same house 1 year ago (%) - American Indian and Alaska Native
Geographical mobility - Same house 1 year ago (%) - Multirace
Geographical mobility - Same house 1 year ago (%) - Other Race
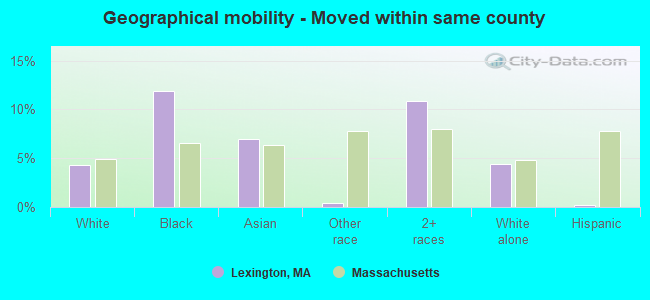
Geographical mobility - Moved within same county (%)
Geographical mobility - Moved within same county (%) - White
Geographical mobility - Moved within same county (%) - Black or African American
Geographical mobility - Moved within same county (%) - Asian
Geographical mobility - Moved within same county (%) - Hispanic or Latino
Geographical mobility - Moved within same county (%) - American Indian and Alaska Native
Geographical mobility - Moved within same county (%) - Multirace
Geographical mobility - Moved within same county (%) - Other Race
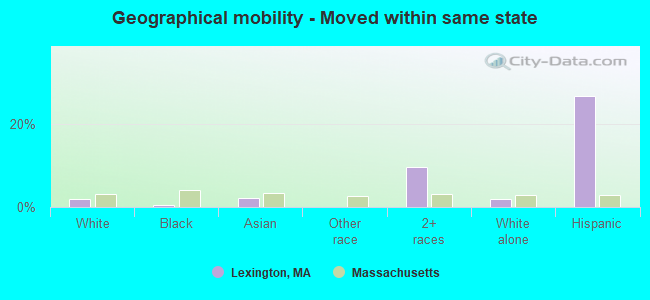
Geographical mobility - Moved from different county within same state (%)
Geographical mobility - Moved from different county within same state (%) - White
Geographical mobility - Moved from different county within same state (%) - Black or African American
Geographical mobility - Moved from different county within same state (%) - Asian
Geographical mobility - Moved from different county within same state (%) - Hispanic or Latino
Geographical mobility - Moved from different county within same state (%) - American Indian and Alaska Native
Geographical mobility - Moved from different county within same state (%) - Multirace
Geographical mobility - Moved from different county within same state (%) - Other Race
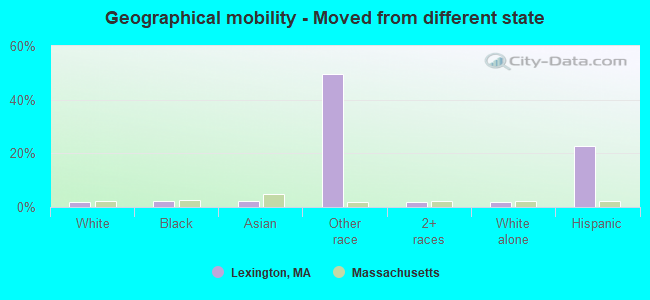
Geographical mobility - Moved from different state (%)
Geographical mobility - Moved from different state (%) - White
Geographical mobility - Moved from different state (%) - Black or African American
Geographical mobility - Moved from different state (%) - Asian
Geographical mobility - Moved from different state (%) - Hispanic or Latino
Geographical mobility - Moved from different state (%) - American Indian and Alaska Native
Geographical mobility - Moved from different state (%) - Multirace
Geographical mobility - Moved from different state (%) - Other Race
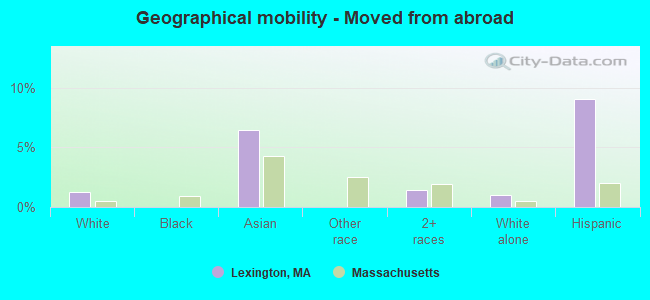
Geographical mobility - Moved from abroad (%)
Geographical mobility - Moved from abroad (%) - White
Geographical mobility - Moved from abroad (%) - Black or African American
Geographical mobility - Moved from abroad (%) - Asian
Geographical mobility - Moved from abroad (%) - Hispanic or Latino
Geographical mobility - Moved from abroad (%) - American Indian and Alaska Native
Geographical mobility - Moved from abroad (%) - Multirace
Geographical mobility - Moved from abroad (%) - Other Race
Place of birth for the foreign-born population - Ireland (%)
Place of birth for the foreign-born population - Denmark (%)
Place of birth for the foreign-born population - Norway (%)
Place of birth for the foreign-born population - Sweden (%)
Place of birth for the foreign-born population - United Kingdom (%)
Place of birth for the foreign-born population - England (%)
Place of birth for the foreign-born population - Scotland (%)
Place of birth for the foreign-born population - Other Northern Europe (%)
Place of birth for the foreign-born population - Austria (%)
Place of birth for the foreign-born population - Belgium (%)
Place of birth for the foreign-born population - France (%)
Place of birth for the foreign-born population - Germany (%)
Place of birth for the foreign-born population - Netherlands (%)
Place of birth for the foreign-born population - Switzerland (%)
Place of birth for the foreign-born population - Other Western Europe (%)
Place of birth for the foreign-born population - Greece (%)
Place of birth for the foreign-born population - Italy (%)
Place of birth for the foreign-born population - Portugal (%)
Place of birth for the foreign-born population - Spain (%)
Place of birth for the foreign-born population - Other Southern Europe (%)
Place of birth for the foreign-born population - Albania (%)
Place of birth for the foreign-born population - Belarus (%)
Place of birth for the foreign-born population - Bosnia and Herzegovina (%)
Place of birth for the foreign-born population - Bulgaria (%)
Place of birth for the foreign-born population - Croatia (%)
Place of birth for the foreign-born population - Czechoslovakia (%)
Place of birth for the foreign-born population - Hungary (%)
Place of birth for the foreign-born population - Latvia (%)
Place of birth for the foreign-born population - Lithuania (%)
Place of birth for the foreign-born population - North Macedonia (Macedonia) (%)
Place of birth for the foreign-born population - Moldova (%)
Place of birth for the foreign-born population - Poland (%)
Place of birth for the foreign-born population - Romania (%)
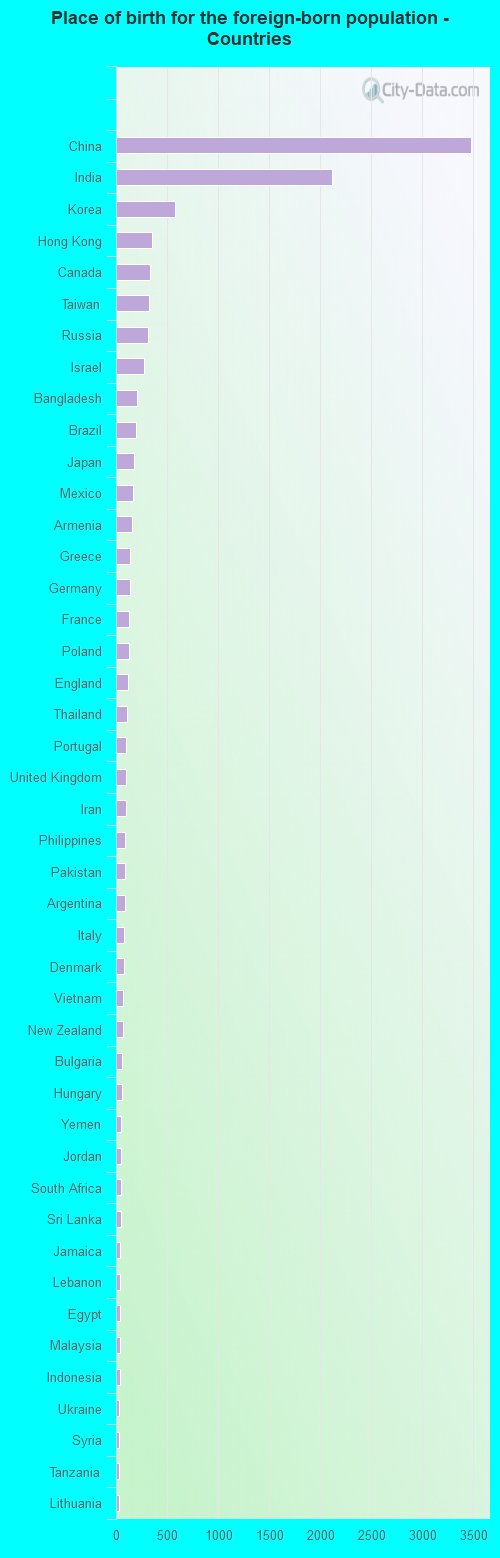
Place of birth for the foreign-born population - Russia (%)
Place of birth for the foreign-born population - Serbia (%)
Place of birth for the foreign-born population - Ukraine (%)
Place of birth for the foreign-born population - Other Eastern Europe (%)
Place of birth for the foreign-born population - China (%)
Place of birth for the foreign-born population - Hong Kong (%)
Place of birth for the foreign-born population - Taiwan (%)
Place of birth for the foreign-born population - Japan (%)
Place of birth for the foreign-born population - Korea (%)
Place of birth for the foreign-born population - Other Eastern Asia (%)
Place of birth for the foreign-born population - Afghanistan (%)
Place of birth for the foreign-born population - Bangladesh (%)
Place of birth for the foreign-born population - India (%)
Place of birth for the foreign-born population - Iran (%)
Place of birth for the foreign-born population - Kazakhstan (%)
Place of birth for the foreign-born population - Nepal (%)
Place of birth for the foreign-born population - Pakistan (%)
Place of birth for the foreign-born population - Sri Lanka (%)
Place of birth for the foreign-born population - Uzbekistan (%)
Place of birth for the foreign-born population - Other South Central Asia (%)
Place of birth for the foreign-born population - Burma (%)
Place of birth for the foreign-born population - Cambodia (%)
Place of birth for the foreign-born population - Indonesia (%)
Place of birth for the foreign-born population - Laos (%)
Place of birth for the foreign-born population - Malaysia (%)
Place of birth for the foreign-born population - Philippines (%)
Place of birth for the foreign-born population - Singapore (%)
Place of birth for the foreign-born population - Thailand (%)
Place of birth for the foreign-born population - Vietnam (%)
Place of birth for the foreign-born population - Other South Eastern Asia (%)
Place of birth for the foreign-born population - Armenia (%)
Place of birth for the foreign-born population - Iraq (%)
Place of birth for the foreign-born population - Israel (%)
Place of birth for the foreign-born population - Jordan (%)
Place of birth for the foreign-born population - Kuwait (%)
Place of birth for the foreign-born population - Lebanon (%)
Place of birth for the foreign-born population - Saudi Arabia (%)
Place of birth for the foreign-born population - Syria (%)
Place of birth for the foreign-born population - Turkey (%)
Place of birth for the foreign-born population - Yemen (%)
Place of birth for the foreign-born population - Other Western Asia (%)
Place of birth for the foreign-born population - Eritrea (%)
Place of birth for the foreign-born population - Ethiopia (%)
Place of birth for the foreign-born population - Kenya (%)
Place of birth for the foreign-born population - Somalia (%)
Place of birth for the foreign-born population - Uganda (%)
Place of birth for the foreign-born population - Zimbabwe (%)
Place of birth for the foreign-born population - Other Eastern Africa (%)
Place of birth for the foreign-born population - Cameroon (%)
Place of birth for the foreign-born population - Congo (%)
Place of birth for the foreign-born population - Democratic Republic of Congo (Zaire) (%)
Place of birth for the foreign-born population - Other Middle Africa (%)
Place of birth for the foreign-born population - Egypt (%)
Place of birth for the foreign-born population - Morocco (%)
Place of birth for the foreign-born population - Sudan (%)
Place of birth for the foreign-born population - Other Northern Africa (%)
Place of birth for the foreign-born population - South Africa (%)
Place of birth for the foreign-born population - Other Southern Africa (%)
Place of birth for the foreign-born population - Cabo Verde (%)
Place of birth for the foreign-born population - Ghana (%)
Place of birth for the foreign-born population - Liberia (%)
Place of birth for the foreign-born population - Nigeria (%)
Place of birth for the foreign-born population - Senegal (%)
Place of birth for the foreign-born population - Sierra Leone (%)
Place of birth for the foreign-born population - Other Western Africa (%)
Place of birth for the foreign-born population - Australia (%)
Place of birth for the foreign-born population - New Zealand (%)
Place of birth for the foreign-born population - Fiji (%)
Place of birth for the foreign-born population - Micronesia (%)
Place of birth for the foreign-born population - Bahamas (%)
Place of birth for the foreign-born population - Barbados (%)
Place of birth for the foreign-born population - Cuba (%)
Place of birth for the foreign-born population - Dominica (%)
Place of birth for the foreign-born population - Dominican Republic (%)
Place of birth for the foreign-born population - Grenada (%)
Place of birth for the foreign-born population - Haiti (%)
Place of birth for the foreign-born population - Jamaica (%)
Place of birth for the foreign-born population - St. Vincent and the Grenadines (%)
Place of birth for the foreign-born population - Trinidad and Tobago (%)
Place of birth for the foreign-born population - West Indies (%)
Place of birth for the foreign-born population - Other Caribbean (%)
Place of birth for the foreign-born population - Belize (%)
Place of birth for the foreign-born population - Costa Rica (%)
Place of birth for the foreign-born population - El Salvador (%)
Place of birth for the foreign-born population - Guatemala (%)
Place of birth for the foreign-born population - Honduras (%)
Place of birth for the foreign-born population - Mexico (%)
Place of birth for the foreign-born population - Nicaragua (%)
Place of birth for the foreign-born population - Panama (%)
Place of birth for the foreign-born population - Other Central America (%)
Place of birth for the foreign-born population - Argentina (%)
Place of birth for the foreign-born population - Bolivia (%)
Place of birth for the foreign-born population - Brazil (%)
Place of birth for the foreign-born population - Chile (%)
Place of birth for the foreign-born population - Colombia (%)
Place of birth for the foreign-born population - Ecuador (%)
Place of birth for the foreign-born population - Guyana (%)
Place of birth for the foreign-born population - Peru (%)
Place of birth for the foreign-born population - Uruguay (%)
Place of birth for the foreign-born population - Venezuela (%)
Place of birth for the foreign-born population - Other South America (%)
Place of birth for the foreign-born population - Canada (%)
Place of birth for the foreign-born population - Other Northern America (%)
Place of birth for the foreign-born population - Other (%)
Latest news about races in Lexington, MA collected exclusively by city-data.com from local newspapers, TV, and radio stations
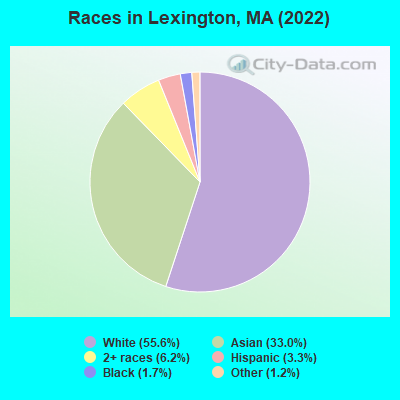
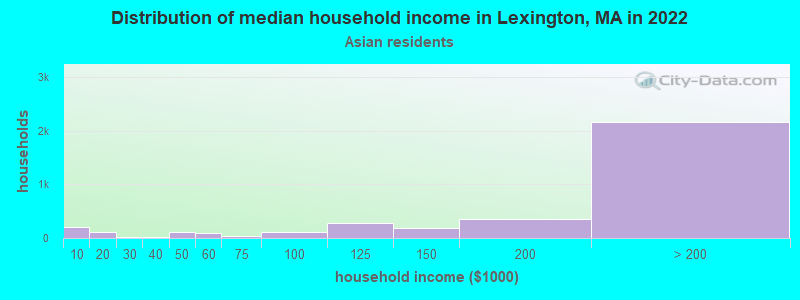
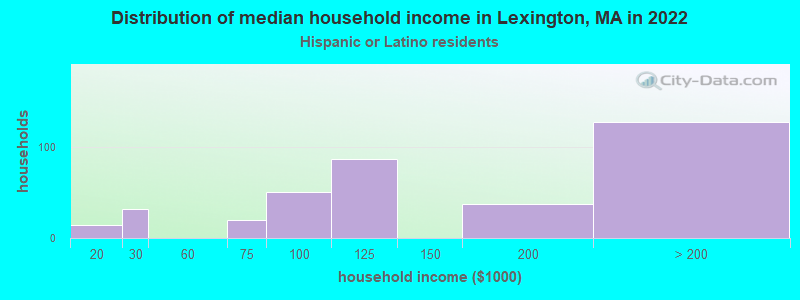
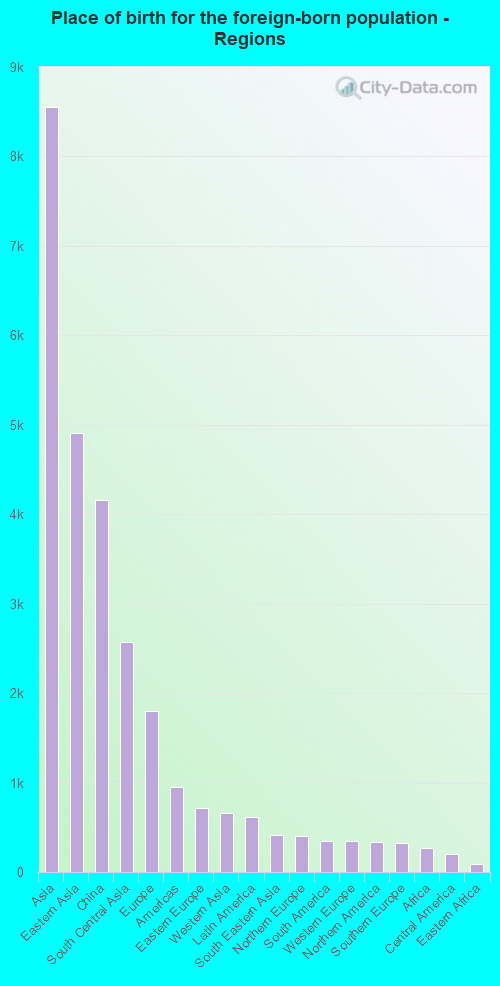
According to 2022 data, the most numerous races in Lexington, MA are White alone (18,966 residents), Hispanic (1,137 residents), and Asian alone (11,255 residents). 60.0% of Lexington residents speak English at home. 34.1% of Lexington, MA residents are foreign-born (24.2% born in Asia, 5.1% born in Europe), which is 47.3% greater than the foreign-born rate of 18.0% across the entire state of Massachusetts.
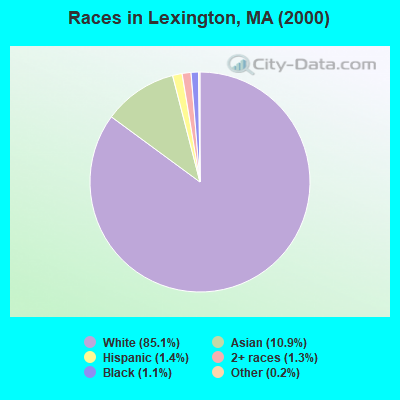
Race distribution in Lexington
2000 2022
5,198,359 81.9% White alone 428,729 6.8% Hispanic 318,329 5.0% Black alone 236,786 3.7% Asian alone 110,338 1.7% Two or more races 43,586 0.7% Other race alone 11,264 0.2% American Indian alone 1,706 0.03% Native Hawaiian and Other
4,676,627 67.0% White alone 911,038 13.0% Hispanic 501,463 7.2% Asian alone 459,740 6.6% Black alone 341,889 4.9% Two or more races 84,403 1.2% Other race alone 5,838 0.08% American Indian alone 976 0.01% Native Hawaiian and Other
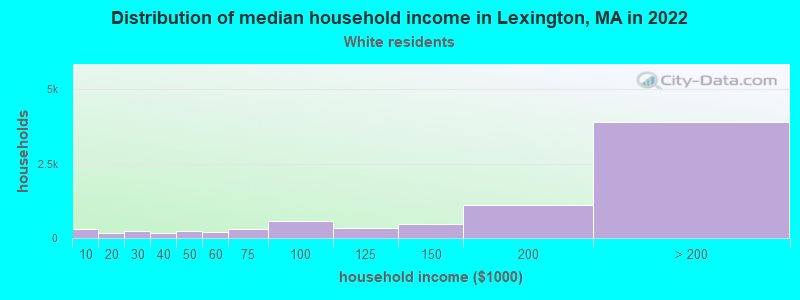
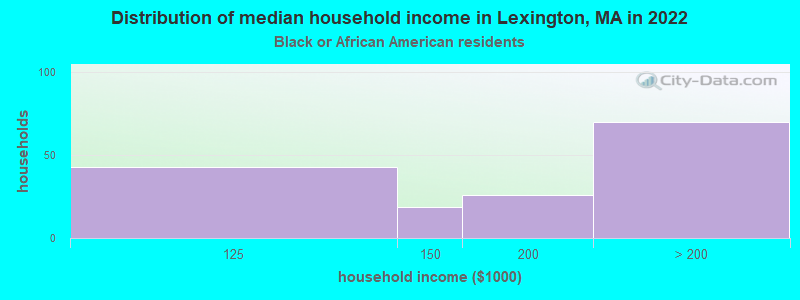
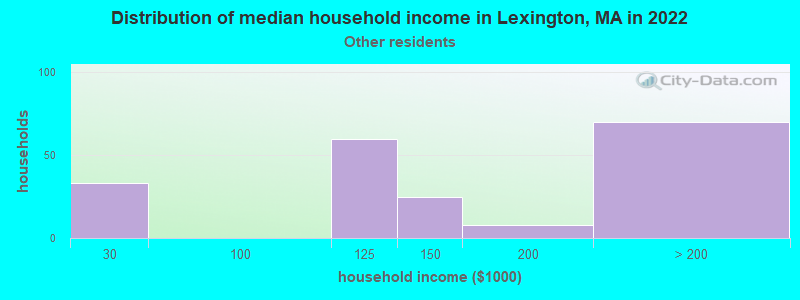
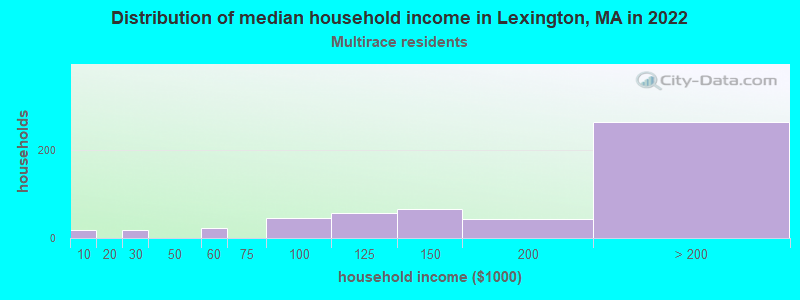
Income and house value in Lexington Median household income in 2022 $193,661 White non-Hispanic householders$157,951 Black householdersover $200,000 Asian householders$117,659 Some other race householders$186,876 Two or more races householders$137,964 Hispanic or Latino race householdersMedian 2022 house value over $1,000,000 White Non-Hispanic householdersover $1,000,000 Black or African American householders over $1,000,000 Asian householders$380,918 Some other race householdersover $1,000,000 Two or more races householdersover $1,000,000 Hispanic or Latino householders
Median age by race in Lexington
55.1 Median age for White residents55.4 55.0 26.5 Median age for Black or African American residents37.2 23.1 -761,044,175.9 Median age for American Indian / Alaska Native residents-751,004,015.3 -1,078,313,251.9 44.0 Median age for Asian residents44.5 43.0 -514,227,641.8 Median age for Native Hawaiian / Pacific Islander residents-513,131,312.6 -508,717,948.2 22.5 Median age for Other race residents14.8 27.2 18.6 Median age for Two or more races residents17.8 19.2 54.9 Median age for White alone residents55.2 54.9 34.6 Median age for Hispanic or Latino residents35.1 34.3
Owner/renter occupied households by race in Lexington
House owners and renters - White residents 6,732 83.9% Owner occupied1,294 16.1% Renter occupiedHouse owners and renters - Black or African American residents 125 69.2% Owner occupied56 30.8% Renter occupiedHouse owners and renters - Asian residents 3,096 83.7% Owner occupied604 16.3% Renter occupiedHouse owners and renters - Other race residents 153 83.9% Owner occupied29 16.1% Renter occupiedHouse owners and renters - Two or more races residents 387 68.7% Owner occupied176 31.3% Renter occupiedHouse owners and renters - White alone residents 6,734 84.4% Owner occupied1,241 15.6% Renter occupiedHouse owners and renters - Hispanic or Latino residents 205 59.9% Owner occupied137 40.1% Renter occupied
Language usage in Lexington
English speakers - Total 60.0% of residents of Lexington speak English at home.
2.2% of residents speak Spanish at home 582 79.2% Speak English very well153 20.8% Speak English less than very well38.6% of residents speak other language at home 10,267 80.8% Speak English very well2,443 19.2% Speak English less than very well
English speakers - Born in the United States 86.7% of residents of Lexington speak English at home.
1.3% of residents speak Spanish at home 121 93.1% Speak English very well9 6.9% Speak English less than very well12.7% of residents speak other language at home 1,132 90.6% Speak English very well117 9.4% Speak English less than very well
English speakers - Native, born elsewhere 38.8% of residents of Lexington speak English at home.
37.0% of residents speak Spanish at home 174 70.4% Speak English very well73 29.6% Speak English less than very well24.0% of residents speak other language at home 130 81.2% Speak English very well30 18.8% Speak English less than very well
English speakers - Foreign-born 15.9% of residents of Lexington speak English at home.
2.4% of residents speak Spanish at home 209 75.5% Speak English very well68 24.5% Speak English less than very well81.0% of residents speak other language at home 7,156 76.2% Speak English very well2,232 23.8% Speak English less than very well
White (Caucasian) - Speak only English Native:
93.5% (14,737)Foreign-born:
33.5% (903)
White (Caucasian) - Speak another language Native:
6.3% (998)Foreign-born:
66.1% (1,781)
Black or African American - Speak only English Native:
82.0% (320)Foreign-born:
27.4% (37)
Black or African American - Speak another language Native:
17.2% (67)Foreign-born:
72.5% (98)
Asian - Speak only English Native:
45.6% (1,512)Foreign-born:
9.6% (726)
Asian - Speak another language Native:
54.4% (1,801)Foreign-born:
90.6% (6,879)
Other race - Speak only English Native:
28.8% (124)Foreign-born:
22.6% (48)
Other race - Speak another language Native:
67.2% (290)Foreign-born:
79.0% (169)
Two or more races - Speak only English Native:
68.9% (1,373)Foreign-born:
13.3% (87)
Two or more races - Speak another language Native:
31.1% (619)Foreign-born:
86.5% (567)
White alone - Speak only English Native:
93.5% (14,733)Foreign-born:
31.3% (843)
White alone - Speak another language Native:
6.4% (1,014)Foreign-born:
68.2% (1,840)
Hispanic or Latino - Speak only English Native:
31.5% (202)Foreign-born:
36.1% (144)
Hispanic or Latino - Speak another language Native:
66.7% (428)Foreign-born:
64.0% (255)
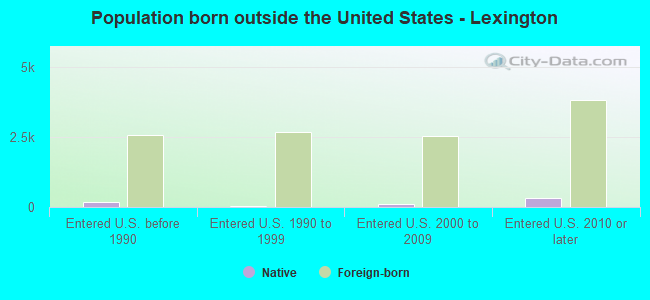
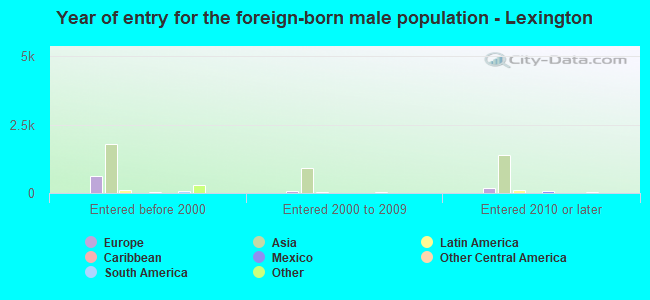
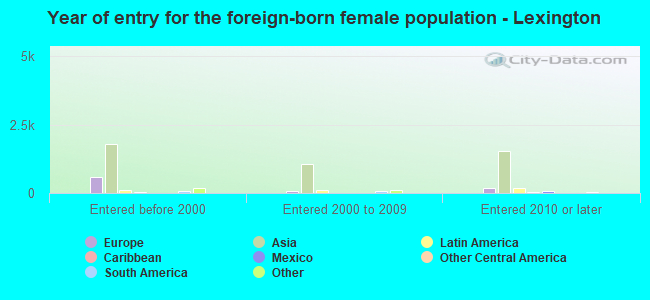
Foreign-born residents in Lexington 11,641 residents are foreign born (24.2% Asia , 5.1% Europe ).
This city:
34.1%Massachusetts:
17.6%
Marital status for residents in Lexington Marital status - White (Caucasian) population 15 years and over
Males 20.6% Never married71.2% Now married0.6% Separated2.9% Widowed4.8% DivorcedFemales 22.0% Never married61.5% Now married0.4% Separated8.7% Widowed7.4% DivorcedWomen who gave birth in the past 12 months Now married:
100.0% (103)Unmarried:
0.0% (0)
Women who did not give birth in the past 12 months Now married:
50.4% (1,483)Unmarried:
49.6% (1,461)
Marital status - Black or African American population 15 years and over
Males 53.3% Never married21.1% Now married0.0% Separated20.6% Widowed5.0% DivorcedFemales 60.0% Never married40.0% Now married0.0% Separated0.0% Widowed0.0% DivorcedWomen who gave birth in the past 12 months Now married:
0.0% (0)Unmarried:
100.0% (21)
Women who did not give birth in the past 12 months Now married:
30.3% (36)Unmarried:
69.7% (83)
Marital status - Asian population 15 years and over
Males 15.6% Never married79.4% Now married0.7% Separated1.5% Widowed2.8% DivorcedFemales 18.0% Never married72.2% Now married1.8% Separated4.2% Widowed3.8% DivorcedWomen who gave birth in the past 12 months Now married:
100.0% (56)Unmarried:
0.0% (0)
Women who did not give birth in the past 12 months Now married:
71.9% (2,199)Unmarried:
28.1% (860)
Marital status - Other race population 15 years and over
Males 12.9% Never married87.1% Now married0.0% Separated0.0% Widowed0.0% DivorcedFemales 33.7% Never married51.6% Now married0.0% Separated4.9% Widowed9.8% DivorcedWomen who did not give birth in the past 12 months Now married:
48.1% (116)Unmarried:
51.9% (125)
Marital status - Two or more races population 15 years and over
Males 39.1% Never married47.2% Now married4.8% Separated0.0% Widowed8.8% DivorcedFemales 46.2% Never married47.4% Now married0.0% Separated1.0% Widowed5.4% DivorcedWomen who gave birth in the past 12 months Now married:
100.0% (38)Unmarried:
0.0% (0)
Women who did not give birth in the past 12 months Now married:
40.2% (287)Unmarried:
59.8% (426)
Marital status - White alone, not Hispanic / Latino population 15 years and over
Males 20.3% Never married71.4% Now married0.6% Separated2.9% Widowed4.8% DivorcedFemales 21.5% Never married61.8% Now married0.4% Separated8.8% Widowed7.5% DivorcedWomen who gave birth in the past 12 months Now married:
100.0% (105)Unmarried:
0.0% (0)
Women who did not give birth in the past 12 months Now married:
50.9% (1,512)Unmarried:
49.1% (1,458)
Marital status - Hispanic or Latino population 15 years and over
Males 25.4% Never married69.8% Now married1.8% Separated0.0% Widowed3.0% DivorcedFemales 42.4% Never married53.9% Now married0.0% Separated0.0% Widowed3.7% DivorcedWomen who did not give birth in the past 12 months Now married:
44.3% (119)Unmarried:
55.7% (150)
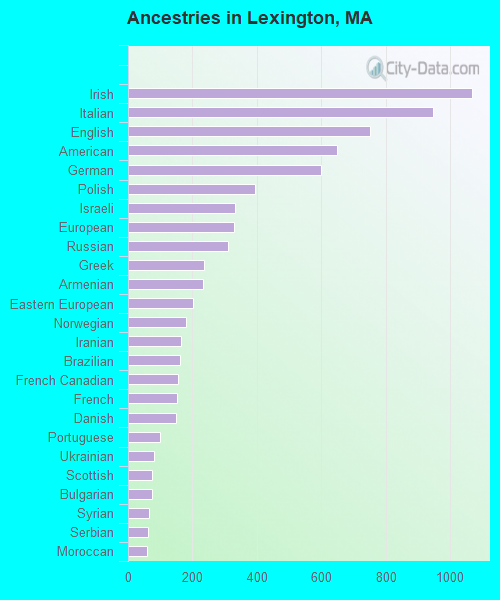
Ancestries in Lexington
1,068 5.5% Irish948 4.9% Italian751 3.9% English650 3.4% American599 3.1% German396 2.1% Polish332 1.7% Israeli328 1.7% European311 1.6% Russian237 1.2% Greek234 1.2% Armenian201 1.0% Eastern European181 0.9% Norwegian164 0.9% Iranian161 0.8% Brazilian156 0.8% French Canadian151 0.8% French148 0.8% Danish100 0.5% Portuguese80 0.4% Ukrainian76 0.4% Scottish76 0.4% Bulgarian64 0.3% Syrian62 0.3% Serbian60 0.3% Moroccan55 0.3% Northern European53 0.3% African52 0.3% Jordanian50 0.3% Canadian49 0.3% New Zealander44 0.2% Scotch-Irish44 0.2% Welsh42 0.2% Albanian41 0.2% Lithuanian41 0.2% Lebanese40 0.2% Hungarian33 0.2% Turkish32 0.2% Finnish31 0.2% Swedish27 0.1% Jamaican24 0.1% Cypriot23 0.1% Czech23 0.1% Cape Verdean23 0.1% Swiss20 0.1% Dutch19 0.10% Nigerian16 0.08% Belgian15 0.08% Austrian13 0.07% British11 0.06% Romanian8 0.04% Scandinavian5 0.03% Slovak
Children Nativity (place of birth) in Lexington
Children under 6 years - Living with two parents Both parents native 602 100.0% NativeBoth parents foreign-born 517 87.1% Native76 12.9% Foreign-bornOne native, one foreign-born parent 112 100.0% NativeChildren under 6 years - Living with one parent Native parent 127 100.0% NativeForeign-born parent 32 58.3% Native23 41.7% Foreign-bornChildren 6 to 17 years - Living with two parents Both parents native 2,185 100.0% NativeBoth parents foreign-born 2,560 76.1% Native803 23.9% Foreign-bornOne native, one foreign-born parent 697 99.5% Native4 0.5% Foreign-bornChildren 6 to 17 years - Living with one parent Native parent 67 100.0% NativeForeign-born parent 555 61.6% Native347 38.4% Foreign-born
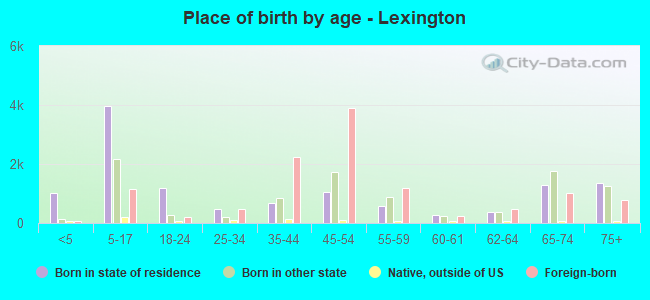
Place of birth for residents in Lexington
Grandparents responsible for own grandchildren in Lexington
Grandparents (30 to 59 years) White / Caucasian 13 74.8% Responsible for grandchildren5 25.2% Not responsible for grandchildrenAsian 71 100.0% Responsible for grandchildrenWhite alone, not Hispanic / Latino 15 75.3% Responsible for grandchildren5 24.7% Not responsible for grandchildrenGrandparents (60 years and over) White / Caucasian 72 45.3% Responsible for grandchildren87 54.7% Not responsible for grandchildrenAsian 4 1.2% Responsible for grandchildren344 98.8% Not responsible for grandchildrenWhite alone, not Hispanic / Latino 72 45.6% Responsible for grandchildren86 54.4% Not responsible for grandchildren