Races in Levittown, New York (NY) Detailed Stats
Data:
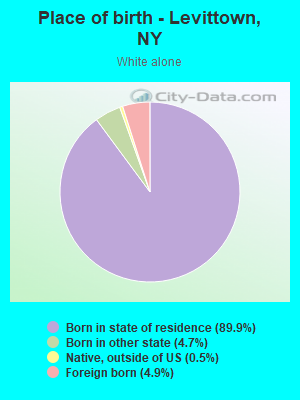
Races - White alone (%)
Races - White alone (% change since 2000)
Races - Black alone (%)
Races - Black alone (% change since 2000)
Races - American Indian alone (%)
Races - American Indian alone (% change since 2000)
Races - Asian alone (%)
Races - Asian alone (% change since 2000)
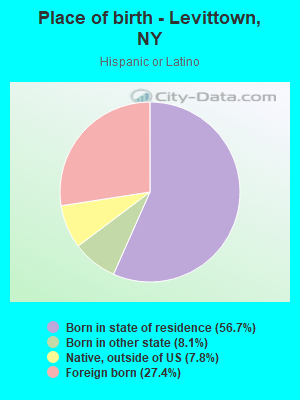
Races - Hispanic (%)
Races - Hispanic (% change since 2000)
Races - Native Hawaiian and Other Pacific Islander alone (%)
Races - Native Hawaiian and Other Pacific Islander alone (% change since 2000)
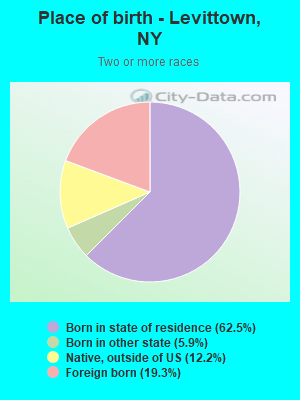
Races - Two or more races(%)
Races - Two or more races(% change since 2000)
Races - Other race alone (%)
Races - Other race alone (% change since 2000)
Racial diversity
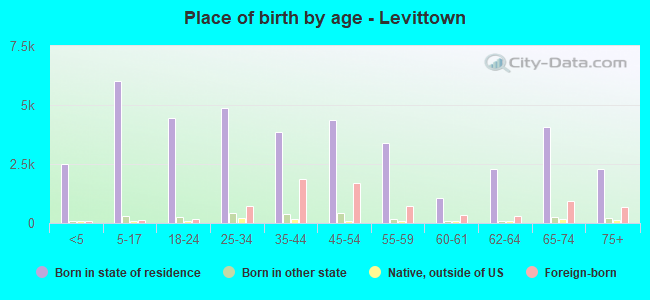
Place of birth - Born in state of residence (%)
Place of birth - Born in state of residence (%) - White
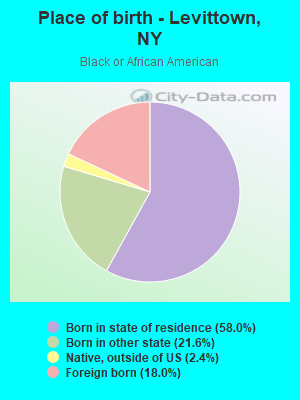
Place of birth - Born in state of residence (%) - Black or African American
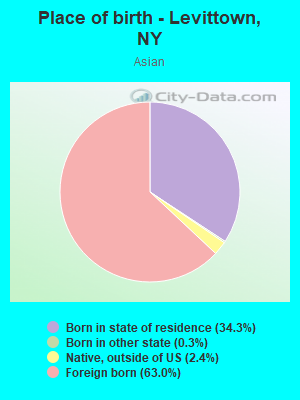
Place of birth - Born in state of residence (%) - Asian
Place of birth - Born in state of residence (%) - Hispanic or Latino
Place of birth - Born in state of residence (%) - American Indian and Alaska Native
Place of birth - Born in state of residence (%) - Multirace
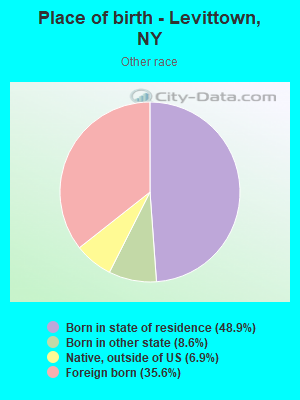
Place of birth - Born in state of residence (%) - Other Race
Place of birth - Born in other state (%)
Place of birth - Born in other state (%) - White
Place of birth - Born in other state (%) - Black or African American
Place of birth - Born in other state (%) - Asian
Place of birth - Born in other state (%) - Hispanic or Latino
Place of birth - Born in other state (%) - American Indian and Alaska Native
Place of birth - Born in other state (%) - Multirace
Place of birth - Born in other state (%) - Other Race
Place of birth - Native, outside of US (%)
Place of birth - Native, outside of US (%) - White
Place of birth - Native, outside of US (%) - Black or African American
Place of birth - Native, outside of US (%) - Asian
Place of birth - Native, outside of US (%) - Hispanic or Latino
Place of birth - Native, outside of US (%) - American Indian and Alaska Native
Place of birth - Native, outside of US (%) - Multirace
Place of birth - Native, outside of US (%) - Other Race
Place of birth - Foreign born (%)
Place of birth - Foreign born (%) - White
Place of birth - Foreign born (%) - Black or African American
Place of birth - Foreign born (%) - Asian
Place of birth - Foreign born (%) - Hispanic or Latino
Place of birth - Foreign born (%) - American Indian and Alaska Native
Place of birth - Foreign born (%) - Multirace
Place of birth - Foreign born (%) - Other Race
Residents speaking English at home (%)
Residents speaking English at home - Born in the United States (%)
Residents speaking English at home - Native, born elsewhere (%)
Residents speaking English at home - Foreign born (%)
Residents speaking Spanish at home (%)
Residents speaking Spanish at home - Born in the United States (%)
Residents speaking Spanish at home - Native, born elsewhere (%)
Residents speaking Spanish at home - Foreign born (%)
Residents speaking other language at home (%)
Residents speaking other language at home - Born in the United States (%)
Residents speaking other language at home - Native, born elsewhere (%)
Residents speaking other language at home - Foreign born (%)
Marital status - Never married (%)
Marital status - Now married (%)
Marital status - Separated (%)
Marital status - Widowed (%)
Marital status - Divorced (%)
Ancestries Reported - Arab (%)
Ancestries Reported - Czech (%)
Ancestries Reported - Danish (%)
Ancestries Reported - Dutch (%)
Ancestries Reported - English (%)
Ancestries Reported - French (%)
Ancestries Reported - French Canadian (%)
Ancestries Reported - German (%)
Ancestries Reported - Greek (%)
Ancestries Reported - Hungarian (%)
Ancestries Reported - Irish (%)
Ancestries Reported - Italian (%)
Ancestries Reported - Lithuanian (%)
Ancestries Reported - Norwegian (%)
Ancestries Reported - Polish (%)
Ancestries Reported - Portuguese (%)
Ancestries Reported - Russian (%)
Ancestries Reported - Scotch-Irish (%)
Ancestries Reported - Scottish (%)
Ancestries Reported - Slovak (%)
Ancestries Reported - Subsaharan African (%)
Ancestries Reported - Swedish (%)
Ancestries Reported - Swiss (%)
Ancestries Reported - Ukrainian (%)
Ancestries Reported - United States (%)
Ancestries Reported - Welsh (%)
Ancestries Reported - West Indian (%)
Ancestries Reported - Other (%)
Geographical mobility - Same house 1 year ago (%)
Geographical mobility - Same house 1 year ago (%) - White
Geographical mobility - Same house 1 year ago (%) - Black or African American
Geographical mobility - Same house 1 year ago (%) - Asian
Geographical mobility - Same house 1 year ago (%) - Hispanic or Latino
Geographical mobility - Same house 1 year ago (%) - American Indian and Alaska Native
Geographical mobility - Same house 1 year ago (%) - Multirace
Geographical mobility - Same house 1 year ago (%) - Other Race
Geographical mobility - Moved within same county (%)
Geographical mobility - Moved within same county (%) - White
Geographical mobility - Moved within same county (%) - Black or African American
Geographical mobility - Moved within same county (%) - Asian
Geographical mobility - Moved within same county (%) - Hispanic or Latino
Geographical mobility - Moved within same county (%) - American Indian and Alaska Native
Geographical mobility - Moved within same county (%) - Multirace
Geographical mobility - Moved within same county (%) - Other Race
Geographical mobility - Moved from different county within same state (%)
Geographical mobility - Moved from different county within same state (%) - White
Geographical mobility - Moved from different county within same state (%) - Black or African American
Geographical mobility - Moved from different county within same state (%) - Asian
Geographical mobility - Moved from different county within same state (%) - Hispanic or Latino
Geographical mobility - Moved from different county within same state (%) - American Indian and Alaska Native
Geographical mobility - Moved from different county within same state (%) - Multirace
Geographical mobility - Moved from different county within same state (%) - Other Race
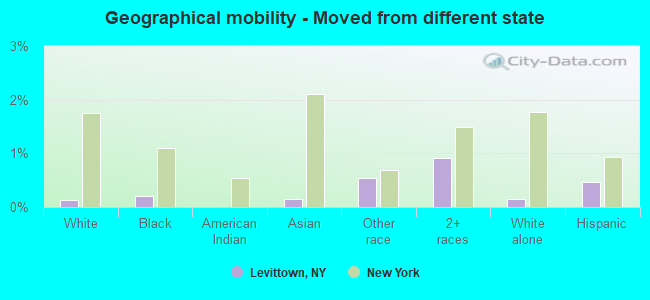
Geographical mobility - Moved from different state (%)
Geographical mobility - Moved from different state (%) - White
Geographical mobility - Moved from different state (%) - Black or African American
Geographical mobility - Moved from different state (%) - Asian
Geographical mobility - Moved from different state (%) - Hispanic or Latino
Geographical mobility - Moved from different state (%) - American Indian and Alaska Native
Geographical mobility - Moved from different state (%) - Multirace
Geographical mobility - Moved from different state (%) - Other Race
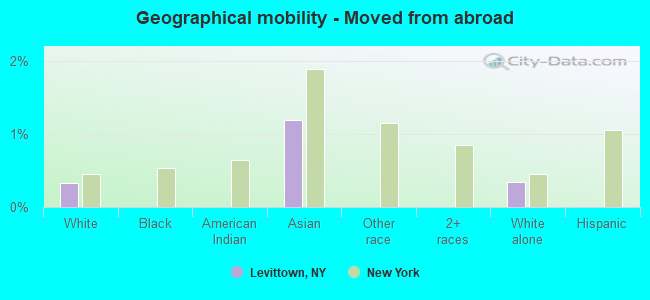
Geographical mobility - Moved from abroad (%)
Geographical mobility - Moved from abroad (%) - White
Geographical mobility - Moved from abroad (%) - Black or African American
Geographical mobility - Moved from abroad (%) - Asian
Geographical mobility - Moved from abroad (%) - Hispanic or Latino
Geographical mobility - Moved from abroad (%) - American Indian and Alaska Native
Geographical mobility - Moved from abroad (%) - Multirace
Geographical mobility - Moved from abroad (%) - Other Race
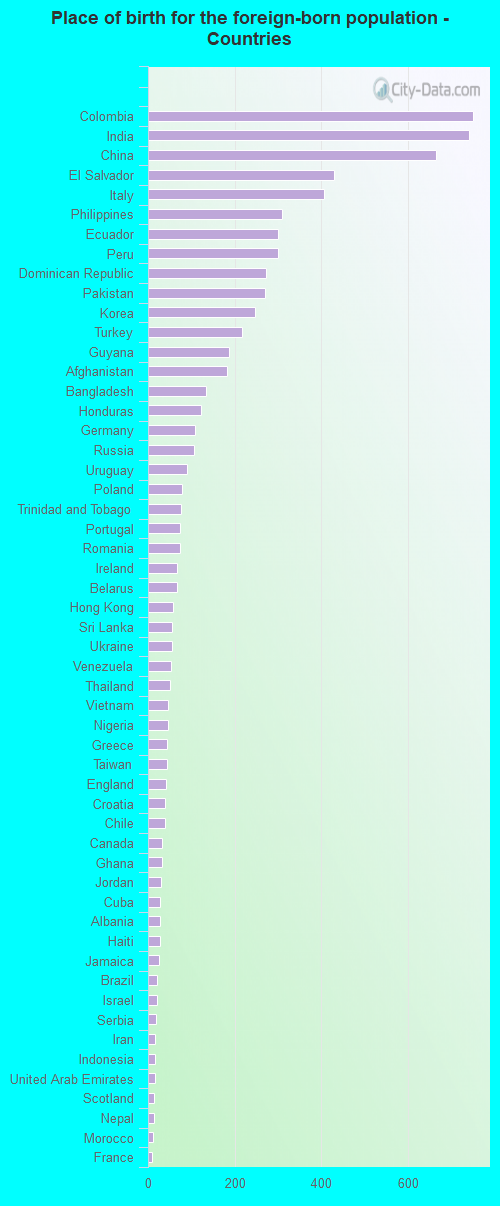
Place of birth for the foreign-born population - Ireland (%)
Place of birth for the foreign-born population - Denmark (%)
Place of birth for the foreign-born population - Norway (%)
Place of birth for the foreign-born population - Sweden (%)
Place of birth for the foreign-born population - United Kingdom (%)
Place of birth for the foreign-born population - England (%)
Place of birth for the foreign-born population - Scotland (%)
Place of birth for the foreign-born population - Other Northern Europe (%)
Place of birth for the foreign-born population - Austria (%)
Place of birth for the foreign-born population - Belgium (%)
Place of birth for the foreign-born population - France (%)
Place of birth for the foreign-born population - Germany (%)
Place of birth for the foreign-born population - Netherlands (%)
Place of birth for the foreign-born population - Switzerland (%)
Place of birth for the foreign-born population - Other Western Europe (%)
Place of birth for the foreign-born population - Greece (%)
Place of birth for the foreign-born population - Italy (%)
Place of birth for the foreign-born population - Portugal (%)
Place of birth for the foreign-born population - Spain (%)
Place of birth for the foreign-born population - Other Southern Europe (%)
Place of birth for the foreign-born population - Albania (%)
Place of birth for the foreign-born population - Belarus (%)
Place of birth for the foreign-born population - Bosnia and Herzegovina (%)
Place of birth for the foreign-born population - Bulgaria (%)
Place of birth for the foreign-born population - Croatia (%)
Place of birth for the foreign-born population - Czechoslovakia (%)
Place of birth for the foreign-born population - Hungary (%)
Place of birth for the foreign-born population - Latvia (%)
Place of birth for the foreign-born population - Lithuania (%)
Place of birth for the foreign-born population - North Macedonia (Macedonia) (%)
Place of birth for the foreign-born population - Moldova (%)
Place of birth for the foreign-born population - Poland (%)
Place of birth for the foreign-born population - Romania (%)
Place of birth for the foreign-born population - Russia (%)
Place of birth for the foreign-born population - Serbia (%)
Place of birth for the foreign-born population - Ukraine (%)
Place of birth for the foreign-born population - Other Eastern Europe (%)
Place of birth for the foreign-born population - China (%)
Place of birth for the foreign-born population - Hong Kong (%)
Place of birth for the foreign-born population - Taiwan (%)
Place of birth for the foreign-born population - Japan (%)
Place of birth for the foreign-born population - Korea (%)
Place of birth for the foreign-born population - Other Eastern Asia (%)
Place of birth for the foreign-born population - Afghanistan (%)
Place of birth for the foreign-born population - Bangladesh (%)
Place of birth for the foreign-born population - India (%)
Place of birth for the foreign-born population - Iran (%)
Place of birth for the foreign-born population - Kazakhstan (%)
Place of birth for the foreign-born population - Nepal (%)
Place of birth for the foreign-born population - Pakistan (%)
Place of birth for the foreign-born population - Sri Lanka (%)
Place of birth for the foreign-born population - Uzbekistan (%)
Place of birth for the foreign-born population - Other South Central Asia (%)
Place of birth for the foreign-born population - Burma (%)
Place of birth for the foreign-born population - Cambodia (%)
Place of birth for the foreign-born population - Indonesia (%)
Place of birth for the foreign-born population - Laos (%)
Place of birth for the foreign-born population - Malaysia (%)
Place of birth for the foreign-born population - Philippines (%)
Place of birth for the foreign-born population - Singapore (%)
Place of birth for the foreign-born population - Thailand (%)
Place of birth for the foreign-born population - Vietnam (%)
Place of birth for the foreign-born population - Other South Eastern Asia (%)
Place of birth for the foreign-born population - Armenia (%)
Place of birth for the foreign-born population - Iraq (%)
Place of birth for the foreign-born population - Israel (%)
Place of birth for the foreign-born population - Jordan (%)
Place of birth for the foreign-born population - Kuwait (%)
Place of birth for the foreign-born population - Lebanon (%)
Place of birth for the foreign-born population - Saudi Arabia (%)
Place of birth for the foreign-born population - Syria (%)
Place of birth for the foreign-born population - Turkey (%)
Place of birth for the foreign-born population - Yemen (%)
Place of birth for the foreign-born population - Other Western Asia (%)
Place of birth for the foreign-born population - Eritrea (%)
Place of birth for the foreign-born population - Ethiopia (%)
Place of birth for the foreign-born population - Kenya (%)
Place of birth for the foreign-born population - Somalia (%)
Place of birth for the foreign-born population - Uganda (%)
Place of birth for the foreign-born population - Zimbabwe (%)
Place of birth for the foreign-born population - Other Eastern Africa (%)
Place of birth for the foreign-born population - Cameroon (%)
Place of birth for the foreign-born population - Congo (%)
Place of birth for the foreign-born population - Democratic Republic of Congo (Zaire) (%)
Place of birth for the foreign-born population - Other Middle Africa (%)
Place of birth for the foreign-born population - Egypt (%)
Place of birth for the foreign-born population - Morocco (%)
Place of birth for the foreign-born population - Sudan (%)
Place of birth for the foreign-born population - Other Northern Africa (%)
Place of birth for the foreign-born population - South Africa (%)
Place of birth for the foreign-born population - Other Southern Africa (%)
Place of birth for the foreign-born population - Cabo Verde (%)
Place of birth for the foreign-born population - Ghana (%)
Place of birth for the foreign-born population - Liberia (%)
Place of birth for the foreign-born population - Nigeria (%)
Place of birth for the foreign-born population - Senegal (%)
Place of birth for the foreign-born population - Sierra Leone (%)
Place of birth for the foreign-born population - Other Western Africa (%)
Place of birth for the foreign-born population - Australia (%)
Place of birth for the foreign-born population - New Zealand (%)
Place of birth for the foreign-born population - Fiji (%)
Place of birth for the foreign-born population - Micronesia (%)
Place of birth for the foreign-born population - Bahamas (%)
Place of birth for the foreign-born population - Barbados (%)
Place of birth for the foreign-born population - Cuba (%)
Place of birth for the foreign-born population - Dominica (%)
Place of birth for the foreign-born population - Dominican Republic (%)
Place of birth for the foreign-born population - Grenada (%)
Place of birth for the foreign-born population - Haiti (%)
Place of birth for the foreign-born population - Jamaica (%)
Place of birth for the foreign-born population - St. Vincent and the Grenadines (%)
Place of birth for the foreign-born population - Trinidad and Tobago (%)
Place of birth for the foreign-born population - West Indies (%)
Place of birth for the foreign-born population - Other Caribbean (%)
Place of birth for the foreign-born population - Belize (%)
Place of birth for the foreign-born population - Costa Rica (%)
Place of birth for the foreign-born population - El Salvador (%)
Place of birth for the foreign-born population - Guatemala (%)
Place of birth for the foreign-born population - Honduras (%)
Place of birth for the foreign-born population - Mexico (%)
Place of birth for the foreign-born population - Nicaragua (%)
Place of birth for the foreign-born population - Panama (%)
Place of birth for the foreign-born population - Other Central America (%)
Place of birth for the foreign-born population - Argentina (%)
Place of birth for the foreign-born population - Bolivia (%)
Place of birth for the foreign-born population - Brazil (%)
Place of birth for the foreign-born population - Chile (%)
Place of birth for the foreign-born population - Colombia (%)
Place of birth for the foreign-born population - Ecuador (%)
Place of birth for the foreign-born population - Guyana (%)
Place of birth for the foreign-born population - Peru (%)
Place of birth for the foreign-born population - Uruguay (%)
Place of birth for the foreign-born population - Venezuela (%)
Place of birth for the foreign-born population - Other South America (%)
Place of birth for the foreign-born population - Canada (%)
Place of birth for the foreign-born population - Other Northern America (%)
Place of birth for the foreign-born population - Other (%)
Latest news about races in Levittown, NY collected exclusively by city-data.com from local newspapers, TV, and radio stations
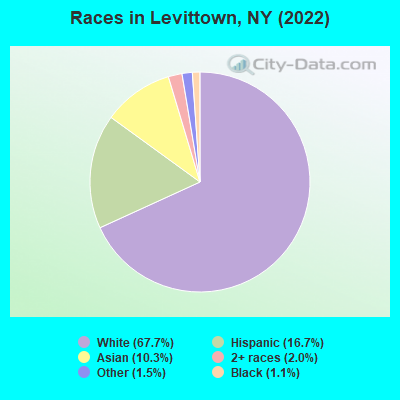
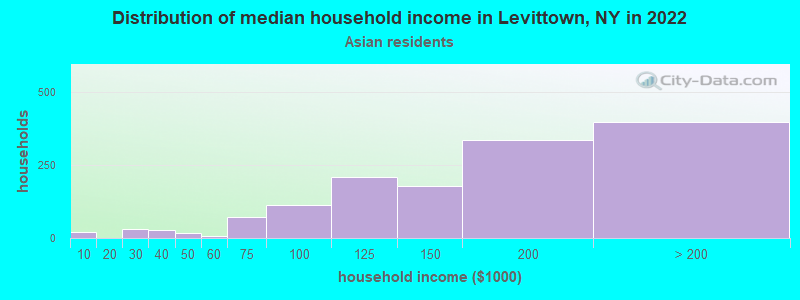
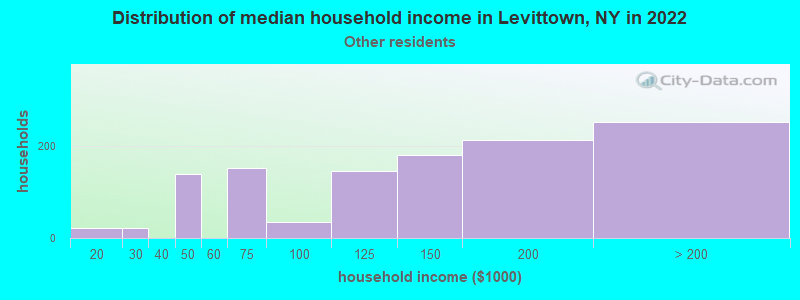
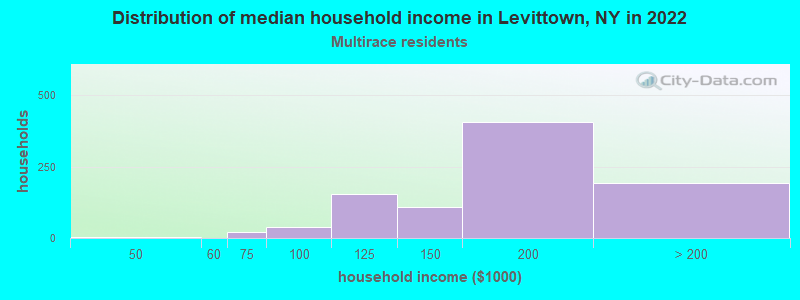
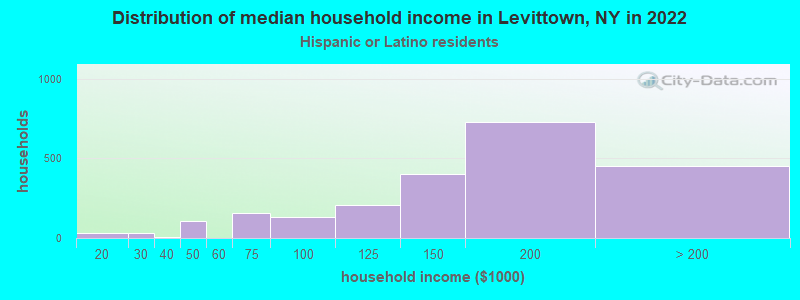
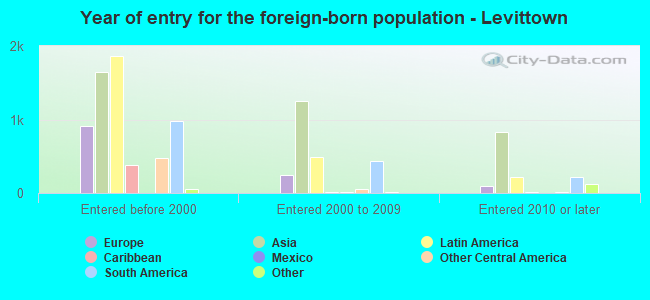
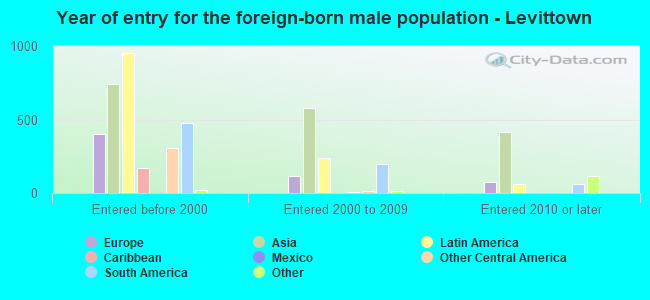
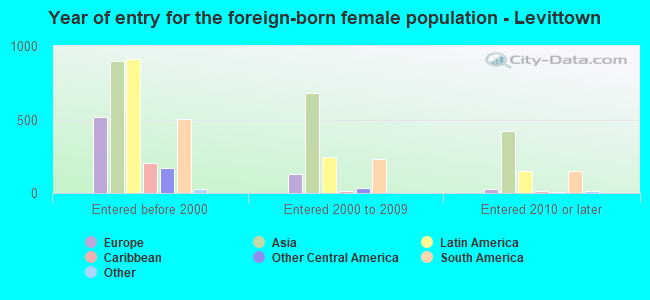
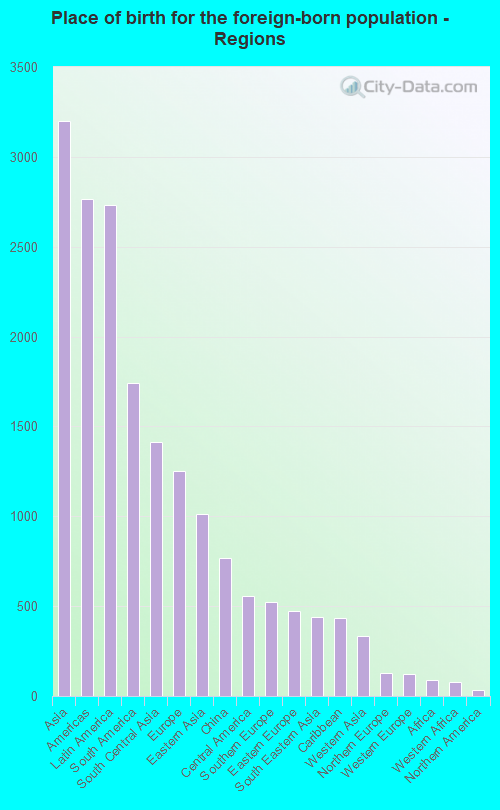
According to 2022 data, the most numerous races in Levittown, NY are White alone (34,236 residents), Hispanic (8,439 residents), and Black alone (537 residents). 76.3% of Levittown residents speak English at home. 14.4% of Levittown, NY residents are foreign-born (6.4% born in Asia, 5.4% born in Latin America, 2.5% born in Europe), which is 52.3% less than the foreign-born rate of 22.0% across the entire state of New York.
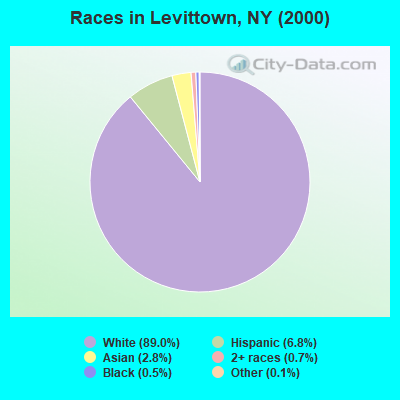
Race distribution in Levittown
2000 2022
11,760,981 62.0% White alone 2,867,583 15.1% Hispanic 2,812,623 14.8% Black alone 1,035,926 5.5% Asian alone 366,116 1.9% Two or more races 75,499 0.4% Other race alone 52,499 0.3% American Indian alone 5,230 0.03% Native Hawaiian and Other
10,408,933 52.9% White alone 3,867,299 19.7% Hispanic 2,633,840 13.4% Black alone 1,776,286 9.0% Asian alone 732,670 3.7% Two or more races 216,110 1.1% Other race alone 35,082 0.2% American Indian alone 6,931 0.04% Native Hawaiian and Other
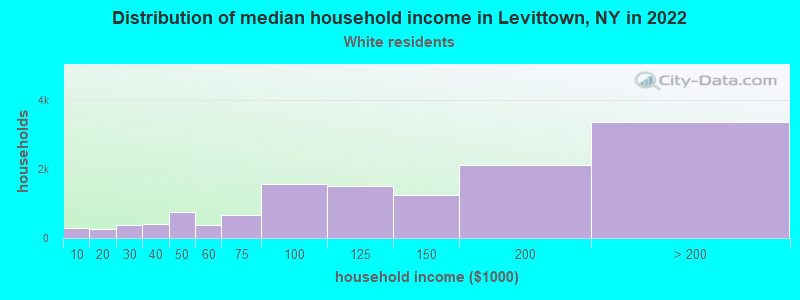
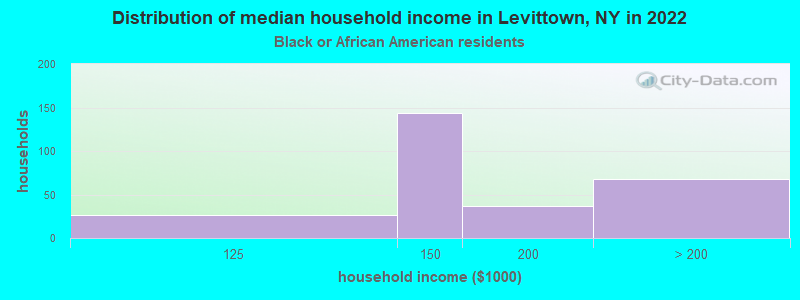
Income and house value in Levittown Median household income in 2022 $127,121 White non-Hispanic householders$145,702 Black householders$148,933 Asian householders$143,850 Some other race householders$150,977 Two or more races householders$152,991 Hispanic or Latino race householdersMedian 2022 house value $530,247 White Non-Hispanic householders$481,430 Black or African American householders $595,335 Asian householdersover $1,000,000 Native Hawaiian and other Pacific Islander householders$572,610 Some other race householders$600,385 Two or more races householders$546,519 Hispanic or Latino householders
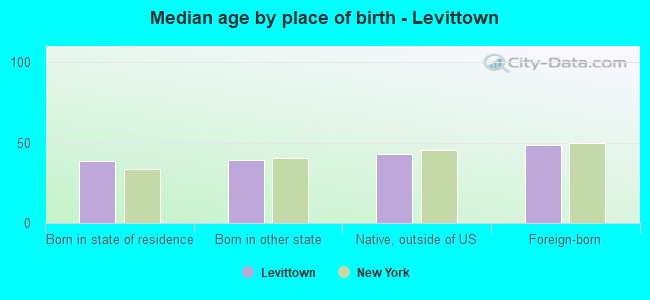
Median age by race in Levittown
48.5 Median age for White residents46.0 50.7 37.2 Median age for Black or African American residents36.2 43.0 -855,158,729.3 Median age for American Indian / Alaska Native residents-607,543,322.5 -837,121,211.3 37.4 Median age for Asian residents38.0 37.6 -487,992,314.6 Median age for Native Hawaiian / Pacific Islander residents-477,502,295.2 -497,387,669.3 37.7 Median age for Other race residents36.9 36.7 30.1 Median age for Two or more races residents30.4 25.9 49.6 Median age for White alone residents47.5 51.0 35.9 Median age for Hispanic or Latino residents35.1 36.3
Owner/renter occupied households by race in Levittown
House owners and renters - White residents 12,032 93.8% Owner occupied798 6.2% Renter occupiedHouse owners and renters - Black or African American residents 281 100.0% Owner occupiedHouse owners and renters - Asian residents 1,442 98.2% Owner occupied27 1.8% Renter occupiedHouse owners and renters - Other race residents 1,156 95.5% Owner occupied55 4.5% Renter occupiedHouse owners and renters - Two or more races residents 806 89.6% Owner occupied94 10.4% Renter occupiedHouse owners and renters - White alone residents 11,677 93.8% Owner occupied776 6.2% Renter occupiedHouse owners and renters - Hispanic or Latino residents 2,001 90.9% Owner occupied199 9.1% Renter occupied
Language usage in Levittown
English speakers - Total 76.3% of residents of Levittown speak English at home.
10.4% of residents speak Spanish at home 3,826 76.6% Speak English very well1,166 23.4% Speak English less than very well12.9% of residents speak other language at home 4,288 69.3% Speak English very well1,899 30.7% Speak English less than very well
English speakers - Born in the United States 85.4% of residents of Levittown speak English at home.
16.4% of residents speak Spanish at home 399 97.1% Speak English very well12 2.9% Speak English less than very well2.1% of residents speak other language at home 49 92.5% Speak English very well4 7.5% Speak English less than very well
English speakers - Native, born elsewhere 40.1% of residents of Levittown speak English at home.
33.6% of residents speak Spanish at home 288 83.0% Speak English very well59 17.0% Speak English less than very well25.3% of residents speak other language at home 262 100.0% Speak English very well
English speakers - Foreign-born 19.1% of residents of Levittown speak English at home.
27.6% of residents speak Spanish at home 1,065 51.1% Speak English very well1,021 48.9% Speak English less than very well52.6% of residents speak other language at home 2,220 55.9% Speak English very well1,752 44.1% Speak English less than very well
White (Caucasian) - Speak only English Native:
96.0% (31,013)Foreign-born:
38.1% (670)
White (Caucasian) - Speak another language Native:
4.5% (1,469)Foreign-born:
63.8% (1,123)
Black or African American - Speak only English Native:
83.8% (434)Foreign-born:
10.7% (12)
Black or African American - Speak another language Native:
16.7% (86)Foreign-born:
90.5% (105)
Asian - Speak only English Native:
33.7% (547)Foreign-born:
14.6% (485)
Asian - Speak another language Native:
65.2% (1,057)Foreign-born:
84.7% (2,805)
Other race - Speak only English Native:
38.3% (939)Foreign-born:
6.5% (103)
Other race - Speak another language Native:
61.5% (1,509)Foreign-born:
93.8% (1,487)
Two or more races - Speak only English Native:
67.2% (2,052)Foreign-born:
18.2% (156)
Two or more races - Speak another language Native:
32.4% (989)Foreign-born:
81.8% (699)
White alone - Speak only English Native:
96.1% (29,945)Foreign-born:
36.2% (608)
White alone - Speak another language Native:
4.1% (1,263)Foreign-born:
63.6% (1,068)
Hispanic or Latino - Speak only English Native:
56.4% (3,093)Foreign-born:
7.4% (174)
Hispanic or Latino - Speak another language Native:
43.4% (2,377)Foreign-born:
92.6% (2,190)
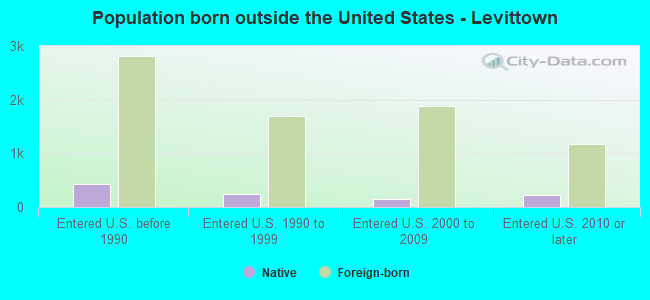
Foreign-born residents in Levittown 7,308 residents are foreign born (6.4% Asia , 5.4% Latin America , 2.5% Europe ).
This city:
14.4%New York:
22.6%
Marital status for residents in Levittown Marital status - White (Caucasian) population 15 years and over
Males 33.6% Never married57.7% Now married1.0% Separated3.7% Widowed4.1% DivorcedFemales 30.1% Never married51.4% Now married1.0% Separated8.9% Widowed8.6% DivorcedWomen who gave birth in the past 12 months Now married:
94.8% (372)Unmarried:
5.2% (21)
Women who did not give birth in the past 12 months Now married:
41.0% (2,868)Unmarried:
59.0% (4,135)
Marital status - Black or African American population 15 years and over
Males 45.8% Never married38.0% Now married16.2% Separated0.0% Widowed0.0% DivorcedFemales 76.8% Never married14.7% Now married0.0% Separated8.5% Widowed0.0% DivorcedWomen who gave birth in the past 12 months Now married:
100.0% (15)Unmarried:
0.0% (0)
Women who did not give birth in the past 12 months Now married:
10.3% (16)Unmarried:
89.7% (140)
Marital status - Asian population 15 years and over
Males 28.2% Never married67.8% Now married0.0% Separated2.9% Widowed1.1% DivorcedFemales 27.7% Never married57.0% Now married1.4% Separated7.1% Widowed6.7% DivorcedWomen who gave birth in the past 12 months Now married:
100.0% (73)Unmarried:
0.0% (0)
Women who did not give birth in the past 12 months Now married:
56.6% (800)Unmarried:
43.4% (613)
Marital status - Other race population 15 years and over
Males 27.0% Never married68.2% Now married0.0% Separated1.9% Widowed2.9% DivorcedFemales 33.3% Never married56.9% Now married0.0% Separated3.2% Widowed6.7% DivorcedWomen who gave birth in the past 12 months Now married:
100.0% (65)Unmarried:
0.0% (0)
Women who did not give birth in the past 12 months Now married:
43.5% (471)Unmarried:
56.5% (610)
Marital status - Two or more races population 15 years and over
Males 39.3% Never married59.2% Now married1.5% Separated0.0% Widowed0.0% DivorcedFemales 34.3% Never married49.8% Now married4.7% Separated6.2% Widowed5.0% DivorcedWomen who gave birth in the past 12 months Now married:
89.5% (51)Unmarried:
10.5% (6)
Women who did not give birth in the past 12 months Now married:
44.8% (458)Unmarried:
55.2% (564)
Marital status - White alone, not Hispanic / Latino population 15 years and over
Males 33.7% Never married57.4% Now married1.0% Separated3.7% Widowed4.2% DivorcedFemales 30.0% Never married51.7% Now married1.1% Separated9.0% Widowed8.3% DivorcedWomen who gave birth in the past 12 months Now married:
94.6% (386)Unmarried:
5.4% (22)
Women who did not give birth in the past 12 months Now married:
40.4% (2,722)Unmarried:
59.6% (4,017)
Marital status - Hispanic or Latino population 15 years and over
Males 33.5% Never married62.8% Now married0.0% Separated1.6% Widowed2.0% DivorcedFemales 29.8% Never married53.5% Now married1.6% Separated6.0% Widowed9.1% DivorcedWomen who gave birth in the past 12 months Now married:
96.3% (102)Unmarried:
3.7% (4)
Women who did not give birth in the past 12 months Now married:
46.7% (902)Unmarried:
53.3% (1,028)
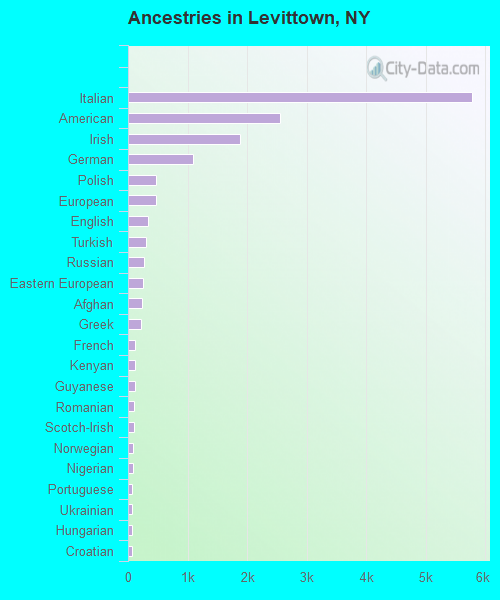
Ancestries in Levittown
5,777 25.0% Italian2,549 11.0% American1,886 8.2% Irish1,086 4.7% German469 2.0% Polish469 2.0% European342 1.5% English308 1.3% Turkish271 1.2% Russian254 1.1% Eastern European243 1.1% Afghan212 0.9% Greek126 0.5% French119 0.5% Kenyan112 0.5% Guyanese109 0.5% Romanian104 0.5% Scotch-Irish85 0.4% Norwegian78 0.3% Nigerian75 0.3% Portuguese67 0.3% Ukrainian66 0.3% Hungarian60 0.3% Croatian46 0.2% Lithuanian42 0.2% Albanian38 0.2% Haitian30 0.1% Maltese27 0.1% West Indian25 0.1% Jamaican20 0.09% Scottish14 0.06% British14 0.06% Serbian13 0.06% Palestinian13 0.06% Austrian12 0.05% Iranian10 0.04% French Canadian10 0.04% Israeli8 0.03% Canadian8 0.03% Scandinavian7 0.03% Moroccan7 0.03% Czechoslovakian7 0.03% Northern European6 0.03% Swedish5 0.02% Welsh4 0.02% Belgian
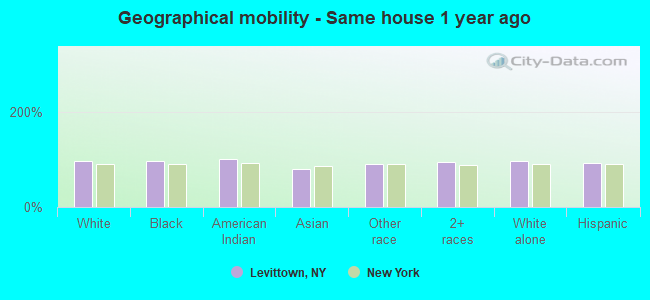
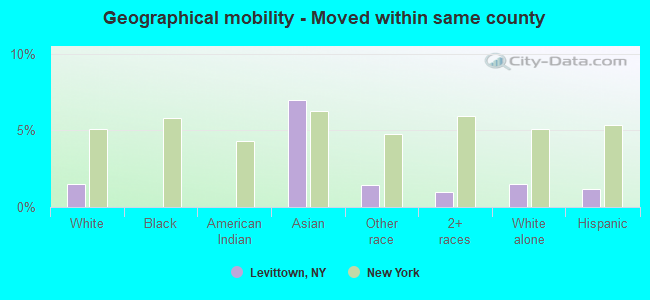
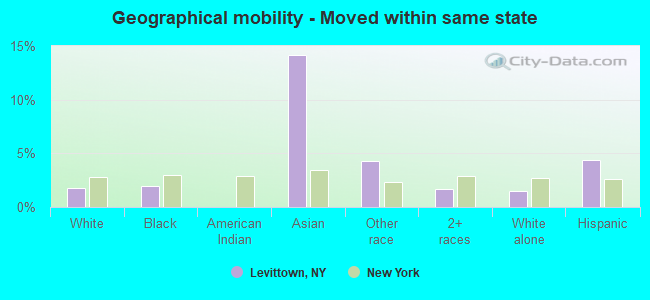
Geographical mobility in Levittown Same house 1 year ago 33,393 95.9% White (Caucasian)640 96.9% Black or African American7 100.0% American Indian / Alaska Native4,161 80.2% Asian3,894 90.9% Other race4,064 95.3% Two or more races32,626 96.1% White alone, not Hispanic / Latino7,672 92.7% Hispanic or LatinoMoved within same county 524 1.5% White / Caucasian364 7.0% Asian61 1.4% Other race42 1.0% Two or more races519 1.5% White alone, not Hispanic / Latino97 1.2% Hispanic or LatinoMoved within same state 625 1.8% White / Caucasian13 1.9% Black or African American733 14.1% Asian184 4.3% Other race70 1.6% Two or more races510 1.5% White alone, not Hispanic / Latino365 4.4% Hispanic or LatinoMoved from different state 47 0.1% White / Caucasian1 0.2% Black or African American8 0.2% Asian23 0.5% Other race39 0.9% Two or more races48 0.1% White alone, not Hispanic / Latino39 0.5% Hispanic or LatinoMoved from abroad 113 0.3% White62 1.2% Asian117 0.3% White alone, not Hispanic / Latino
Children Nativity (place of birth) in Levittown
Children under 6 years - Living with two parents Both parents native 1,679 100.0% NativeBoth parents foreign-born 520 100.0% NativeOne native, one foreign-born parent 349 100.0% NativeChildren under 6 years - Living with one parent Native parent 360 100.0% NativeForeign-born parent 30 100.0% NativeChildren 6 to 17 years - Living with two parents Both parents native 2,717 99.1% Native25 0.9% Foreign-bornBoth parents foreign-born 1,187 96.1% Native48 3.9% Foreign-bornOne native, one foreign-born parent 935 95.4% Native45 4.6% Foreign-bornChildren 6 to 17 years - Living with one parent Native parent 771 100.0% NativeForeign-born parent 178 47.2% Native199 52.8% Foreign-born
Grandparents responsible for own grandchildren in Levittown
Grandparents (30 to 59 years) White / Caucasian 12 17.0% Responsible for grandchildren60 83.0% Not responsible for grandchildrenOther race 179 100.0% Not responsible for grandchildrenTwo or more races 27 61.6% Responsible for grandchildren17 38.4% Not responsible for grandchildrenWhite alone, not Hispanic / Latino 13 28.9% Responsible for grandchildren32 71.1% Not responsible for grandchildrenHispanic or Latino 12 7.3% Responsible for grandchildren150 92.7% Not responsible for grandchildrenGrandparents (60 years and over) White / Caucasian 33 8.9% Responsible for grandchildren340 91.1% Not responsible for grandchildrenOther race 4 5.9% Responsible for grandchildren71 94.1% Not responsible for grandchildrenTwo or more races 82 100.0% Not responsible for grandchildrenWhite alone, not Hispanic / Latino 31 8.7% Responsible for grandchildren327 91.3% Not responsible for grandchildrenHispanic or Latino 7 5.0% Responsible for grandchildren141 95.0% Not responsible for grandchildren