Races in Leisure City, Florida (FL) Detailed Stats
Data:
Races - White alone (%)
Races - White alone (% change since 2000)
Races - Black alone (%)
Races - Black alone (% change since 2000)
Races - American Indian alone (%)
Races - American Indian alone (% change since 2000)
Races - Asian alone (%)
Races - Asian alone (% change since 2000)
Races - Hispanic (%)
Races - Hispanic (% change since 2000)
Races - Native Hawaiian and Other Pacific Islander alone (%)
Races - Native Hawaiian and Other Pacific Islander alone (% change since 2000)
Races - Two or more races(%)
Races - Two or more races(% change since 2000)
Races - Other race alone (%)
Races - Other race alone (% change since 2000)
Racial diversity
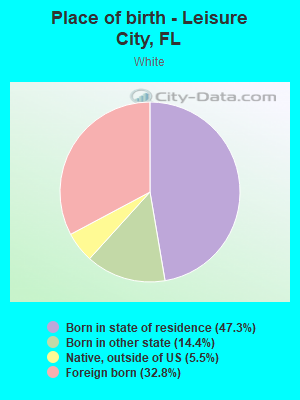
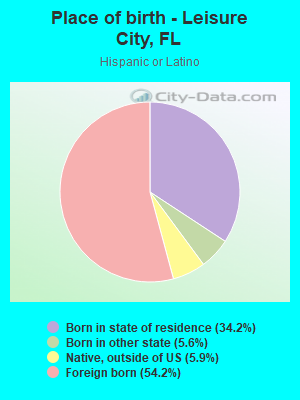
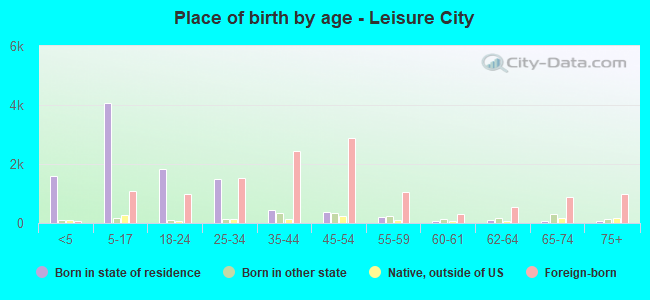
Place of birth - Born in state of residence (%)
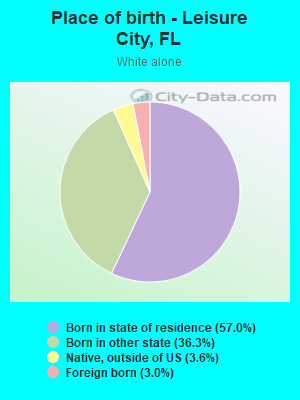
Place of birth - Born in state of residence (%) - White
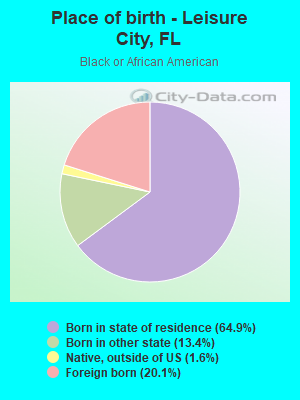
Place of birth - Born in state of residence (%) - Black or African American
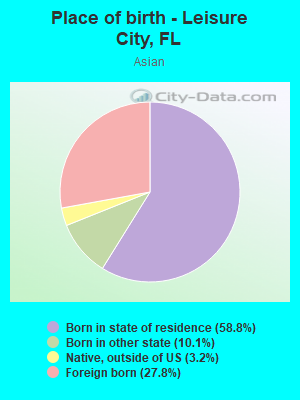
Place of birth - Born in state of residence (%) - Asian
Place of birth - Born in state of residence (%) - Hispanic or Latino
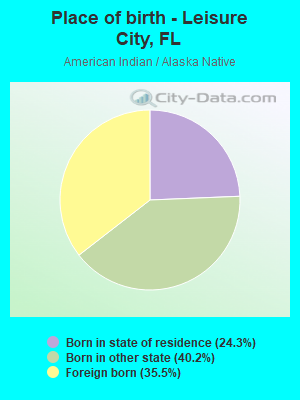
Place of birth - Born in state of residence (%) - American Indian and Alaska Native
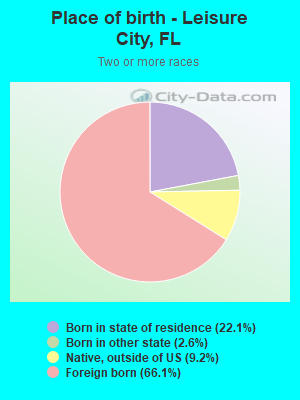
Place of birth - Born in state of residence (%) - Multirace
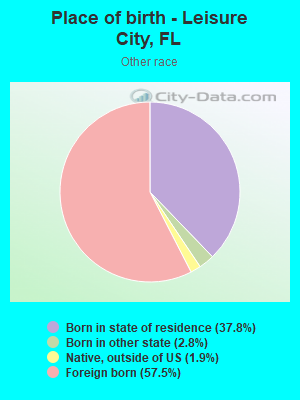
Place of birth - Born in state of residence (%) - Other Race
Place of birth - Born in other state (%)
Place of birth - Born in other state (%) - White
Place of birth - Born in other state (%) - Black or African American
Place of birth - Born in other state (%) - Asian
Place of birth - Born in other state (%) - Hispanic or Latino
Place of birth - Born in other state (%) - American Indian and Alaska Native
Place of birth - Born in other state (%) - Multirace
Place of birth - Born in other state (%) - Other Race
Place of birth - Native, outside of US (%)
Place of birth - Native, outside of US (%) - White
Place of birth - Native, outside of US (%) - Black or African American
Place of birth - Native, outside of US (%) - Asian
Place of birth - Native, outside of US (%) - Hispanic or Latino
Place of birth - Native, outside of US (%) - American Indian and Alaska Native
Place of birth - Native, outside of US (%) - Multirace
Place of birth - Native, outside of US (%) - Other Race
Place of birth - Foreign born (%)
Place of birth - Foreign born (%) - White
Place of birth - Foreign born (%) - Black or African American
Place of birth - Foreign born (%) - Asian
Place of birth - Foreign born (%) - Hispanic or Latino
Place of birth - Foreign born (%) - American Indian and Alaska Native
Place of birth - Foreign born (%) - Multirace
Place of birth - Foreign born (%) - Other Race
Residents speaking English at home (%)
Residents speaking English at home - Born in the United States (%)
Residents speaking English at home - Native, born elsewhere (%)
Residents speaking English at home - Foreign born (%)
Residents speaking Spanish at home (%)
Residents speaking Spanish at home - Born in the United States (%)
Residents speaking Spanish at home - Native, born elsewhere (%)
Residents speaking Spanish at home - Foreign born (%)
Residents speaking other language at home (%)
Residents speaking other language at home - Born in the United States (%)
Residents speaking other language at home - Native, born elsewhere (%)
Residents speaking other language at home - Foreign born (%)
Marital status - Never married (%)
Marital status - Now married (%)
Marital status - Separated (%)
Marital status - Widowed (%)
Marital status - Divorced (%)
Ancestries Reported - Arab (%)
Ancestries Reported - Czech (%)
Ancestries Reported - Danish (%)
Ancestries Reported - Dutch (%)
Ancestries Reported - English (%)
Ancestries Reported - French (%)
Ancestries Reported - French Canadian (%)
Ancestries Reported - German (%)
Ancestries Reported - Greek (%)
Ancestries Reported - Hungarian (%)
Ancestries Reported - Irish (%)
Ancestries Reported - Italian (%)
Ancestries Reported - Lithuanian (%)
Ancestries Reported - Norwegian (%)
Ancestries Reported - Polish (%)
Ancestries Reported - Portuguese (%)
Ancestries Reported - Russian (%)
Ancestries Reported - Scotch-Irish (%)
Ancestries Reported - Scottish (%)
Ancestries Reported - Slovak (%)
Ancestries Reported - Subsaharan African (%)
Ancestries Reported - Swedish (%)
Ancestries Reported - Swiss (%)
Ancestries Reported - Ukrainian (%)
Ancestries Reported - United States (%)
Ancestries Reported - Welsh (%)
Ancestries Reported - West Indian (%)
Ancestries Reported - Other (%)
Geographical mobility - Same house 1 year ago (%)
Geographical mobility - Same house 1 year ago (%) - White
Geographical mobility - Same house 1 year ago (%) - Black or African American
Geographical mobility - Same house 1 year ago (%) - Asian
Geographical mobility - Same house 1 year ago (%) - Hispanic or Latino
Geographical mobility - Same house 1 year ago (%) - American Indian and Alaska Native
Geographical mobility - Same house 1 year ago (%) - Multirace
Geographical mobility - Same house 1 year ago (%) - Other Race
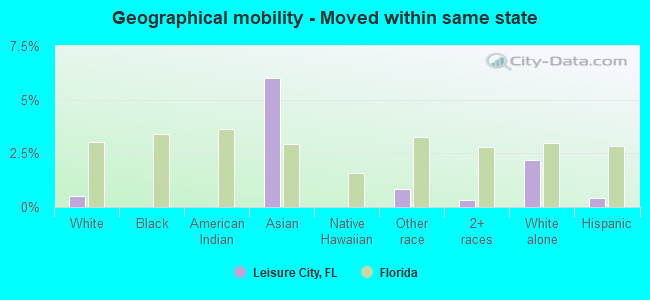
Geographical mobility - Moved within same county (%)
Geographical mobility - Moved within same county (%) - White
Geographical mobility - Moved within same county (%) - Black or African American
Geographical mobility - Moved within same county (%) - Asian
Geographical mobility - Moved within same county (%) - Hispanic or Latino
Geographical mobility - Moved within same county (%) - American Indian and Alaska Native
Geographical mobility - Moved within same county (%) - Multirace
Geographical mobility - Moved within same county (%) - Other Race
Geographical mobility - Moved from different county within same state (%)
Geographical mobility - Moved from different county within same state (%) - White
Geographical mobility - Moved from different county within same state (%) - Black or African American
Geographical mobility - Moved from different county within same state (%) - Asian
Geographical mobility - Moved from different county within same state (%) - Hispanic or Latino
Geographical mobility - Moved from different county within same state (%) - American Indian and Alaska Native
Geographical mobility - Moved from different county within same state (%) - Multirace
Geographical mobility - Moved from different county within same state (%) - Other Race
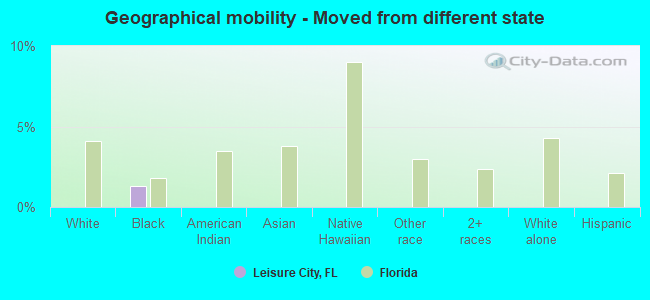
Geographical mobility - Moved from different state (%)
Geographical mobility - Moved from different state (%) - White
Geographical mobility - Moved from different state (%) - Black or African American
Geographical mobility - Moved from different state (%) - Asian
Geographical mobility - Moved from different state (%) - Hispanic or Latino
Geographical mobility - Moved from different state (%) - American Indian and Alaska Native
Geographical mobility - Moved from different state (%) - Multirace
Geographical mobility - Moved from different state (%) - Other Race
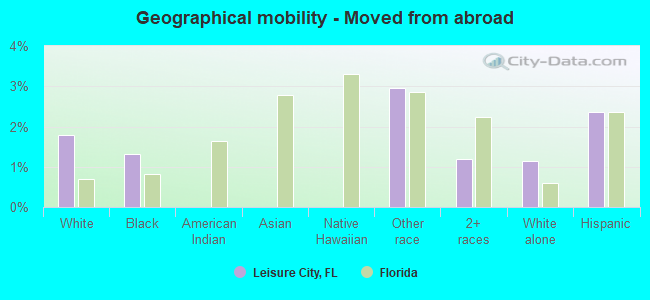
Geographical mobility - Moved from abroad (%)
Geographical mobility - Moved from abroad (%) - White
Geographical mobility - Moved from abroad (%) - Black or African American
Geographical mobility - Moved from abroad (%) - Asian
Geographical mobility - Moved from abroad (%) - Hispanic or Latino
Geographical mobility - Moved from abroad (%) - American Indian and Alaska Native
Geographical mobility - Moved from abroad (%) - Multirace
Geographical mobility - Moved from abroad (%) - Other Race
Place of birth for the foreign-born population - Ireland (%)
Place of birth for the foreign-born population - Denmark (%)
Place of birth for the foreign-born population - Norway (%)
Place of birth for the foreign-born population - Sweden (%)
Place of birth for the foreign-born population - United Kingdom (%)
Place of birth for the foreign-born population - England (%)
Place of birth for the foreign-born population - Scotland (%)
Place of birth for the foreign-born population - Other Northern Europe (%)
Place of birth for the foreign-born population - Austria (%)
Place of birth for the foreign-born population - Belgium (%)
Place of birth for the foreign-born population - France (%)
Place of birth for the foreign-born population - Germany (%)
Place of birth for the foreign-born population - Netherlands (%)
Place of birth for the foreign-born population - Switzerland (%)
Place of birth for the foreign-born population - Other Western Europe (%)
Place of birth for the foreign-born population - Greece (%)
Place of birth for the foreign-born population - Italy (%)
Place of birth for the foreign-born population - Portugal (%)
Place of birth for the foreign-born population - Spain (%)
Place of birth for the foreign-born population - Other Southern Europe (%)
Place of birth for the foreign-born population - Albania (%)
Place of birth for the foreign-born population - Belarus (%)
Place of birth for the foreign-born population - Bosnia and Herzegovina (%)
Place of birth for the foreign-born population - Bulgaria (%)
Place of birth for the foreign-born population - Croatia (%)
Place of birth for the foreign-born population - Czechoslovakia (%)
Place of birth for the foreign-born population - Hungary (%)
Place of birth for the foreign-born population - Latvia (%)
Place of birth for the foreign-born population - Lithuania (%)
Place of birth for the foreign-born population - North Macedonia (Macedonia) (%)
Place of birth for the foreign-born population - Moldova (%)
Place of birth for the foreign-born population - Poland (%)
Place of birth for the foreign-born population - Romania (%)
Place of birth for the foreign-born population - Russia (%)
Place of birth for the foreign-born population - Serbia (%)
Place of birth for the foreign-born population - Ukraine (%)
Place of birth for the foreign-born population - Other Eastern Europe (%)
Place of birth for the foreign-born population - China (%)
Place of birth for the foreign-born population - Hong Kong (%)
Place of birth for the foreign-born population - Taiwan (%)
Place of birth for the foreign-born population - Japan (%)
Place of birth for the foreign-born population - Korea (%)
Place of birth for the foreign-born population - Other Eastern Asia (%)
Place of birth for the foreign-born population - Afghanistan (%)
Place of birth for the foreign-born population - Bangladesh (%)
Place of birth for the foreign-born population - India (%)
Place of birth for the foreign-born population - Iran (%)
Place of birth for the foreign-born population - Kazakhstan (%)
Place of birth for the foreign-born population - Nepal (%)
Place of birth for the foreign-born population - Pakistan (%)
Place of birth for the foreign-born population - Sri Lanka (%)
Place of birth for the foreign-born population - Uzbekistan (%)
Place of birth for the foreign-born population - Other South Central Asia (%)
Place of birth for the foreign-born population - Burma (%)
Place of birth for the foreign-born population - Cambodia (%)
Place of birth for the foreign-born population - Indonesia (%)
Place of birth for the foreign-born population - Laos (%)
Place of birth for the foreign-born population - Malaysia (%)
Place of birth for the foreign-born population - Philippines (%)
Place of birth for the foreign-born population - Singapore (%)
Place of birth for the foreign-born population - Thailand (%)
Place of birth for the foreign-born population - Vietnam (%)
Place of birth for the foreign-born population - Other South Eastern Asia (%)
Place of birth for the foreign-born population - Armenia (%)
Place of birth for the foreign-born population - Iraq (%)
Place of birth for the foreign-born population - Israel (%)
Place of birth for the foreign-born population - Jordan (%)
Place of birth for the foreign-born population - Kuwait (%)
Place of birth for the foreign-born population - Lebanon (%)
Place of birth for the foreign-born population - Saudi Arabia (%)
Place of birth for the foreign-born population - Syria (%)
Place of birth for the foreign-born population - Turkey (%)
Place of birth for the foreign-born population - Yemen (%)
Place of birth for the foreign-born population - Other Western Asia (%)
Place of birth for the foreign-born population - Eritrea (%)
Place of birth for the foreign-born population - Ethiopia (%)
Place of birth for the foreign-born population - Kenya (%)
Place of birth for the foreign-born population - Somalia (%)
Place of birth for the foreign-born population - Uganda (%)
Place of birth for the foreign-born population - Zimbabwe (%)
Place of birth for the foreign-born population - Other Eastern Africa (%)
Place of birth for the foreign-born population - Cameroon (%)
Place of birth for the foreign-born population - Congo (%)
Place of birth for the foreign-born population - Democratic Republic of Congo (Zaire) (%)
Place of birth for the foreign-born population - Other Middle Africa (%)
Place of birth for the foreign-born population - Egypt (%)
Place of birth for the foreign-born population - Morocco (%)
Place of birth for the foreign-born population - Sudan (%)
Place of birth for the foreign-born population - Other Northern Africa (%)
Place of birth for the foreign-born population - South Africa (%)
Place of birth for the foreign-born population - Other Southern Africa (%)
Place of birth for the foreign-born population - Cabo Verde (%)
Place of birth for the foreign-born population - Ghana (%)
Place of birth for the foreign-born population - Liberia (%)
Place of birth for the foreign-born population - Nigeria (%)
Place of birth for the foreign-born population - Senegal (%)
Place of birth for the foreign-born population - Sierra Leone (%)
Place of birth for the foreign-born population - Other Western Africa (%)
Place of birth for the foreign-born population - Australia (%)
Place of birth for the foreign-born population - New Zealand (%)
Place of birth for the foreign-born population - Fiji (%)
Place of birth for the foreign-born population - Micronesia (%)
Place of birth for the foreign-born population - Bahamas (%)
Place of birth for the foreign-born population - Barbados (%)
Place of birth for the foreign-born population - Cuba (%)
Place of birth for the foreign-born population - Dominica (%)
Place of birth for the foreign-born population - Dominican Republic (%)
Place of birth for the foreign-born population - Grenada (%)
Place of birth for the foreign-born population - Haiti (%)
Place of birth for the foreign-born population - Jamaica (%)
Place of birth for the foreign-born population - St. Vincent and the Grenadines (%)
Place of birth for the foreign-born population - Trinidad and Tobago (%)
Place of birth for the foreign-born population - West Indies (%)
Place of birth for the foreign-born population - Other Caribbean (%)
Place of birth for the foreign-born population - Belize (%)
Place of birth for the foreign-born population - Costa Rica (%)
Place of birth for the foreign-born population - El Salvador (%)
Place of birth for the foreign-born population - Guatemala (%)
Place of birth for the foreign-born population - Honduras (%)
Place of birth for the foreign-born population - Mexico (%)
Place of birth for the foreign-born population - Nicaragua (%)
Place of birth for the foreign-born population - Panama (%)
Place of birth for the foreign-born population - Other Central America (%)
Place of birth for the foreign-born population - Argentina (%)
Place of birth for the foreign-born population - Bolivia (%)
Place of birth for the foreign-born population - Brazil (%)
Place of birth for the foreign-born population - Chile (%)
Place of birth for the foreign-born population - Colombia (%)
Place of birth for the foreign-born population - Ecuador (%)
Place of birth for the foreign-born population - Guyana (%)
Place of birth for the foreign-born population - Peru (%)
Place of birth for the foreign-born population - Uruguay (%)
Place of birth for the foreign-born population - Venezuela (%)
Place of birth for the foreign-born population - Other South America (%)
Place of birth for the foreign-born population - Canada (%)
Place of birth for the foreign-born population - Other Northern America (%)
Place of birth for the foreign-born population - Other (%)
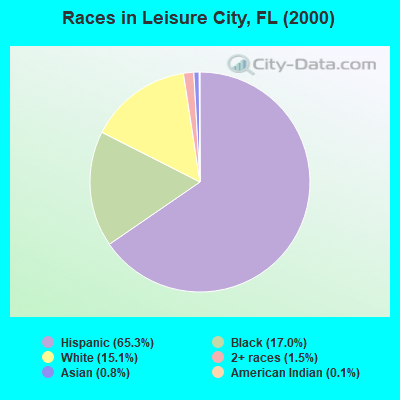
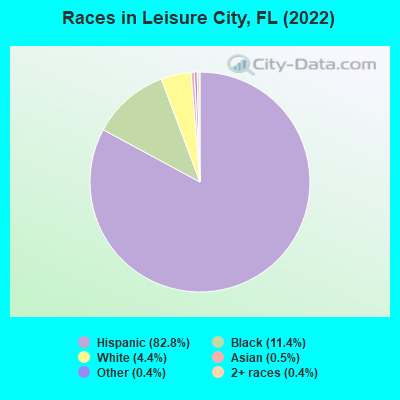
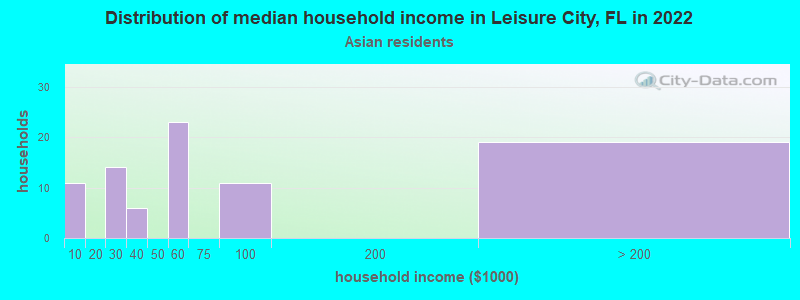
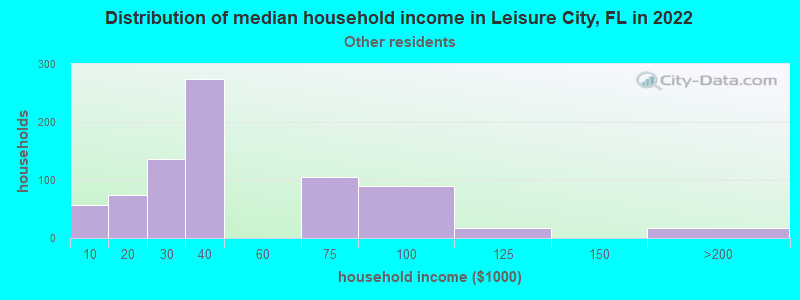
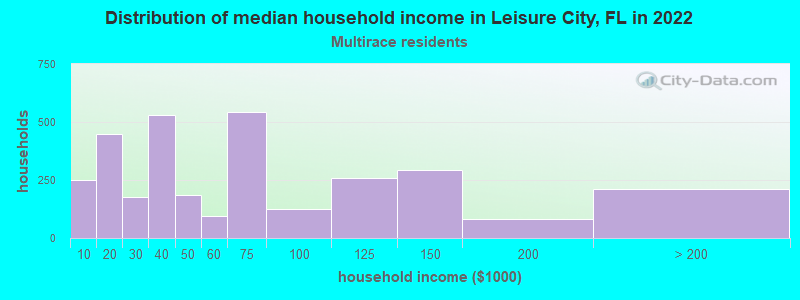
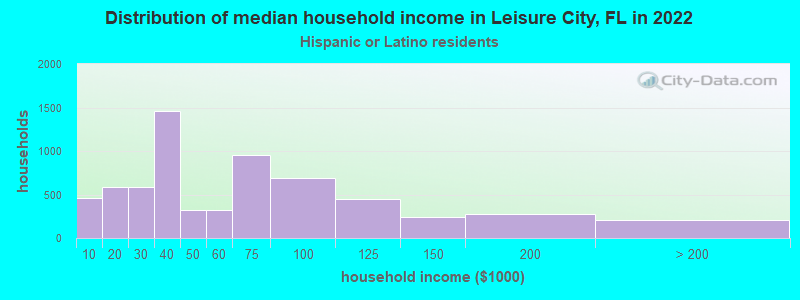
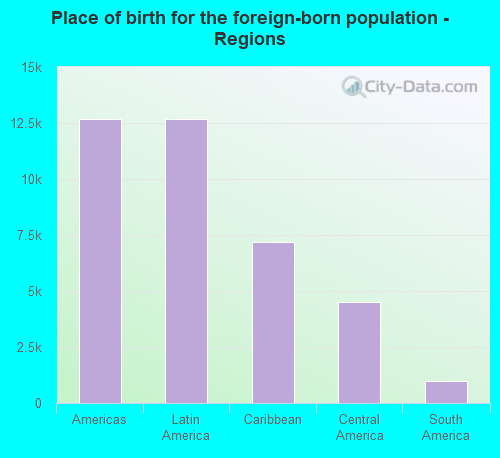
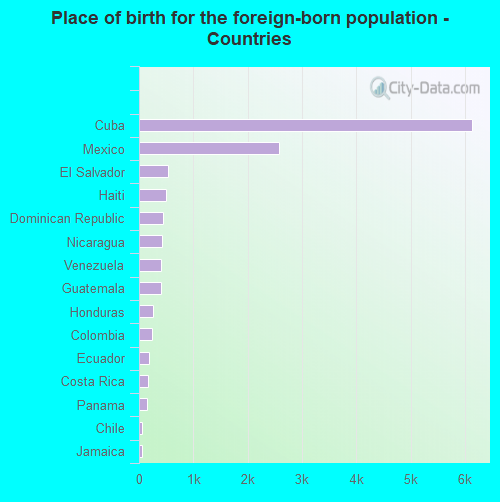
According to 2022 data, the most numerous races in Leisure City, FL are White alone (1,185 residents), Hispanic (22,272 residents), and Black alone (3,068 residents). 18.2% of Leisure City residents speak English at home. 47.5% of Leisure City, FL residents are foreign-born (46.9% born in Latin America), which is 55.8% greater than the foreign-born rate of 21.0% across the entire state of Florida.
Race distribution in Leisure City
2000 2022
10,458,509 65.4% White alone 2,682,715 16.8% Hispanic 2,264,268 14.2% Black alone 261,693 1.6% Asian alone 236,954 1.5% Two or more races 42,358 0.3% American Indian alone 28,994 0.2% Other race alone 6,887 0.04% Native Hawaiian and Other
11,309,403 50.8% White alone 6,025,039 27.1% Hispanic 3,241,015 14.6% Black alone 861,630 3.9% Two or more races 623,692 2.8% Asian alone 152,054 0.7% Other race alone 22,504 0.1% American Indian alone 9,486 0.04% Native Hawaiian and Other
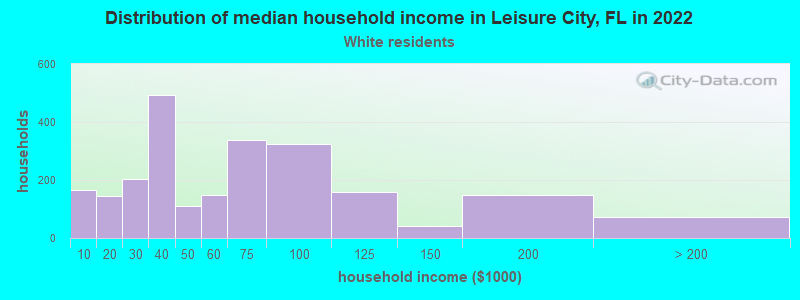
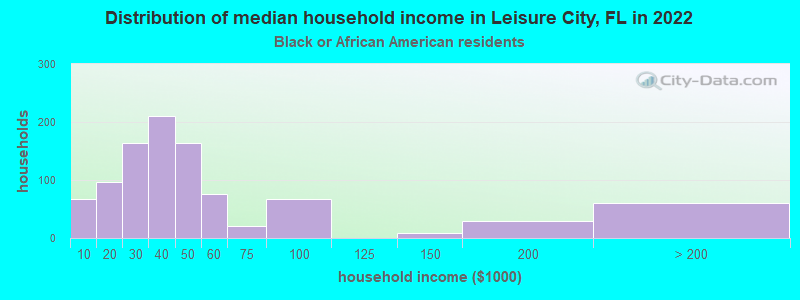
Income and house value in Leisure City Median household income in 2022 $57,292 White non-Hispanic householders$36,094 Black householders$61,753 Asian householders$36,130 Some other race householders$45,343 Two or more races householders$43,208 Hispanic or Latino race householdersMedian 2022 house value $327,726 White Non-Hispanic householders$349,042 Black or African American householders $394,782 Asian householders$359,700 Some other race householders$314,848 Two or more races householders$357,035 Hispanic or Latino householders
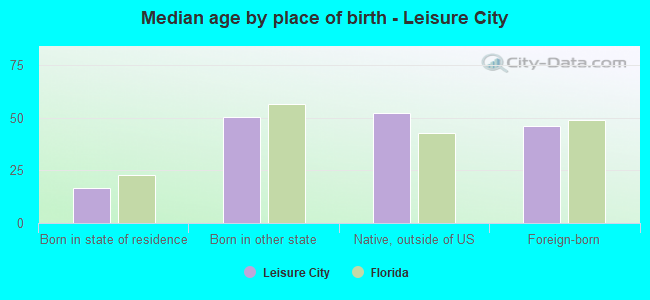
Median age by race in Leisure City
28.6 Median age for White residents26.8 29.4 28.7 Median age for Black or African American residents20.2 45.9 33.0 Median age for American Indian / Alaska Native residents27.8 38.4 26.6 Median age for Asian residents33.8 25.5 -679,849,340.2 Median age for Native Hawaiian / Pacific Islander residents-858,307,848.3 -443,298,968.6 31.1 Median age for Other race residents29.8 36.5 46.7 Median age for Two or more races residents49.6 43.3 37.8 Median age for White alone residents40.8 33.2 34.1 Median age for Hispanic or Latino residents33.1 35.9
Owner/renter occupied households by race in Leisure City
House owners and renters - White residents 1,327 53.3% Owner occupied1,163 46.7% Renter occupiedHouse owners and renters - Black or African American residents 320 33.3% Owner occupied643 66.7% Renter occupiedHouse owners and renters - American Indian / Alaska Native residents 5 39.5% Owner occupied7 60.5% Renter occupiedHouse owners and renters - Asian residents 53 59.1% Owner occupied37 40.9% Renter occupiedHouse owners and renters - Native Hawaiian / Pacific Islander residents 9 100.0% Renter occupiedHouse owners and renters - Other race residents 322 37.6% Owner occupied534 62.4% Renter occupiedHouse owners and renters - Two or more races residents 1,691 52.8% Owner occupied1,512 47.2% Renter occupiedHouse owners and renters - White alone residents 253 76.4% Owner occupied78 23.6% Renter occupiedHouse owners and renters - Hispanic or Latino residents 3,242 49.2% Owner occupied3,353 50.8% Renter occupied
Language usage in Leisure City
English speakers - Total 18.2% of residents of Leisure City speak English at home.
76.8% of residents speak Spanish at home 10,174 52.9% Speak English very well9,059 47.1% Speak English less than very well4.9% of residents speak other language at home 884 71.4% Speak English very well354 28.6% Speak English less than very well
English speakers - Born in the United States 50.7% of residents of Leisure City speak English at home.
47.8% of residents speak Spanish at home 900 90.8% Speak English very well91 9.2% Speak English less than very well0.6% of residents speak other language at home 13 100.0% Speak English very well
English speakers - Native, born elsewhere 3.1% of residents of Leisure City speak English at home.
92.3% of residents speak Spanish at home 783 62.0% Speak English very well479 38.0% Speak English less than very well0.4% of residents speak other language at home 6 100.0% Speak English less than very well
English speakers - Foreign-born 4.0% of residents of Leisure City speak English at home.
91.1% of residents speak Spanish at home 3,343 28.8% Speak English very well8,270 71.2% Speak English less than very well5.0% of residents speak other language at home 306 47.7% Speak English very well336 52.3% Speak English less than very well
White (Caucasian) - Speak only English Native:
29.4% (1,554)Foreign-born:
5.0% (141)
White (Caucasian) - Speak another language Native:
61.6% (3,259)Foreign-born:
93.3% (2,645)
Black or African American - Speak only English Native:
76.2% (1,810)Foreign-born:
10.0% (62)
Black or African American - Speak another language Native:
23.8% (565)Foreign-born:
88.0% (543)
Asian - Speak another language Native:
16.1% (26)Foreign-born:
100.0% (56)
Other race - Speak only English Native:
18.6% (178)Foreign-born:
3.7% (62)
Other race - Speak another language Native:
81.4% (780)Foreign-born:
96.4% (1,620)
Two or more races - Speak only English Native:
9.0% (261)Foreign-born:
4.5% (303)
Two or more races - Speak another language Native:
91.3% (2,657)Foreign-born:
95.5% (6,382)
White alone - Speak only English Native:
85.0% (969)Foreign-born:
100.0% (35)
Hispanic or Latino - Speak only English Native:
12.4% (1,066)Foreign-born:
3.3% (392)
Hispanic or Latino - Speak another language Native:
87.4% (7,490)Foreign-born:
96.7% (11,656)
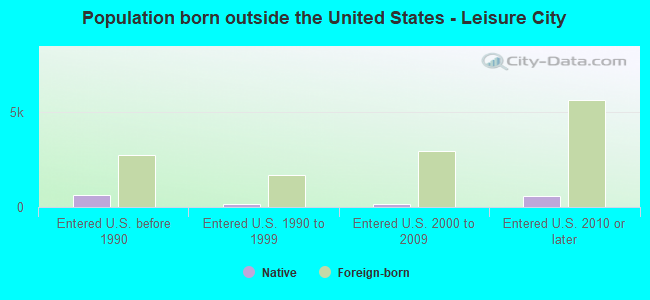
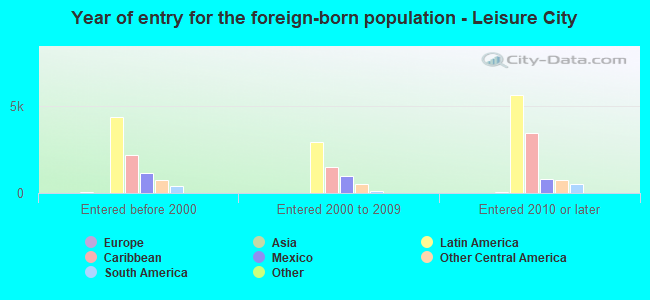
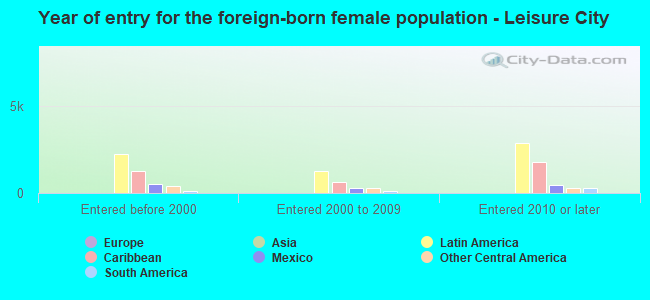
Foreign-born residents in Leisure City 12,781 residents are foreign born (46.9% Latin America ).
This city:
47.5%Florida:
21.1%
Marital status for residents in Leisure City Marital status - White (Caucasian) population 15 years and over
Males 54.2% Never married33.9% Now married3.3% Separated1.0% Widowed7.5% DivorcedFemales 47.1% Never married33.0% Now married2.5% Separated6.7% Widowed10.7% DivorcedWomen who gave birth in the past 12 months Now married:
77.9% (29)Unmarried:
22.1% (8)
Women who did not give birth in the past 12 months Now married:
28.5% (622)Unmarried:
71.5% (1,563)
Marital status - Black or African American population 15 years and over
Males 71.4% Never married19.5% Now married0.0% Separated6.4% Widowed2.7% DivorcedFemales 60.8% Never married19.2% Now married6.0% Separated4.4% Widowed9.6% DivorcedWomen who gave birth in the past 12 months Now married:
0.0% (0)Unmarried:
100.0% (27)
Women who did not give birth in the past 12 months Now married:
22.3% (179)Unmarried:
77.7% (624)
Marital status - American Indian / Alaska Native population 15 years and over
Males 50.0% Never married50.0% Now married0.0% Separated0.0% Widowed0.0% DivorcedFemales 55.6% Never married22.2% Now married0.0% Separated0.0% Widowed22.2% DivorcedWomen who did not give birth in the past 12 months Now married:
0.0% (0)Unmarried:
100.0% (16)
Marital status - Asian population 15 years and over
Males 73.3% Never married26.7% Now married0.0% Separated0.0% Widowed0.0% DivorcedFemales 73.0% Never married8.1% Now married0.0% Separated18.9% Widowed0.0% DivorcedWomen who did not give birth in the past 12 months Now married:
0.0% (0)Unmarried:
100.0% (56)
Marital status - Other race population 15 years and over
Males 58.2% Never married28.9% Now married6.5% Separated0.0% Widowed6.4% DivorcedFemales 56.3% Never married13.1% Now married2.7% Separated4.7% Widowed23.3% DivorcedWomen who gave birth in the past 12 months Now married:
0.0% (0)Unmarried:
100.0% (59)
Women who did not give birth in the past 12 months Now married:
23.6% (130)Unmarried:
76.4% (420)
Marital status - Two or more races population 15 years and over
Males 32.2% Never married56.6% Now married0.4% Separated1.0% Widowed9.8% DivorcedFemales 34.1% Never married48.1% Now married1.9% Separated6.6% Widowed9.4% DivorcedWomen who gave birth in the past 12 months Now married:
100.0% (37)Unmarried:
0.0% (0)
Women who did not give birth in the past 12 months Now married:
46.1% (1,030)Unmarried:
53.9% (1,204)
Marital status - White alone, not Hispanic / Latino population 15 years and over
Males 44.1% Never married28.6% Now married0.0% Separated2.2% Widowed25.1% DivorcedFemales 33.2% Never married39.8% Now married0.0% Separated10.2% Widowed16.8% DivorcedWomen who did not give birth in the past 12 months Now married:
42.5% (79)Unmarried:
57.5% (107)
Marital status - Hispanic or Latino population 15 years and over
Males 48.9% Never married40.4% Now married3.0% Separated0.9% Widowed6.8% DivorcedFemales 44.5% Never married35.3% Now married2.8% Separated6.0% Widowed11.4% DivorcedWomen who gave birth in the past 12 months Now married:
57.1% (74)Unmarried:
42.9% (55)
Women who did not give birth in the past 12 months Now married:
32.1% (1,747)Unmarried:
67.9% (3,695)
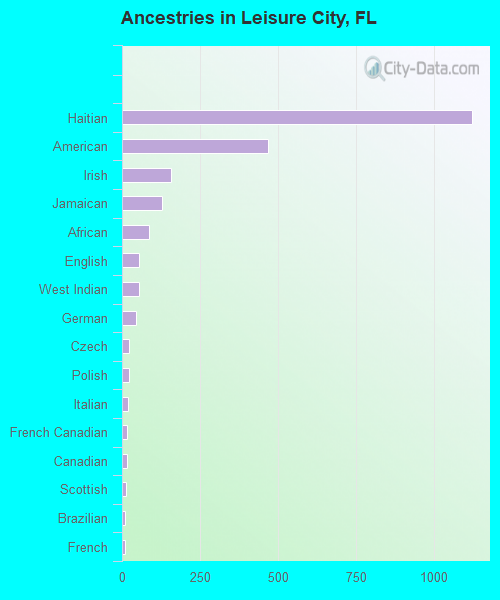
Ancestries in Leisure City
1,122 5.9% Haitian468 2.5% American156 0.8% Irish128 0.7% Jamaican87 0.5% African55 0.3% English54 0.3% West Indian45 0.2% German22 0.1% Czech22 0.1% Polish18 0.10% Italian16 0.08% French Canadian15 0.08% Canadian12 0.06% Scottish11 0.06% Brazilian11 0.06% French10 0.05% European3 0.02% Lebanese3 0.02% Turkish
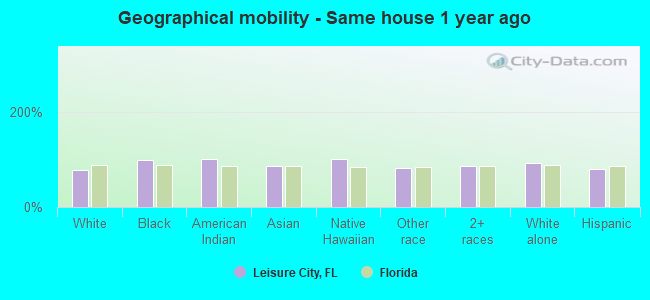
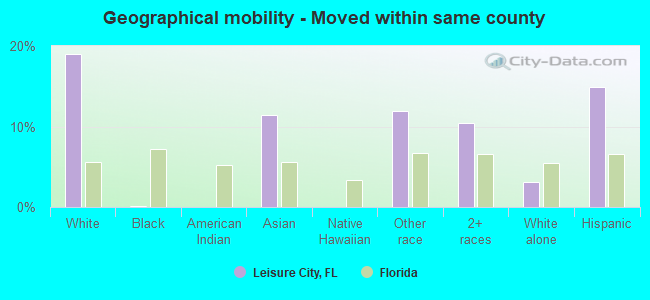
Geographical mobility in Leisure City Same house 1 year ago 6,561 76.6% White (Caucasian)3,043 99.2% Black or African American62 100.0% American Indian / Alaska Native177 85.7% Asian8 100.0% Native Hawaiian / Pacific Islander2,346 81.7% Other race8,769 86.5% Two or more races1,086 91.6% White alone, not Hispanic / Latino17,772 79.9% Hispanic or LatinoMoved within same county 1,631 19.0% White / Caucasian6 0.2% Black or African American24 11.5% Asian341 11.9% Other race1,057 10.4% Two or more races37 3.1% White alone, not Hispanic / Latino3,306 14.9% Hispanic or LatinoMoved within same state 43 0.5% White / Caucasian12 6.0% Asian24 0.8% Other race34 0.3% Two or more races26 2.2% White alone, not Hispanic / Latino94 0.4% Hispanic or LatinoMoved from different state 40 1.3% Black or African AmericanMoved from abroad 153 1.8% White41 1.3% Black or African American85 3.0% Other race121 1.2% Two or more races13 1.1% White alone, not Hispanic / Latino525 2.4% Hispanic or Latino
Children Nativity (place of birth) in Leisure City
Children under 6 years - Living with two parents Both parents native 51 100.0% NativeBoth parents foreign-born 318 94.0% Native20 6.0% Foreign-bornOne native, one foreign-born parent 126 100.0% NativeChildren under 6 years - Living with one parent Native parent 882 100.0% NativeForeign-born parent 463 100.0% NativeChildren 6 to 17 years - Living with two parents Both parents native 497 98.2% Native9 1.8% Foreign-bornBoth parents foreign-born 1,034 73.3% Native377 26.7% Foreign-bornOne native, one foreign-born parent 338 100.0% NativeChildren 6 to 17 years - Living with one parent Native parent 286 100.0% NativeForeign-born parent 2,107 60.2% Native1,392 39.8% Foreign-born
Grandparents responsible for own grandchildren in Leisure City
Grandparents (30 to 59 years) White / Caucasian 19 23.6% Responsible for grandchildren63 76.4% Not responsible for grandchildrenBlack or African American 49 100.0% Responsible for grandchildrenAmerican Indian / Alaska Native 13 100.0% Not responsible for grandchildrenOther race 31 100.0% Not responsible for grandchildrenTwo or more races 243 53.6% Responsible for grandchildren210 46.4% Not responsible for grandchildrenHispanic or Latino 162 40.4% Responsible for grandchildren238 59.6% Not responsible for grandchildrenGrandparents (60 years and over) White / Caucasian 21 9.1% Responsible for grandchildren215 90.9% Not responsible for grandchildrenBlack or African American 29 65.6% Responsible for grandchildren15 34.4% Not responsible for grandchildrenAmerican Indian / Alaska Native 6 100.0% Not responsible for grandchildrenOther race 77 100.0% Not responsible for grandchildrenTwo or more races 23 6.5% Responsible for grandchildren327 93.5% Not responsible for grandchildrenHispanic or Latino 60 9.8% Responsible for grandchildren553 90.2% Not responsible for grandchildren