Races in Leesburg, Florida (FL) Detailed Stats
Data:
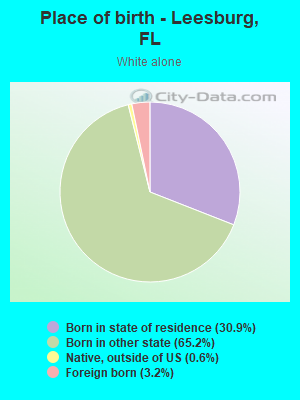
Races - White alone (%)
Races - White alone (% change since 2000)
Races - Black alone (%)
Races - Black alone (% change since 2000)
Races - American Indian alone (%)
Races - American Indian alone (% change since 2000)
Races - Asian alone (%)
Races - Asian alone (% change since 2000)
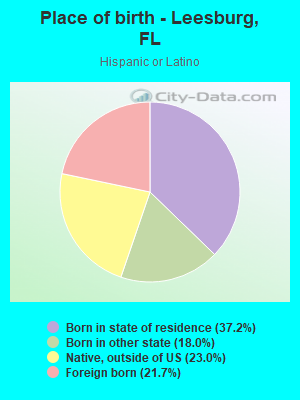
Races - Hispanic (%)
Races - Hispanic (% change since 2000)
Races - Native Hawaiian and Other Pacific Islander alone (%)
Races - Native Hawaiian and Other Pacific Islander alone (% change since 2000)
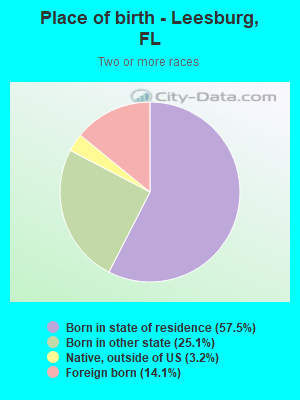
Races - Two or more races(%)
Races - Two or more races(% change since 2000)
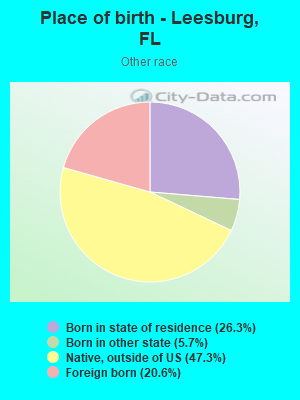
Races - Other race alone (%)
Races - Other race alone (% change since 2000)
Racial diversity
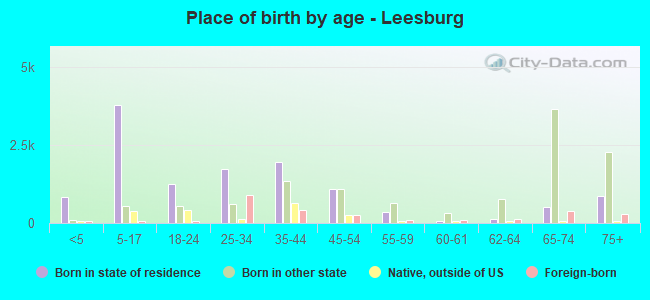
Place of birth - Born in state of residence (%)
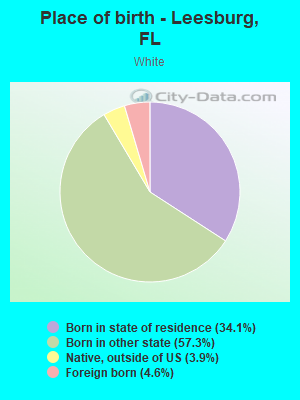
Place of birth - Born in state of residence (%) - White
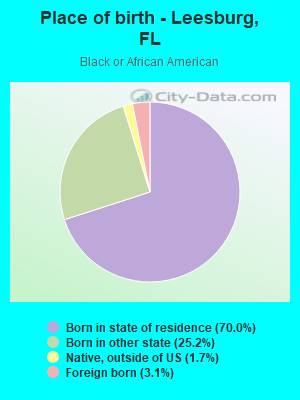
Place of birth - Born in state of residence (%) - Black or African American
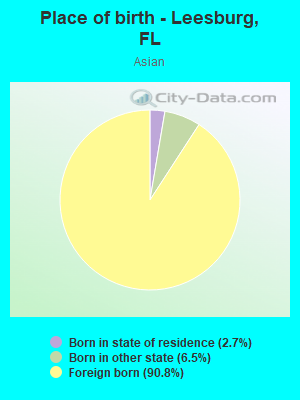
Place of birth - Born in state of residence (%) - Asian
Place of birth - Born in state of residence (%) - Hispanic or Latino
Place of birth - Born in state of residence (%) - American Indian and Alaska Native
Place of birth - Born in state of residence (%) - Multirace
Place of birth - Born in state of residence (%) - Other Race
Place of birth - Born in other state (%)
Place of birth - Born in other state (%) - White
Place of birth - Born in other state (%) - Black or African American
Place of birth - Born in other state (%) - Asian
Place of birth - Born in other state (%) - Hispanic or Latino
Place of birth - Born in other state (%) - American Indian and Alaska Native
Place of birth - Born in other state (%) - Multirace
Place of birth - Born in other state (%) - Other Race
Place of birth - Native, outside of US (%)
Place of birth - Native, outside of US (%) - White
Place of birth - Native, outside of US (%) - Black or African American
Place of birth - Native, outside of US (%) - Asian
Place of birth - Native, outside of US (%) - Hispanic or Latino
Place of birth - Native, outside of US (%) - American Indian and Alaska Native
Place of birth - Native, outside of US (%) - Multirace
Place of birth - Native, outside of US (%) - Other Race
Place of birth - Foreign born (%)
Place of birth - Foreign born (%) - White
Place of birth - Foreign born (%) - Black or African American
Place of birth - Foreign born (%) - Asian
Place of birth - Foreign born (%) - Hispanic or Latino
Place of birth - Foreign born (%) - American Indian and Alaska Native
Place of birth - Foreign born (%) - Multirace
Place of birth - Foreign born (%) - Other Race
Residents speaking English at home (%)
Residents speaking English at home - Born in the United States (%)
Residents speaking English at home - Native, born elsewhere (%)
Residents speaking English at home - Foreign born (%)
Residents speaking Spanish at home (%)
Residents speaking Spanish at home - Born in the United States (%)
Residents speaking Spanish at home - Native, born elsewhere (%)
Residents speaking Spanish at home - Foreign born (%)
Residents speaking other language at home (%)
Residents speaking other language at home - Born in the United States (%)
Residents speaking other language at home - Native, born elsewhere (%)
Residents speaking other language at home - Foreign born (%)
Marital status - Never married (%)
Marital status - Now married (%)
Marital status - Separated (%)
Marital status - Widowed (%)
Marital status - Divorced (%)
Ancestries Reported - Arab (%)
Ancestries Reported - Czech (%)
Ancestries Reported - Danish (%)
Ancestries Reported - Dutch (%)
Ancestries Reported - English (%)
Ancestries Reported - French (%)
Ancestries Reported - French Canadian (%)
Ancestries Reported - German (%)
Ancestries Reported - Greek (%)
Ancestries Reported - Hungarian (%)
Ancestries Reported - Irish (%)
Ancestries Reported - Italian (%)
Ancestries Reported - Lithuanian (%)
Ancestries Reported - Norwegian (%)
Ancestries Reported - Polish (%)
Ancestries Reported - Portuguese (%)
Ancestries Reported - Russian (%)
Ancestries Reported - Scotch-Irish (%)
Ancestries Reported - Scottish (%)
Ancestries Reported - Slovak (%)
Ancestries Reported - Subsaharan African (%)
Ancestries Reported - Swedish (%)
Ancestries Reported - Swiss (%)
Ancestries Reported - Ukrainian (%)
Ancestries Reported - United States (%)
Ancestries Reported - Welsh (%)
Ancestries Reported - West Indian (%)
Ancestries Reported - Other (%)
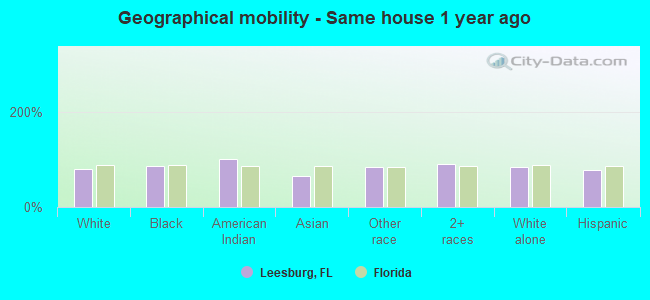
Geographical mobility - Same house 1 year ago (%)
Geographical mobility - Same house 1 year ago (%) - White
Geographical mobility - Same house 1 year ago (%) - Black or African American
Geographical mobility - Same house 1 year ago (%) - Asian
Geographical mobility - Same house 1 year ago (%) - Hispanic or Latino
Geographical mobility - Same house 1 year ago (%) - American Indian and Alaska Native
Geographical mobility - Same house 1 year ago (%) - Multirace
Geographical mobility - Same house 1 year ago (%) - Other Race
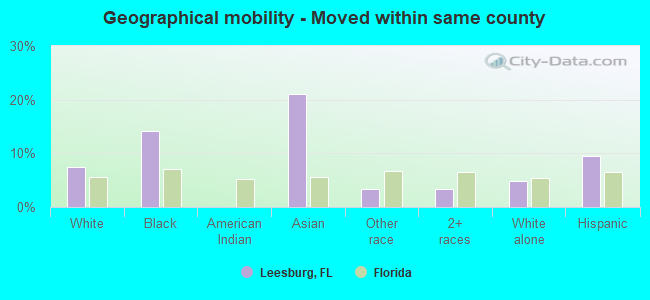
Geographical mobility - Moved within same county (%)
Geographical mobility - Moved within same county (%) - White
Geographical mobility - Moved within same county (%) - Black or African American
Geographical mobility - Moved within same county (%) - Asian
Geographical mobility - Moved within same county (%) - Hispanic or Latino
Geographical mobility - Moved within same county (%) - American Indian and Alaska Native
Geographical mobility - Moved within same county (%) - Multirace
Geographical mobility - Moved within same county (%) - Other Race
Geographical mobility - Moved from different county within same state (%)
Geographical mobility - Moved from different county within same state (%) - White
Geographical mobility - Moved from different county within same state (%) - Black or African American
Geographical mobility - Moved from different county within same state (%) - Asian
Geographical mobility - Moved from different county within same state (%) - Hispanic or Latino
Geographical mobility - Moved from different county within same state (%) - American Indian and Alaska Native
Geographical mobility - Moved from different county within same state (%) - Multirace
Geographical mobility - Moved from different county within same state (%) - Other Race
Geographical mobility - Moved from different state (%)
Geographical mobility - Moved from different state (%) - White
Geographical mobility - Moved from different state (%) - Black or African American
Geographical mobility - Moved from different state (%) - Asian
Geographical mobility - Moved from different state (%) - Hispanic or Latino
Geographical mobility - Moved from different state (%) - American Indian and Alaska Native
Geographical mobility - Moved from different state (%) - Multirace
Geographical mobility - Moved from different state (%) - Other Race
Geographical mobility - Moved from abroad (%)
Geographical mobility - Moved from abroad (%) - White
Geographical mobility - Moved from abroad (%) - Black or African American
Geographical mobility - Moved from abroad (%) - Asian
Geographical mobility - Moved from abroad (%) - Hispanic or Latino
Geographical mobility - Moved from abroad (%) - American Indian and Alaska Native
Geographical mobility - Moved from abroad (%) - Multirace
Geographical mobility - Moved from abroad (%) - Other Race
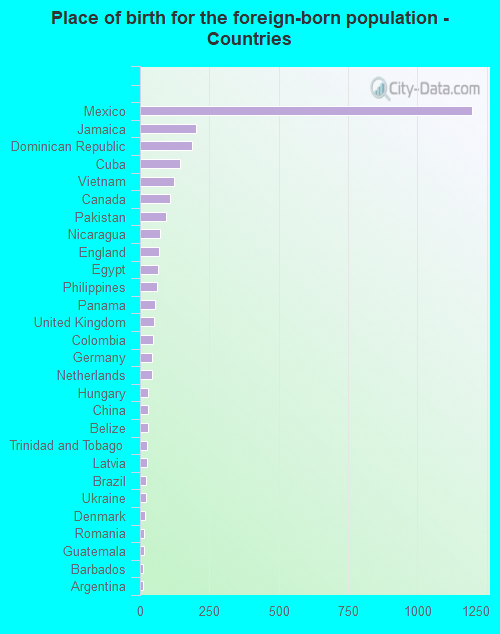
Place of birth for the foreign-born population - Ireland (%)
Place of birth for the foreign-born population - Denmark (%)
Place of birth for the foreign-born population - Norway (%)
Place of birth for the foreign-born population - Sweden (%)
Place of birth for the foreign-born population - United Kingdom (%)
Place of birth for the foreign-born population - England (%)
Place of birth for the foreign-born population - Scotland (%)
Place of birth for the foreign-born population - Other Northern Europe (%)
Place of birth for the foreign-born population - Austria (%)
Place of birth for the foreign-born population - Belgium (%)
Place of birth for the foreign-born population - France (%)
Place of birth for the foreign-born population - Germany (%)
Place of birth for the foreign-born population - Netherlands (%)
Place of birth for the foreign-born population - Switzerland (%)
Place of birth for the foreign-born population - Other Western Europe (%)
Place of birth for the foreign-born population - Greece (%)
Place of birth for the foreign-born population - Italy (%)
Place of birth for the foreign-born population - Portugal (%)
Place of birth for the foreign-born population - Spain (%)
Place of birth for the foreign-born population - Other Southern Europe (%)
Place of birth for the foreign-born population - Albania (%)
Place of birth for the foreign-born population - Belarus (%)
Place of birth for the foreign-born population - Bosnia and Herzegovina (%)
Place of birth for the foreign-born population - Bulgaria (%)
Place of birth for the foreign-born population - Croatia (%)
Place of birth for the foreign-born population - Czechoslovakia (%)
Place of birth for the foreign-born population - Hungary (%)
Place of birth for the foreign-born population - Latvia (%)
Place of birth for the foreign-born population - Lithuania (%)
Place of birth for the foreign-born population - North Macedonia (Macedonia) (%)
Place of birth for the foreign-born population - Moldova (%)
Place of birth for the foreign-born population - Poland (%)
Place of birth for the foreign-born population - Romania (%)
Place of birth for the foreign-born population - Russia (%)
Place of birth for the foreign-born population - Serbia (%)
Place of birth for the foreign-born population - Ukraine (%)
Place of birth for the foreign-born population - Other Eastern Europe (%)
Place of birth for the foreign-born population - China (%)
Place of birth for the foreign-born population - Hong Kong (%)
Place of birth for the foreign-born population - Taiwan (%)
Place of birth for the foreign-born population - Japan (%)
Place of birth for the foreign-born population - Korea (%)
Place of birth for the foreign-born population - Other Eastern Asia (%)
Place of birth for the foreign-born population - Afghanistan (%)
Place of birth for the foreign-born population - Bangladesh (%)
Place of birth for the foreign-born population - India (%)
Place of birth for the foreign-born population - Iran (%)
Place of birth for the foreign-born population - Kazakhstan (%)
Place of birth for the foreign-born population - Nepal (%)
Place of birth for the foreign-born population - Pakistan (%)
Place of birth for the foreign-born population - Sri Lanka (%)
Place of birth for the foreign-born population - Uzbekistan (%)
Place of birth for the foreign-born population - Other South Central Asia (%)
Place of birth for the foreign-born population - Burma (%)
Place of birth for the foreign-born population - Cambodia (%)
Place of birth for the foreign-born population - Indonesia (%)
Place of birth for the foreign-born population - Laos (%)
Place of birth for the foreign-born population - Malaysia (%)
Place of birth for the foreign-born population - Philippines (%)
Place of birth for the foreign-born population - Singapore (%)
Place of birth for the foreign-born population - Thailand (%)
Place of birth for the foreign-born population - Vietnam (%)
Place of birth for the foreign-born population - Other South Eastern Asia (%)
Place of birth for the foreign-born population - Armenia (%)
Place of birth for the foreign-born population - Iraq (%)
Place of birth for the foreign-born population - Israel (%)
Place of birth for the foreign-born population - Jordan (%)
Place of birth for the foreign-born population - Kuwait (%)
Place of birth for the foreign-born population - Lebanon (%)
Place of birth for the foreign-born population - Saudi Arabia (%)
Place of birth for the foreign-born population - Syria (%)
Place of birth for the foreign-born population - Turkey (%)
Place of birth for the foreign-born population - Yemen (%)
Place of birth for the foreign-born population - Other Western Asia (%)
Place of birth for the foreign-born population - Eritrea (%)
Place of birth for the foreign-born population - Ethiopia (%)
Place of birth for the foreign-born population - Kenya (%)
Place of birth for the foreign-born population - Somalia (%)
Place of birth for the foreign-born population - Uganda (%)
Place of birth for the foreign-born population - Zimbabwe (%)
Place of birth for the foreign-born population - Other Eastern Africa (%)
Place of birth for the foreign-born population - Cameroon (%)
Place of birth for the foreign-born population - Congo (%)
Place of birth for the foreign-born population - Democratic Republic of Congo (Zaire) (%)
Place of birth for the foreign-born population - Other Middle Africa (%)
Place of birth for the foreign-born population - Egypt (%)
Place of birth for the foreign-born population - Morocco (%)
Place of birth for the foreign-born population - Sudan (%)
Place of birth for the foreign-born population - Other Northern Africa (%)
Place of birth for the foreign-born population - South Africa (%)
Place of birth for the foreign-born population - Other Southern Africa (%)
Place of birth for the foreign-born population - Cabo Verde (%)
Place of birth for the foreign-born population - Ghana (%)
Place of birth for the foreign-born population - Liberia (%)
Place of birth for the foreign-born population - Nigeria (%)
Place of birth for the foreign-born population - Senegal (%)
Place of birth for the foreign-born population - Sierra Leone (%)
Place of birth for the foreign-born population - Other Western Africa (%)
Place of birth for the foreign-born population - Australia (%)
Place of birth for the foreign-born population - New Zealand (%)
Place of birth for the foreign-born population - Fiji (%)
Place of birth for the foreign-born population - Micronesia (%)
Place of birth for the foreign-born population - Bahamas (%)
Place of birth for the foreign-born population - Barbados (%)
Place of birth for the foreign-born population - Cuba (%)
Place of birth for the foreign-born population - Dominica (%)
Place of birth for the foreign-born population - Dominican Republic (%)
Place of birth for the foreign-born population - Grenada (%)
Place of birth for the foreign-born population - Haiti (%)
Place of birth for the foreign-born population - Jamaica (%)
Place of birth for the foreign-born population - St. Vincent and the Grenadines (%)
Place of birth for the foreign-born population - Trinidad and Tobago (%)
Place of birth for the foreign-born population - West Indies (%)
Place of birth for the foreign-born population - Other Caribbean (%)
Place of birth for the foreign-born population - Belize (%)
Place of birth for the foreign-born population - Costa Rica (%)
Place of birth for the foreign-born population - El Salvador (%)
Place of birth for the foreign-born population - Guatemala (%)
Place of birth for the foreign-born population - Honduras (%)
Place of birth for the foreign-born population - Mexico (%)
Place of birth for the foreign-born population - Nicaragua (%)
Place of birth for the foreign-born population - Panama (%)
Place of birth for the foreign-born population - Other Central America (%)
Place of birth for the foreign-born population - Argentina (%)
Place of birth for the foreign-born population - Bolivia (%)
Place of birth for the foreign-born population - Brazil (%)
Place of birth for the foreign-born population - Chile (%)
Place of birth for the foreign-born population - Colombia (%)
Place of birth for the foreign-born population - Ecuador (%)
Place of birth for the foreign-born population - Guyana (%)
Place of birth for the foreign-born population - Peru (%)
Place of birth for the foreign-born population - Uruguay (%)
Place of birth for the foreign-born population - Venezuela (%)
Place of birth for the foreign-born population - Other South America (%)
Place of birth for the foreign-born population - Canada (%)
Place of birth for the foreign-born population - Other Northern America (%)
Place of birth for the foreign-born population - Other (%)
Latest news about races in Leesburg, FL collected exclusively by city-data.com from local newspapers, TV, and radio stations
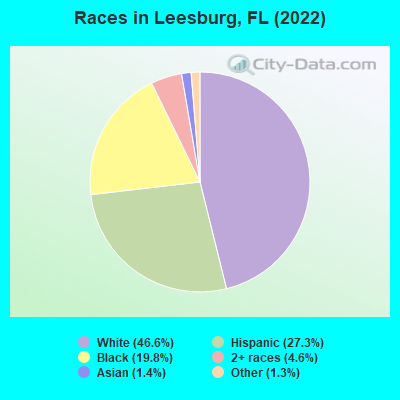
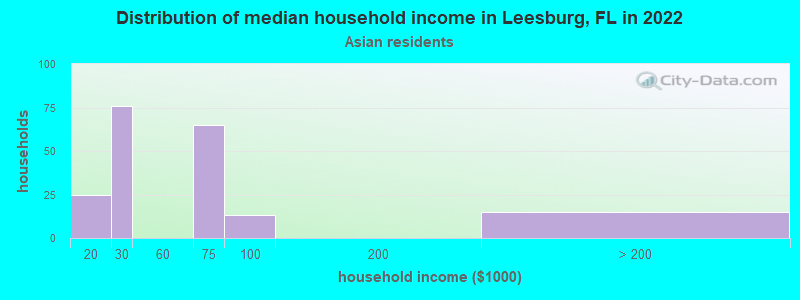
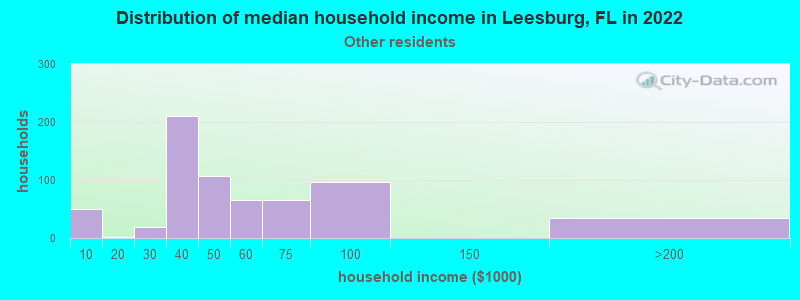
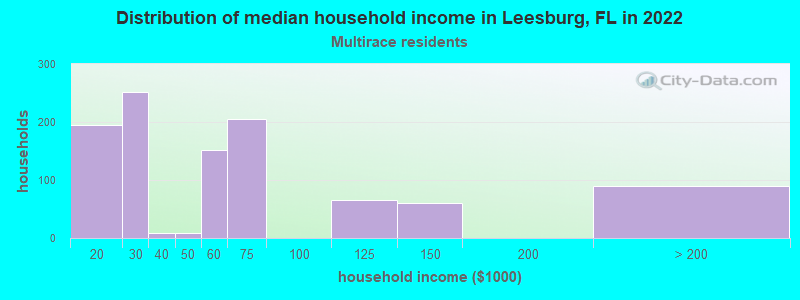
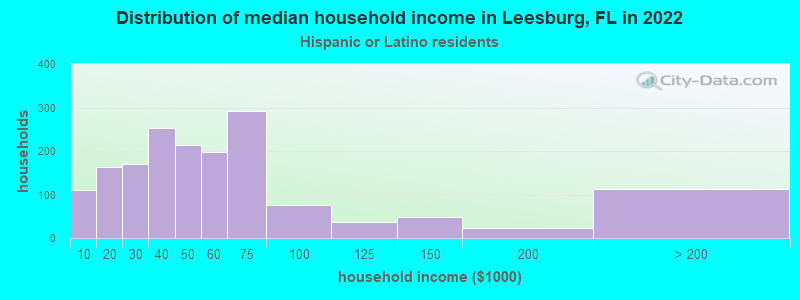
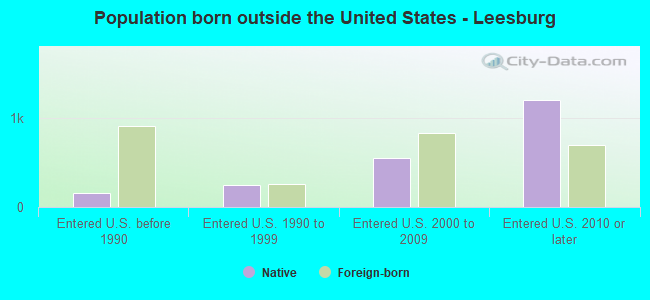
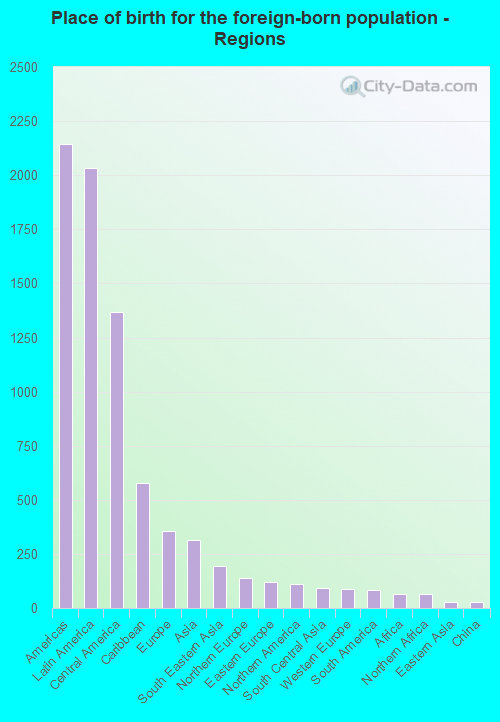
According to 2022 data, the most numerous races in Leesburg, FL are White alone (13,459 residents), Hispanic (7,894 residents), and Black alone (5,705 residents). 80.1% of Leesburg residents speak English at home. 10.0% of Leesburg, FL residents are foreign-born (7.1% born in Latin America, 1.2% born in Europe, 1.1% born in Asia), which is 110.6% less than the foreign-born rate of 21.0% across the entire state of Florida.
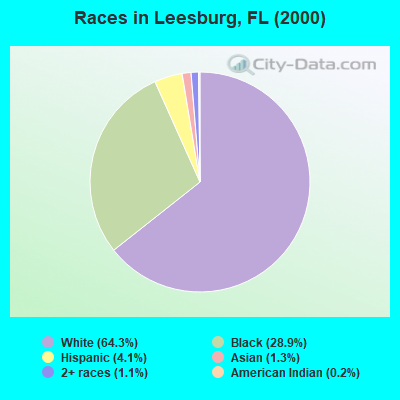
Race distribution in Leesburg
2000 2022
10,458,509 65.4% White alone 2,682,715 16.8% Hispanic 2,264,268 14.2% Black alone 261,693 1.6% Asian alone 236,954 1.5% Two or more races 42,358 0.3% American Indian alone 28,994 0.2% Other race alone 6,887 0.04% Native Hawaiian and Other
11,309,403 50.8% White alone 6,025,039 27.1% Hispanic 3,241,015 14.6% Black alone 861,630 3.9% Two or more races 623,692 2.8% Asian alone 152,054 0.7% Other race alone 22,504 0.1% American Indian alone 9,486 0.04% Native Hawaiian and Other
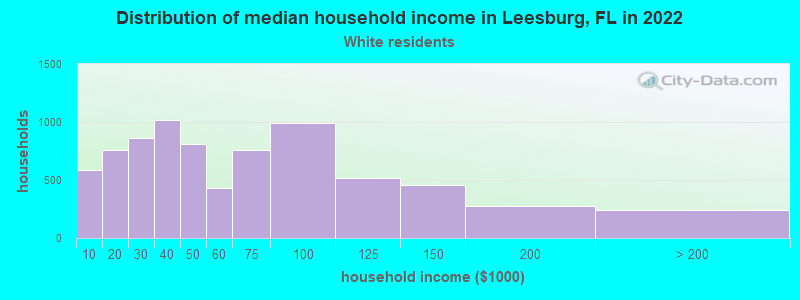
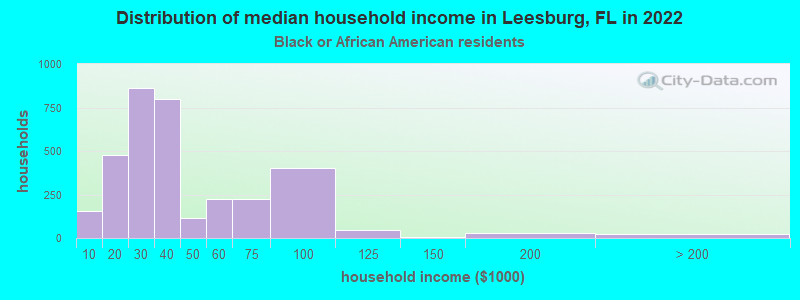
Income and house value in Leesburg Median household income in 2022 $51,200 White non-Hispanic householders$32,282 Black householders$45,124 Some other race householders$55,520 Two or more races householders$48,075 Hispanic or Latino race householdersMedian 2022 house value $260,691 White Non-Hispanic householders$172,968 Black or African American householders$229,917 American Indian or Alaska Native householders $194,545 Asian householders$35,368 Some other race householders$216,122 Two or more races householders$244,066 Hispanic or Latino householders
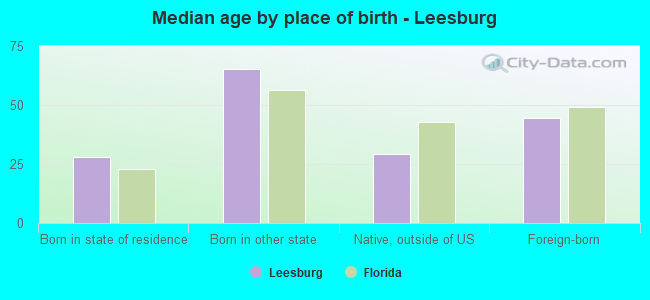
Median age by race in Leesburg
52.1 Median age for White residents49.8 55.3 41.5 Median age for Black or African American residents38.2 41.5 -654,353,561.4 Median age for American Indian / Alaska Native residents-665,012,406.3 -591,194,968.0 68.7 Median age for Asian residents71.1 63.3 -679,849,340.2 Median age for Native Hawaiian / Pacific Islander residents-858,307,848.3 -443,298,968.6 29.7 Median age for Other race residents21.6 34.3 32.6 Median age for Two or more races residents34.5 37.4 62.9 Median age for White alone residents59.6 64.6 26.5 Median age for Hispanic or Latino residents26.5 26.1
Owner/renter occupied households by race in Leesburg
House owners and renters - White residents 5,001 65.3% Owner occupied2,660 34.7% Renter occupiedHouse owners and renters - Black or African American residents 1,273 41.8% Owner occupied1,773 58.2% Renter occupiedHouse owners and renters - Asian residents 123 58.3% Owner occupied87 41.7% Renter occupiedHouse owners and renters - Other race residents 78 8.5% Owner occupied842 91.5% Renter occupiedHouse owners and renters - Two or more races residents 327 32.6% Owner occupied675 67.4% Renter occupiedHouse owners and renters - White alone residents 4,916 70.0% Owner occupied2,110 30.0% Renter occupiedHouse owners and renters - Hispanic or Latino residents 394 19.4% Owner occupied1,641 80.6% Renter occupied
Language usage in Leesburg
English speakers - Total 80.1% of residents of Leesburg speak English at home.
17.9% of residents speak Spanish at home 2,599 52.2% Speak English very well2,382 47.8% Speak English less than very well2.2% of residents speak other language at home 293 46.9% Speak English very well332 53.1% Speak English less than very well
English speakers - Born in the United States 92.7% of residents of Leesburg speak English at home.
6.7% of residents speak Spanish at home 717 90.8% Speak English very well73 9.2% Speak English less than very well0.7% of residents speak other language at home 79 100.0% Speak English very well
English speakers - Native, born elsewhere 20.2% of residents of Leesburg speak English at home.
77.6% of residents speak Spanish at home 617 40.8% Speak English very well895 59.2% Speak English less than very well
English speakers - Foreign-born 22.2% of residents of Leesburg speak English at home.
60.3% of residents speak Spanish at home 311 19.1% Speak English very well1,315 80.9% Speak English less than very well19.7% of residents speak other language at home 203 38.2% Speak English very well328 61.8% Speak English less than very well
White (Caucasian) - Speak only English Native:
93.3% (14,107)Foreign-born:
42.6% (312)
White (Caucasian) - Speak another language Native:
6.5% (980)Foreign-born:
81.7% (598)
Black or African American - Speak only English Native:
100.0% (5,424)Foreign-born:
77.6% (143)
Black or African American - Speak another language Native:
0.2% (11)Foreign-born:
22.1% (41)
Asian - Speak only English Native:
72.4% (29)Foreign-born:
26.6% (108)
Asian - Speak another language Native:
27.1% (11)Foreign-born:
73.9% (301)
Other race - Speak only English Native:
20.6% (307)Foreign-born:
7.2% (32)
Other race - Speak another language Native:
76.1% (1,131)Foreign-born:
87.4% (388)
Two or more races - Speak only English Native:
59.8% (2,188)Foreign-born:
1.4% (9)
Two or more races - Speak another language Native:
40.0% (1,464)Foreign-born:
100.0% (664)
White alone - Speak only English Native:
98.5% (12,647)Foreign-born:
82.4% (358)
White alone - Speak another language Native:
1.4% (183)Foreign-born:
21.5% (93)
Hispanic or Latino - Speak only English Native:
43.9% (2,549)Foreign-born:
2.4% (41)
Hispanic or Latino - Speak another language Native:
55.4% (3,216)Foreign-born:
100.0% (1,714)
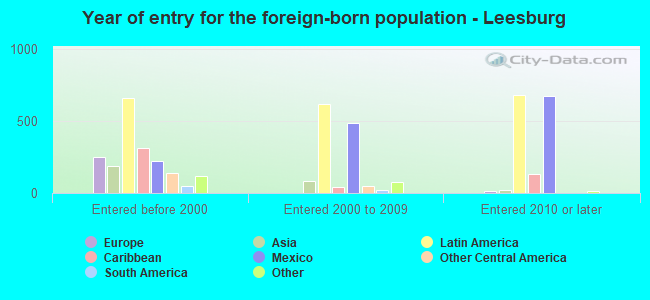
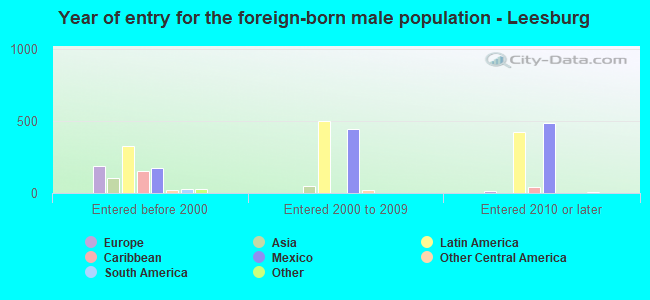
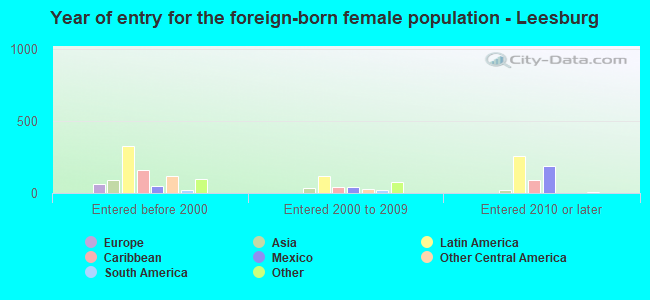
Foreign-born residents in Leesburg 2,879 residents are foreign born (7.1% Latin America , 1.2% Europe , 1.1% Asia ).
This city:
10.0%Florida:
21.1%
Marital status for residents in Leesburg Marital status - White (Caucasian) population 15 years and over
Males 31.4% Never married51.4% Now married1.7% Separated5.2% Widowed10.3% DivorcedFemales 24.0% Never married44.6% Now married1.3% Separated15.4% Widowed14.7% DivorcedWomen who gave birth in the past 12 months Now married:
49.5% (47)Unmarried:
50.5% (48)
Women who did not give birth in the past 12 months Now married:
33.5% (1,015)Unmarried:
66.5% (2,012)
Marital status - Black or African American population 15 years and over
Males 51.5% Never married36.4% Now married3.5% Separated5.1% Widowed3.5% DivorcedFemales 41.3% Never married32.0% Now married10.9% Separated8.8% Widowed6.9% DivorcedWomen who gave birth in the past 12 months Now married:
0.0% (0)Unmarried:
100.0% (34)
Women who did not give birth in the past 12 months Now married:
36.1% (448)Unmarried:
63.9% (793)
Marital status - Asian population 15 years and over
Males 6.6% Never married84.0% Now married0.0% Separated0.0% Widowed9.4% DivorcedFemales 11.6% Never married61.0% Now married0.0% Separated11.6% Widowed15.7% DivorcedWomen who did not give birth in the past 12 months Now married:
50.0% (30)Unmarried:
50.0% (30)
Marital status - Other race population 15 years and over
Males 47.1% Never married45.3% Now married0.0% Separated0.0% Widowed7.6% DivorcedFemales 38.5% Never married41.5% Now married0.2% Separated0.0% Widowed19.9% DivorcedWomen who gave birth in the past 12 months Now married:
100.0% (48)Unmarried:
0.0% (0)
Women who did not give birth in the past 12 months Now married:
26.8% (235)Unmarried:
73.2% (642)
Marital status - Two or more races population 15 years and over
Males 43.6% Never married37.7% Now married0.0% Separated0.0% Widowed18.8% DivorcedFemales 33.3% Never married53.0% Now married6.6% Separated1.7% Widowed5.4% DivorcedWomen who gave birth in the past 12 months Now married:
100.0% (21)Unmarried:
0.0% (0)
Women who did not give birth in the past 12 months Now married:
57.9% (468)Unmarried:
42.1% (341)
Marital status - White alone, not Hispanic / Latino population 15 years and over
Males 25.4% Never married56.2% Now married2.0% Separated5.3% Widowed11.0% DivorcedFemales 15.6% Never married47.7% Now married1.5% Separated18.2% Widowed17.1% DivorcedWomen who gave birth in the past 12 months Now married:
49.5% (51)Unmarried:
50.5% (52)
Women who did not give birth in the past 12 months Now married:
38.8% (803)Unmarried:
61.2% (1,266)
Marital status - Hispanic or Latino population 15 years and over
Males 51.3% Never married32.8% Now married0.0% Separated1.9% Widowed14.0% DivorcedFemales 51.7% Never married40.9% Now married0.0% Separated1.3% Widowed6.1% DivorcedWomen who gave birth in the past 12 months Now married:
100.0% (24)Unmarried:
0.0% (0)
Women who did not give birth in the past 12 months Now married:
35.0% (795)Unmarried:
65.0% (1,474)
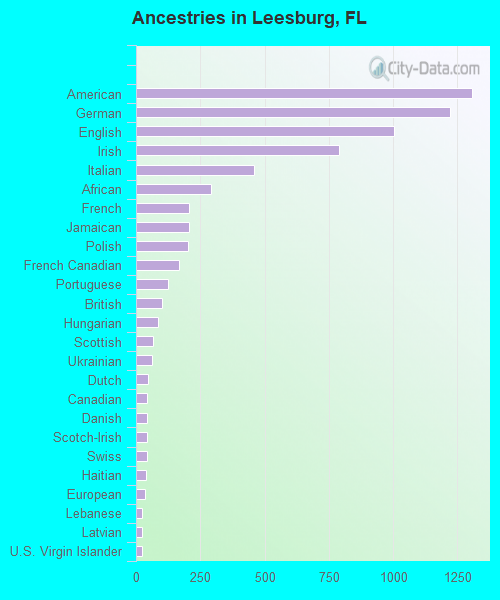
Ancestries in Leesburg
1,308 8.8% American1,221 8.2% German1,004 6.8% English790 5.3% Irish458 3.1% Italian292 2.0% African207 1.4% French205 1.4% Jamaican202 1.4% Polish168 1.1% French Canadian123 0.8% Portuguese102 0.7% British84 0.6% Hungarian68 0.5% Scottish63 0.4% Ukrainian45 0.3% Dutch43 0.3% Canadian42 0.3% Danish42 0.3% Scotch-Irish41 0.3% Swiss37 0.2% Haitian35 0.2% European25 0.2% Lebanese23 0.2% Latvian22 0.1% U.S. Virgin Islander19 0.1% Lithuanian17 0.1% Northern European17 0.1% Romanian17 0.1% Russian17 0.1% Trinidadian and Tobagonian16 0.1% Welsh15 0.1% Egyptian15 0.1% Swedish14 0.09% Pennsylvania German13 0.09% Turkish12 0.08% Slovak9 0.06% Finnish6 0.04% Slavic
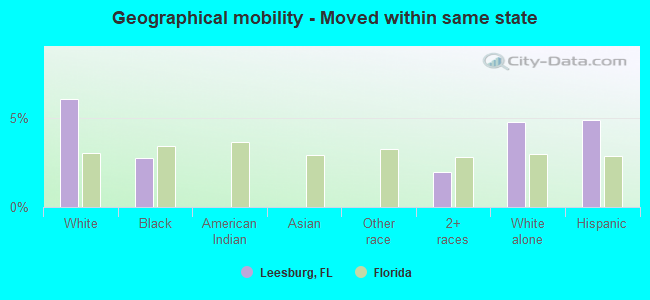
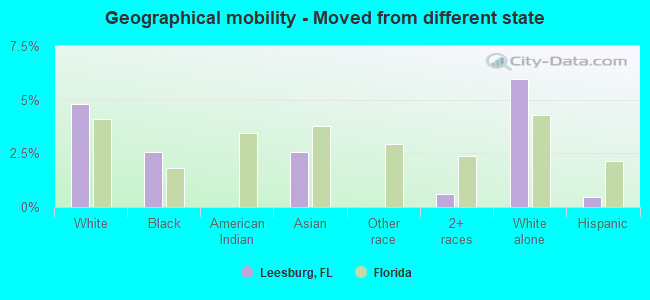
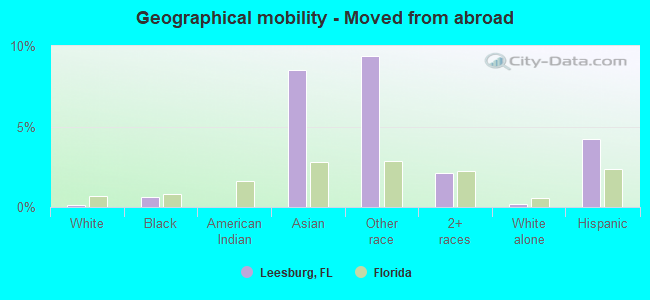
Geographical mobility in Leesburg Same house 1 year ago 12,961 79.2% White (Caucasian)4,824 84.5% Black or African American22 100.0% American Indian / Alaska Native242 65.4% Asian1,785 82.8% Other race4,101 90.3% Two or more races11,175 83.5% White alone, not Hispanic / Latino6,100 77.1% Hispanic or LatinoMoved within same county 1,219 7.4% White / Caucasian805 14.1% Black or African American78 21.0% Asian73 3.4% Other race154 3.4% Two or more races649 4.9% White alone, not Hispanic / Latino755 9.5% Hispanic or LatinoMoved within same state 986 6.0% White / Caucasian155 2.7% Black or African American90 2.0% Two or more races636 4.8% White alone, not Hispanic / Latino383 4.8% Hispanic or LatinoMoved from different state 781 4.8% White / Caucasian147 2.6% Black or African American9 2.5% Asian27 0.6% Two or more races795 5.9% White alone, not Hispanic / Latino36 0.5% Hispanic or LatinoMoved from abroad 23 0.1% White34 0.6% Black or African American31 8.5% Asian203 9.4% Other race96 2.1% Two or more races27 0.2% White alone, not Hispanic / Latino336 4.2% Hispanic or Latino
Children Nativity (place of birth) in Leesburg
Children under 6 years - Living with two parents Both parents native 532 100.0% NativeBoth parents foreign-born 98 100.0% NativeOne native, one foreign-born parent 100 100.0% NativeChildren under 6 years - Living with one parent Native parent 740 100.0% NativeForeign-born parent 53 100.0% NativeChildren 6 to 17 years - Living with two parents Both parents native 1,985 100.0% NativeBoth parents foreign-born 75 100.0% NativeOne native, one foreign-born parent 25 100.0% NativeChildren 6 to 17 years - Living with one parent Native parent 1,910 100.0% NativeForeign-born parent 105 46.1% Native123 53.9% Foreign-born
Grandparents responsible for own grandchildren in Leesburg
Grandparents (30 to 59 years) White / Caucasian 62 45.9% Responsible for grandchildren73 54.1% Not responsible for grandchildrenBlack or African American 4 31.1% Responsible for grandchildren10 68.9% Not responsible for grandchildrenWhite alone, not Hispanic / Latino 67 60.7% Responsible for grandchildren44 39.3% Not responsible for grandchildrenHispanic or Latino 27 100.0% Not responsible for grandchildren
Grandparents (60 years and over) White / Caucasian 50 100.0% Not responsible for grandchildrenBlack or African American 21 100.0% Not responsible for grandchildrenWhite alone, not Hispanic / Latino 52 100.0% Not responsible for grandchildrenHispanic or Latino 39 100.0% Not responsible for grandchildren