Races in Lebanon, Oregon (OR) Detailed Stats Ancestries, Foreign-born residents, place of birth
Data:
Races - White alone (%)
Races - White alone (% change since 2000)
Races - Black alone (%)
Races - Black alone (% change since 2000)
Races - American Indian alone (%)
Races - American Indian alone (% change since 2000)
Races - Asian alone (%)
Races - Asian alone (% change since 2000)
Races - Hispanic (%)
Races - Hispanic (% change since 2000)
Races - Native Hawaiian and Other Pacific Islander alone (%)
Races - Native Hawaiian and Other Pacific Islander alone (% change since 2000)
Races - Two or more races(%)
Races - Two or more races(% change since 2000)
Races - Other race alone (%)
Races - Other race alone (% change since 2000)
Racial diversity
Place of birth - Born in state of residence (%)
Place of birth - Born in state of residence (%) - White
Place of birth - Born in state of residence (%) - Black or African American
Place of birth - Born in state of residence (%) - Asian
Place of birth - Born in state of residence (%) - Hispanic or Latino
Place of birth - Born in state of residence (%) - American Indian and Alaska Native
Place of birth - Born in state of residence (%) - Multirace
Place of birth - Born in state of residence (%) - Other Race
Place of birth - Born in other state (%)
Place of birth - Born in other state (%) - White
Place of birth - Born in other state (%) - Black or African American
Place of birth - Born in other state (%) - Asian
Place of birth - Born in other state (%) - Hispanic or Latino
Place of birth - Born in other state (%) - American Indian and Alaska Native
Place of birth - Born in other state (%) - Multirace
Place of birth - Born in other state (%) - Other Race
Place of birth - Native, outside of US (%)
Place of birth - Native, outside of US (%) - White
Place of birth - Native, outside of US (%) - Black or African American
Place of birth - Native, outside of US (%) - Asian
Place of birth - Native, outside of US (%) - Hispanic or Latino
Place of birth - Native, outside of US (%) - American Indian and Alaska Native
Place of birth - Native, outside of US (%) - Multirace
Place of birth - Native, outside of US (%) - Other Race
Place of birth - Foreign born (%)
Place of birth - Foreign born (%) - White
Place of birth - Foreign born (%) - Black or African American
Place of birth - Foreign born (%) - Asian
Place of birth - Foreign born (%) - Hispanic or Latino
Place of birth - Foreign born (%) - American Indian and Alaska Native
Place of birth - Foreign born (%) - Multirace
Place of birth - Foreign born (%) - Other Race
Residents speaking English at home (%)
Residents speaking English at home - Born in the United States (%)
Residents speaking English at home - Native, born elsewhere (%)
Residents speaking English at home - Foreign born (%)
Residents speaking Spanish at home (%)
Residents speaking Spanish at home - Born in the United States (%)
Residents speaking Spanish at home - Native, born elsewhere (%)
Residents speaking Spanish at home - Foreign born (%)
Residents speaking other language at home (%)
Residents speaking other language at home - Born in the United States (%)
Residents speaking other language at home - Native, born elsewhere (%)
Residents speaking other language at home - Foreign born (%)
Marital status - Never married (%)
Marital status - Now married (%)
Marital status - Separated (%)
Marital status - Widowed (%)
Marital status - Divorced (%)
Ancestries Reported - Arab (%)
Ancestries Reported - Czech (%)
Ancestries Reported - Danish (%)
Ancestries Reported - Dutch (%)
Ancestries Reported - English (%)
Ancestries Reported - French (%)
Ancestries Reported - French Canadian (%)
Ancestries Reported - German (%)
Ancestries Reported - Greek (%)
Ancestries Reported - Hungarian (%)
Ancestries Reported - Irish (%)
Ancestries Reported - Italian (%)
Ancestries Reported - Lithuanian (%)
Ancestries Reported - Norwegian (%)
Ancestries Reported - Polish (%)
Ancestries Reported - Portuguese (%)
Ancestries Reported - Russian (%)
Ancestries Reported - Scotch-Irish (%)
Ancestries Reported - Scottish (%)
Ancestries Reported - Slovak (%)
Ancestries Reported - Subsaharan African (%)
Ancestries Reported - Swedish (%)
Ancestries Reported - Swiss (%)
Ancestries Reported - Ukrainian (%)
Ancestries Reported - United States (%)
Ancestries Reported - Welsh (%)
Ancestries Reported - West Indian (%)
Ancestries Reported - Other (%)
Geographical mobility - Same house 1 year ago (%)
Geographical mobility - Same house 1 year ago (%) - White
Geographical mobility - Same house 1 year ago (%) - Black or African American
Geographical mobility - Same house 1 year ago (%) - Asian
Geographical mobility - Same house 1 year ago (%) - Hispanic or Latino
Geographical mobility - Same house 1 year ago (%) - American Indian and Alaska Native
Geographical mobility - Same house 1 year ago (%) - Multirace
Geographical mobility - Same house 1 year ago (%) - Other Race
Geographical mobility - Moved within same county (%)
Geographical mobility - Moved within same county (%) - White
Geographical mobility - Moved within same county (%) - Black or African American
Geographical mobility - Moved within same county (%) - Asian
Geographical mobility - Moved within same county (%) - Hispanic or Latino
Geographical mobility - Moved within same county (%) - American Indian and Alaska Native
Geographical mobility - Moved within same county (%) - Multirace
Geographical mobility - Moved within same county (%) - Other Race
Geographical mobility - Moved from different county within same state (%)
Geographical mobility - Moved from different county within same state (%) - White
Geographical mobility - Moved from different county within same state (%) - Black or African American
Geographical mobility - Moved from different county within same state (%) - Asian
Geographical mobility - Moved from different county within same state (%) - Hispanic or Latino
Geographical mobility - Moved from different county within same state (%) - American Indian and Alaska Native
Geographical mobility - Moved from different county within same state (%) - Multirace
Geographical mobility - Moved from different county within same state (%) - Other Race
Geographical mobility - Moved from different state (%)
Geographical mobility - Moved from different state (%) - White
Geographical mobility - Moved from different state (%) - Black or African American
Geographical mobility - Moved from different state (%) - Asian
Geographical mobility - Moved from different state (%) - Hispanic or Latino
Geographical mobility - Moved from different state (%) - American Indian and Alaska Native
Geographical mobility - Moved from different state (%) - Multirace
Geographical mobility - Moved from different state (%) - Other Race
Geographical mobility - Moved from abroad (%)
Geographical mobility - Moved from abroad (%) - White
Geographical mobility - Moved from abroad (%) - Black or African American
Geographical mobility - Moved from abroad (%) - Asian
Geographical mobility - Moved from abroad (%) - Hispanic or Latino
Geographical mobility - Moved from abroad (%) - American Indian and Alaska Native
Geographical mobility - Moved from abroad (%) - Multirace
Geographical mobility - Moved from abroad (%) - Other Race
Place of birth for the foreign-born population - Ireland (%)
Place of birth for the foreign-born population - Denmark (%)
Place of birth for the foreign-born population - Norway (%)
Place of birth for the foreign-born population - Sweden (%)
Place of birth for the foreign-born population - United Kingdom (%)
Place of birth for the foreign-born population - England (%)
Place of birth for the foreign-born population - Scotland (%)
Place of birth for the foreign-born population - Other Northern Europe (%)
Place of birth for the foreign-born population - Austria (%)
Place of birth for the foreign-born population - Belgium (%)
Place of birth for the foreign-born population - France (%)
Place of birth for the foreign-born population - Germany (%)
Place of birth for the foreign-born population - Netherlands (%)
Place of birth for the foreign-born population - Switzerland (%)
Place of birth for the foreign-born population - Other Western Europe (%)
Place of birth for the foreign-born population - Greece (%)
Place of birth for the foreign-born population - Italy (%)
Place of birth for the foreign-born population - Portugal (%)
Place of birth for the foreign-born population - Spain (%)
Place of birth for the foreign-born population - Other Southern Europe (%)
Place of birth for the foreign-born population - Albania (%)
Place of birth for the foreign-born population - Belarus (%)
Place of birth for the foreign-born population - Bosnia and Herzegovina (%)
Place of birth for the foreign-born population - Bulgaria (%)
Place of birth for the foreign-born population - Croatia (%)
Place of birth for the foreign-born population - Czechoslovakia (%)
Place of birth for the foreign-born population - Hungary (%)
Place of birth for the foreign-born population - Latvia (%)
Place of birth for the foreign-born population - Lithuania (%)
Place of birth for the foreign-born population - North Macedonia (Macedonia) (%)
Place of birth for the foreign-born population - Moldova (%)
Place of birth for the foreign-born population - Poland (%)
Place of birth for the foreign-born population - Romania (%)
Place of birth for the foreign-born population - Russia (%)
Place of birth for the foreign-born population - Serbia (%)
Place of birth for the foreign-born population - Ukraine (%)
Place of birth for the foreign-born population - Other Eastern Europe (%)
Place of birth for the foreign-born population - China (%)
Place of birth for the foreign-born population - Hong Kong (%)
Place of birth for the foreign-born population - Taiwan (%)
Place of birth for the foreign-born population - Japan (%)
Place of birth for the foreign-born population - Korea (%)
Place of birth for the foreign-born population - Other Eastern Asia (%)
Place of birth for the foreign-born population - Afghanistan (%)
Place of birth for the foreign-born population - Bangladesh (%)
Place of birth for the foreign-born population - India (%)
Place of birth for the foreign-born population - Iran (%)
Place of birth for the foreign-born population - Kazakhstan (%)
Place of birth for the foreign-born population - Nepal (%)
Place of birth for the foreign-born population - Pakistan (%)
Place of birth for the foreign-born population - Sri Lanka (%)
Place of birth for the foreign-born population - Uzbekistan (%)
Place of birth for the foreign-born population - Other South Central Asia (%)
Place of birth for the foreign-born population - Burma (%)
Place of birth for the foreign-born population - Cambodia (%)
Place of birth for the foreign-born population - Indonesia (%)
Place of birth for the foreign-born population - Laos (%)
Place of birth for the foreign-born population - Malaysia (%)
Place of birth for the foreign-born population - Philippines (%)
Place of birth for the foreign-born population - Singapore (%)
Place of birth for the foreign-born population - Thailand (%)
Place of birth for the foreign-born population - Vietnam (%)
Place of birth for the foreign-born population - Other South Eastern Asia (%)
Place of birth for the foreign-born population - Armenia (%)
Place of birth for the foreign-born population - Iraq (%)
Place of birth for the foreign-born population - Israel (%)
Place of birth for the foreign-born population - Jordan (%)
Place of birth for the foreign-born population - Kuwait (%)
Place of birth for the foreign-born population - Lebanon (%)
Place of birth for the foreign-born population - Saudi Arabia (%)
Place of birth for the foreign-born population - Syria (%)
Place of birth for the foreign-born population - Turkey (%)
Place of birth for the foreign-born population - Yemen (%)
Place of birth for the foreign-born population - Other Western Asia (%)
Place of birth for the foreign-born population - Eritrea (%)
Place of birth for the foreign-born population - Ethiopia (%)
Place of birth for the foreign-born population - Kenya (%)
Place of birth for the foreign-born population - Somalia (%)
Place of birth for the foreign-born population - Uganda (%)
Place of birth for the foreign-born population - Zimbabwe (%)
Place of birth for the foreign-born population - Other Eastern Africa (%)
Place of birth for the foreign-born population - Cameroon (%)
Place of birth for the foreign-born population - Congo (%)
Place of birth for the foreign-born population - Democratic Republic of Congo (Zaire) (%)
Place of birth for the foreign-born population - Other Middle Africa (%)
Place of birth for the foreign-born population - Egypt (%)
Place of birth for the foreign-born population - Morocco (%)
Place of birth for the foreign-born population - Sudan (%)
Place of birth for the foreign-born population - Other Northern Africa (%)
Place of birth for the foreign-born population - South Africa (%)
Place of birth for the foreign-born population - Other Southern Africa (%)
Place of birth for the foreign-born population - Cabo Verde (%)
Place of birth for the foreign-born population - Ghana (%)
Place of birth for the foreign-born population - Liberia (%)
Place of birth for the foreign-born population - Nigeria (%)
Place of birth for the foreign-born population - Senegal (%)
Place of birth for the foreign-born population - Sierra Leone (%)
Place of birth for the foreign-born population - Other Western Africa (%)
Place of birth for the foreign-born population - Australia (%)
Place of birth for the foreign-born population - New Zealand (%)
Place of birth for the foreign-born population - Fiji (%)
Place of birth for the foreign-born population - Micronesia (%)
Place of birth for the foreign-born population - Bahamas (%)
Place of birth for the foreign-born population - Barbados (%)
Place of birth for the foreign-born population - Cuba (%)
Place of birth for the foreign-born population - Dominica (%)
Place of birth for the foreign-born population - Dominican Republic (%)
Place of birth for the foreign-born population - Grenada (%)
Place of birth for the foreign-born population - Haiti (%)
Place of birth for the foreign-born population - Jamaica (%)
Place of birth for the foreign-born population - St. Vincent and the Grenadines (%)
Place of birth for the foreign-born population - Trinidad and Tobago (%)
Place of birth for the foreign-born population - West Indies (%)
Place of birth for the foreign-born population - Other Caribbean (%)
Place of birth for the foreign-born population - Belize (%)
Place of birth for the foreign-born population - Costa Rica (%)
Place of birth for the foreign-born population - El Salvador (%)
Place of birth for the foreign-born population - Guatemala (%)
Place of birth for the foreign-born population - Honduras (%)
Place of birth for the foreign-born population - Mexico (%)
Place of birth for the foreign-born population - Nicaragua (%)
Place of birth for the foreign-born population - Panama (%)
Place of birth for the foreign-born population - Other Central America (%)
Place of birth for the foreign-born population - Argentina (%)
Place of birth for the foreign-born population - Bolivia (%)
Place of birth for the foreign-born population - Brazil (%)
Place of birth for the foreign-born population - Chile (%)
Place of birth for the foreign-born population - Colombia (%)
Place of birth for the foreign-born population - Ecuador (%)
Place of birth for the foreign-born population - Guyana (%)
Place of birth for the foreign-born population - Peru (%)
Place of birth for the foreign-born population - Uruguay (%)
Place of birth for the foreign-born population - Venezuela (%)
Place of birth for the foreign-born population - Other South America (%)
Place of birth for the foreign-born population - Canada (%)
Place of birth for the foreign-born population - Other Northern America (%)
Place of birth for the foreign-born population - Other (%)
Latest news about races in Lebanon, OR collected exclusively by city-data.com from local newspapers, TV, and radio stations
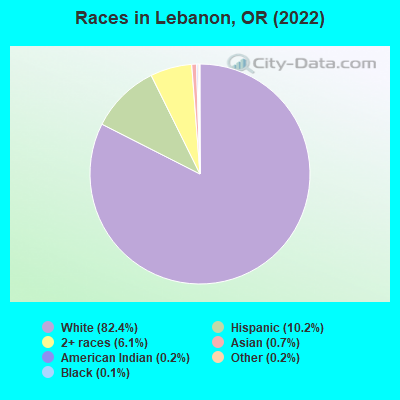
According to 2022 data, the most numerous races in Lebanon, OR are White alone (15,532 residents), Hispanic (1,931 residents), and Two or more races (1,153 residents). 90.4% of Lebanon residents speak English at home. 5.5% of Lebanon, OR residents are foreign-born (3.6% born in Latin America, 0.8% born in North America), which is 64.9% less than the foreign-born rate of 9.0% across the entire state of Oregon.
Race distribution in Lebanon
2000
2022
2,857,616 83.5% White alone
275,314 8.0% Hispanic
100,333 2.9% Asian alone
82,733 2.4% Two or more races
53,325 1.6% Black alone
40,130 1.2% American Indian alone
7,398 0.2% Native Hawaiian and Other Pacific Islander alone
4,550 0.1% Other race alone
3,037,571 71.6% White alone
609,538 14.4% Hispanic
252,744 6.0% Two or more races
191,283 4.5% Asian alone
78,228 1.8% Black alone
29,399 0.7% American Indian alone
25,731 0.6% Other race alone
15,643 0.4% Native Hawaiian and Other Pacific Islander alone
Income and house value in Lebanon Median household income in 2022 $55,500 White non-Hispanic householders
$104,376 Asian householders
$34,934 Two or more races householders
$43,992 Hispanic or Latino race householders
Median 2022 house value $317,729 White Non-Hispanic householders
$378,442 American Indian or Alaska Native householders
$469,800 Some other race householders
$325,246 Two or more races householders
$469,800 Hispanic or Latino householders
Median age by race in Lebanon
39.3 Median age for White residents37.7 Males43.2 Females33.7 Median age for Black or African American residents32.9 Males51.2 Females9.0 Median age for American Indian / Alaska Native residents6.3 Males-777,777,777.0 Females31.2 Median age for Asian residents44.7 Males32.0 Females-764,705,881.6 Median age for Native Hawaiian / Pacific Islander residents-666,666,666.0 Males-774,891,774.1 Females27.1 Median age for Other race residents34.0 Males28.4 Females30.4 Median age for Two or more races residents23.8 Males44.6 Females40.7 Median age for White alone residents39.4 Males44.3 Females24.7 Median age for Hispanic or Latino residents28.2 Males15.2 Females
Owner/renter occupied households by race in Lebanon
House owners and renters - White residents 3,745 56.9% Owner occupied2,843 43.1% Renter occupiedHouse owners and renters - Black or African American residents 3 3.9% Owner occupied83 96.1% Renter occupiedHouse owners and renters - American Indian / Alaska Native residents 6 30.6% Owner occupied13 69.4% Renter occupiedHouse owners and renters - Asian residents 25 37.2% Owner occupied42 62.8% Renter occupiedHouse owners and renters - Other race residents 52 31.7% Owner occupied112 68.3% Renter occupiedHouse owners and renters - Two or more races residents 155 30.5% Owner occupied353 69.5% Renter occupiedHouse owners and renters - White alone residents 3,702 56.7% Owner occupied2,822 43.3% Renter occupiedHouse owners and renters - Hispanic or Latino residents 147 31.6% Owner occupied318 68.4% Renter occupied
Language usage in Lebanon
English speakers - Total 90.4% of residents of Lebanon speak English at home.
7.8% of residents speak Spanish at home 601 42.6% Speak English very well811 57.4% Speak English less than very well2.7% of residents speak other language at home 104 21.0% Speak English very well391 79.0% Speak English less than very well
English speakers - Born in the United States 93.5% of residents of Lebanon speak English at home.
4.4% of residents speak Spanish at home 161 59.6% Speak English very well109 40.4% Speak English less than very well1.9% of residents speak other language at home 41 35.7% Speak English very well74 64.3% Speak English less than very well
English speakers - Native, born elsewhere 69.2% of residents of Lebanon speak English at home.
6.5% of residents speak other language at home 14 100.0% Speak English very well
English speakers - Foreign-born 39.6% of residents of Lebanon speak English at home.
47.1% of residents speak Spanish at home 79 13.3% Speak English very well513 86.7% Speak English less than very well12.3% of residents speak other language at home 25 16.2% Speak English very well129 83.8% Speak English less than very well
White (Caucasian) - Speak only English Native:
95.7% (14,216)Foreign-born:
47.7% (289)
White (Caucasian) - Speak another language Native:
3.7% (556)Foreign-born:
46.6% (283)
Asian - Speak only English Native:
41.4% (48)Foreign-born:
100.0% (38)
Other race - Speak only English Native:
91.9% (347)Foreign-born:
30.6% (13)
Other race - Speak another language Native:
8.4% (32)Foreign-born:
51.4% (22)
Two or more races - Speak only English Native:
91.4% (1,161)Foreign-born:
29.4% (87)
Two or more races - Speak another language Native:
7.3% (93)Foreign-born:
65.9% (195)
White alone - Speak only English Native:
96.8% (14,050)Foreign-born:
67.8% (284)
White alone - Speak another language Native:
3.0% (431)Foreign-born:
32.3% (135)
Hispanic or Latino - Speak only English Native:
59.0% (593)Foreign-born:
1.6% (12)
Hispanic or Latino - Speak another language Native:
40.4% (406)Foreign-born:
80.4% (576)
Foreign-born residents in Lebanon 1,029 residents are foreign born (3.6% Latin America , 0.8% North America ).
This city:
5.5%Oregon:
9.8%
Marital status for residents in Lebanon Marital status - White (Caucasian) population 15 years and over
Males 35.4% Never married43.0% Now married0.3% Separated3.5% Widowed17.8% DivorcedFemales 26.3% Never married40.7% Now married0.8% Separated15.3% Widowed16.9% DivorcedWomen who gave birth in the past 12 months Now married:
83.9% (186)Unmarried:
16.1% (36)
Women who did not give birth in the past 12 months Now married:
40.8% (1,374)Unmarried:
59.2% (1,994)
Marital status - Black or African American population 15 years and over
Males 0.0% Never married100.0% Now married0.0% Separated0.0% Widowed0.0% DivorcedFemales 14.3% Never married85.7% Now married0.0% Separated0.0% Widowed0.0% DivorcedWomen who did not give birth in the past 12 months Now married:
85.3% (68)Unmarried:
14.7% (12)
Marital status - American Indian / Alaska Native population 15 years and over
Males 72.7% Never married0.0% Now married0.0% Separated27.3% Widowed0.0% DivorcedFemales 0.0% Never married0.0% Now married0.0% Separated0.0% Widowed100.0% DivorcedWomen who did not give birth in the past 12 months Now married:
0.0% (0)Unmarried:
100.0% (13)
Marital status - Asian population 15 years and over
Males 0.0% Never married100.0% Now married0.0% Separated0.0% Widowed0.0% DivorcedFemales 75.6% Never married7.8% Now married0.0% Separated0.0% Widowed16.7% DivorcedWomen who did not give birth in the past 12 months Now married:
7.8% (7)Unmarried:
92.2% (86)
Marital status - Other race population 15 years and over
Males 76.7% Never married23.3% Now married0.0% Separated0.0% Widowed0.0% DivorcedFemales 40.0% Never married10.8% Now married0.0% Separated21.5% Widowed27.7% DivorcedWomen who did not give birth in the past 12 months Now married:
21.2% (19)Unmarried:
78.8% (71)
Marital status - Two or more races population 15 years and over
Males 58.3% Never married40.0% Now married0.0% Separated0.0% Widowed1.7% DivorcedFemales 31.8% Never married49.3% Now married0.0% Separated3.8% Widowed15.2% DivorcedWomen who did not give birth in the past 12 months Now married:
62.7% (236)Unmarried:
37.3% (140)
Marital status - White alone, not Hispanic / Latino population 15 years and over
Males 36.1% Never married42.0% Now married0.3% Separated3.6% Widowed18.1% DivorcedFemales 26.6% Never married39.8% Now married0.8% Separated15.6% Widowed17.2% DivorcedWomen who gave birth in the past 12 months Now married:
83.9% (188)Unmarried:
16.1% (36)
Women who did not give birth in the past 12 months Now married:
38.7% (1,260)Unmarried:
61.3% (1,995)
Marital status - Hispanic or Latino population 15 years and over
Males 37.9% Never married56.9% Now married0.0% Separated0.5% Widowed4.8% DivorcedFemales 16.5% Never married74.9% Now married0.0% Separated0.0% Widowed8.6% DivorcedWomen who did not give birth in the past 12 months Now married:
80.1% (293)Unmarried:
19.9% (73)
Ancestries in Lebanon
1,309 16.3% German
934 11.6% European
640 8.0% American
631 7.9% Irish
553 6.9% English
215 2.7% Italian
215 2.7% Swedish
149 1.9% British
144 1.8% Lithuanian
142 1.8% Scottish
136 1.7% Dutch
84 1.0% Norwegian
80 1.0% Northern European
61 0.8% Polish
48 0.6% Scandinavian
46 0.6% French Canadian
40 0.5% Scotch-Irish
32 0.4% Danish
23 0.3% Belgian
23 0.3% Eastern European
22 0.3% Swiss
20 0.2% French
19 0.2% Ukrainian
18 0.2% Austrian
14 0.2% Serbian
13 0.2% Russian
11 0.1% Finnish
7 0.09% South African
6 0.07% Canadian
5 0.06% Portuguese
4 0.05% Romanian
Geographical mobility in Lebanon
Same house 1 year ago 13,675 86.1% White (Caucasian)
179 100.0% Black or African American
77 100.0% American Indian / Alaska Native
113 74.7% Asian
363 87.4% Other race
1,525 89.0% Two or more races
13,165 86.0% White alone, not Hispanic / Latino
1,671 88.7% Hispanic or Latino
Moved within same county 1,342 8.4% White / Caucasian
14 9.3% Asian
50 12.0% Other race
79 4.6% Two or more races
1,337 8.7% White alone, not Hispanic / Latino
109 5.8% Hispanic or Latino
Moved within same state 514 3.2% White / Caucasian
157 9.2% Two or more races
433 2.8% White alone, not Hispanic / Latino
58 3.1% Hispanic or Latino
Moved from different state 299 1.9% White / Caucasian
20 13.2% Asian
3 40.5% Native Hawaiian / Pacific Islander
314 2.1% White alone, not Hispanic / Latino
Moved from abroad 63 0.4% White
66 0.4% White alone, not Hispanic / Latino
Children Nativity (place of birth) in Lebanon
Children under 6 years - Living with two parents Both parents native 547 100.0% NativeOne native, one foreign-born parent 68 100.0% NativeChildren under 6 years - Living with one parent Native parent 286 100.0% NativeChildren 6 to 17 years - Living with two parents Both parents native 1,294 100.0% NativeBoth parents foreign-born 330 79.0% Native88 21.0% Foreign-bornOne native, one foreign-born parent 22 100.0% NativeChildren 6 to 17 years - Living with one parent Native parent 910 100.0% Native
Grandparents responsible for own grandchildren in Lebanon
Grandparents (30 to 59 years) White / Caucasian 14 16.7% Responsible for grandchildren68 83.3% Not responsible for grandchildrenWhite alone, not Hispanic / Latino 14 16.7% Responsible for grandchildren69 83.3% Not responsible for grandchildrenGrandparents (60 years and over) White / Caucasian 40 24.7% Responsible for grandchildren122 75.3% Not responsible for grandchildrenWhite alone, not Hispanic / Latino 42 25.6% Responsible for grandchildren122 74.4% Not responsible for grandchildren