Races in Lawrence, Indiana (IN) Detailed Stats
Data:
Races - White alone (%)
Races - White alone (% change since 2000)
Races - Black alone (%)
Races - Black alone (% change since 2000)
Races - American Indian alone (%)
Races - American Indian alone (% change since 2000)
Races - Asian alone (%)
Races - Asian alone (% change since 2000)
Races - Hispanic (%)
Races - Hispanic (% change since 2000)
Races - Native Hawaiian and Other Pacific Islander alone (%)
Races - Native Hawaiian and Other Pacific Islander alone (% change since 2000)
Races - Two or more races(%)
Races - Two or more races(% change since 2000)
Races - Other race alone (%)
Races - Other race alone (% change since 2000)
Racial diversity
Place of birth - Born in state of residence (%)
Place of birth - Born in state of residence (%) - White
Place of birth - Born in state of residence (%) - Black or African American
Place of birth - Born in state of residence (%) - Asian
Place of birth - Born in state of residence (%) - Hispanic or Latino
Place of birth - Born in state of residence (%) - American Indian and Alaska Native
Place of birth - Born in state of residence (%) - Multirace
Place of birth - Born in state of residence (%) - Other Race
Place of birth - Born in other state (%)
Place of birth - Born in other state (%) - White
Place of birth - Born in other state (%) - Black or African American
Place of birth - Born in other state (%) - Asian
Place of birth - Born in other state (%) - Hispanic or Latino
Place of birth - Born in other state (%) - American Indian and Alaska Native
Place of birth - Born in other state (%) - Multirace
Place of birth - Born in other state (%) - Other Race
Place of birth - Native, outside of US (%)
Place of birth - Native, outside of US (%) - White
Place of birth - Native, outside of US (%) - Black or African American
Place of birth - Native, outside of US (%) - Asian
Place of birth - Native, outside of US (%) - Hispanic or Latino
Place of birth - Native, outside of US (%) - American Indian and Alaska Native
Place of birth - Native, outside of US (%) - Multirace
Place of birth - Native, outside of US (%) - Other Race
Place of birth - Foreign born (%)
Place of birth - Foreign born (%) - White
Place of birth - Foreign born (%) - Black or African American
Place of birth - Foreign born (%) - Asian
Place of birth - Foreign born (%) - Hispanic or Latino
Place of birth - Foreign born (%) - American Indian and Alaska Native
Place of birth - Foreign born (%) - Multirace
Place of birth - Foreign born (%) - Other Race
Residents speaking English at home (%)
Residents speaking English at home - Born in the United States (%)
Residents speaking English at home - Native, born elsewhere (%)
Residents speaking English at home - Foreign born (%)
Residents speaking Spanish at home (%)
Residents speaking Spanish at home - Born in the United States (%)
Residents speaking Spanish at home - Native, born elsewhere (%)
Residents speaking Spanish at home - Foreign born (%)
Residents speaking other language at home (%)
Residents speaking other language at home - Born in the United States (%)
Residents speaking other language at home - Native, born elsewhere (%)
Residents speaking other language at home - Foreign born (%)
Marital status - Never married (%)
Marital status - Now married (%)
Marital status - Separated (%)
Marital status - Widowed (%)
Marital status - Divorced (%)
Ancestries Reported - Arab (%)
Ancestries Reported - Czech (%)
Ancestries Reported - Danish (%)
Ancestries Reported - Dutch (%)
Ancestries Reported - English (%)
Ancestries Reported - French (%)
Ancestries Reported - French Canadian (%)
Ancestries Reported - German (%)
Ancestries Reported - Greek (%)
Ancestries Reported - Hungarian (%)
Ancestries Reported - Irish (%)
Ancestries Reported - Italian (%)
Ancestries Reported - Lithuanian (%)
Ancestries Reported - Norwegian (%)
Ancestries Reported - Polish (%)
Ancestries Reported - Portuguese (%)
Ancestries Reported - Russian (%)
Ancestries Reported - Scotch-Irish (%)
Ancestries Reported - Scottish (%)
Ancestries Reported - Slovak (%)
Ancestries Reported - Subsaharan African (%)
Ancestries Reported - Swedish (%)
Ancestries Reported - Swiss (%)
Ancestries Reported - Ukrainian (%)
Ancestries Reported - United States (%)
Ancestries Reported - Welsh (%)
Ancestries Reported - West Indian (%)
Ancestries Reported - Other (%)
Geographical mobility - Same house 1 year ago (%)
Geographical mobility - Same house 1 year ago (%) - White
Geographical mobility - Same house 1 year ago (%) - Black or African American
Geographical mobility - Same house 1 year ago (%) - Asian
Geographical mobility - Same house 1 year ago (%) - Hispanic or Latino
Geographical mobility - Same house 1 year ago (%) - American Indian and Alaska Native
Geographical mobility - Same house 1 year ago (%) - Multirace
Geographical mobility - Same house 1 year ago (%) - Other Race
Geographical mobility - Moved within same county (%)
Geographical mobility - Moved within same county (%) - White
Geographical mobility - Moved within same county (%) - Black or African American
Geographical mobility - Moved within same county (%) - Asian
Geographical mobility - Moved within same county (%) - Hispanic or Latino
Geographical mobility - Moved within same county (%) - American Indian and Alaska Native
Geographical mobility - Moved within same county (%) - Multirace
Geographical mobility - Moved within same county (%) - Other Race
Geographical mobility - Moved from different county within same state (%)
Geographical mobility - Moved from different county within same state (%) - White
Geographical mobility - Moved from different county within same state (%) - Black or African American
Geographical mobility - Moved from different county within same state (%) - Asian
Geographical mobility - Moved from different county within same state (%) - Hispanic or Latino
Geographical mobility - Moved from different county within same state (%) - American Indian and Alaska Native
Geographical mobility - Moved from different county within same state (%) - Multirace
Geographical mobility - Moved from different county within same state (%) - Other Race
Geographical mobility - Moved from different state (%)
Geographical mobility - Moved from different state (%) - White
Geographical mobility - Moved from different state (%) - Black or African American
Geographical mobility - Moved from different state (%) - Asian
Geographical mobility - Moved from different state (%) - Hispanic or Latino
Geographical mobility - Moved from different state (%) - American Indian and Alaska Native
Geographical mobility - Moved from different state (%) - Multirace
Geographical mobility - Moved from different state (%) - Other Race
Geographical mobility - Moved from abroad (%)
Geographical mobility - Moved from abroad (%) - White
Geographical mobility - Moved from abroad (%) - Black or African American
Geographical mobility - Moved from abroad (%) - Asian
Geographical mobility - Moved from abroad (%) - Hispanic or Latino
Geographical mobility - Moved from abroad (%) - American Indian and Alaska Native
Geographical mobility - Moved from abroad (%) - Multirace
Geographical mobility - Moved from abroad (%) - Other Race
Place of birth for the foreign-born population - Ireland (%)
Place of birth for the foreign-born population - Denmark (%)
Place of birth for the foreign-born population - Norway (%)
Place of birth for the foreign-born population - Sweden (%)
Place of birth for the foreign-born population - United Kingdom (%)
Place of birth for the foreign-born population - England (%)
Place of birth for the foreign-born population - Scotland (%)
Place of birth for the foreign-born population - Other Northern Europe (%)
Place of birth for the foreign-born population - Austria (%)
Place of birth for the foreign-born population - Belgium (%)
Place of birth for the foreign-born population - France (%)
Place of birth for the foreign-born population - Germany (%)
Place of birth for the foreign-born population - Netherlands (%)
Place of birth for the foreign-born population - Switzerland (%)
Place of birth for the foreign-born population - Other Western Europe (%)
Place of birth for the foreign-born population - Greece (%)
Place of birth for the foreign-born population - Italy (%)
Place of birth for the foreign-born population - Portugal (%)
Place of birth for the foreign-born population - Spain (%)
Place of birth for the foreign-born population - Other Southern Europe (%)
Place of birth for the foreign-born population - Albania (%)
Place of birth for the foreign-born population - Belarus (%)
Place of birth for the foreign-born population - Bosnia and Herzegovina (%)
Place of birth for the foreign-born population - Bulgaria (%)
Place of birth for the foreign-born population - Croatia (%)
Place of birth for the foreign-born population - Czechoslovakia (%)
Place of birth for the foreign-born population - Hungary (%)
Place of birth for the foreign-born population - Latvia (%)
Place of birth for the foreign-born population - Lithuania (%)
Place of birth for the foreign-born population - North Macedonia (Macedonia) (%)
Place of birth for the foreign-born population - Moldova (%)
Place of birth for the foreign-born population - Poland (%)
Place of birth for the foreign-born population - Romania (%)
Place of birth for the foreign-born population - Russia (%)
Place of birth for the foreign-born population - Serbia (%)
Place of birth for the foreign-born population - Ukraine (%)
Place of birth for the foreign-born population - Other Eastern Europe (%)
Place of birth for the foreign-born population - China (%)
Place of birth for the foreign-born population - Hong Kong (%)
Place of birth for the foreign-born population - Taiwan (%)
Place of birth for the foreign-born population - Japan (%)
Place of birth for the foreign-born population - Korea (%)
Place of birth for the foreign-born population - Other Eastern Asia (%)
Place of birth for the foreign-born population - Afghanistan (%)
Place of birth for the foreign-born population - Bangladesh (%)
Place of birth for the foreign-born population - India (%)
Place of birth for the foreign-born population - Iran (%)
Place of birth for the foreign-born population - Kazakhstan (%)
Place of birth for the foreign-born population - Nepal (%)
Place of birth for the foreign-born population - Pakistan (%)
Place of birth for the foreign-born population - Sri Lanka (%)
Place of birth for the foreign-born population - Uzbekistan (%)
Place of birth for the foreign-born population - Other South Central Asia (%)
Place of birth for the foreign-born population - Burma (%)
Place of birth for the foreign-born population - Cambodia (%)
Place of birth for the foreign-born population - Indonesia (%)
Place of birth for the foreign-born population - Laos (%)
Place of birth for the foreign-born population - Malaysia (%)
Place of birth for the foreign-born population - Philippines (%)
Place of birth for the foreign-born population - Singapore (%)
Place of birth for the foreign-born population - Thailand (%)
Place of birth for the foreign-born population - Vietnam (%)
Place of birth for the foreign-born population - Other South Eastern Asia (%)
Place of birth for the foreign-born population - Armenia (%)
Place of birth for the foreign-born population - Iraq (%)
Place of birth for the foreign-born population - Israel (%)
Place of birth for the foreign-born population - Jordan (%)
Place of birth for the foreign-born population - Kuwait (%)
Place of birth for the foreign-born population - Lebanon (%)
Place of birth for the foreign-born population - Saudi Arabia (%)
Place of birth for the foreign-born population - Syria (%)
Place of birth for the foreign-born population - Turkey (%)
Place of birth for the foreign-born population - Yemen (%)
Place of birth for the foreign-born population - Other Western Asia (%)
Place of birth for the foreign-born population - Eritrea (%)
Place of birth for the foreign-born population - Ethiopia (%)
Place of birth for the foreign-born population - Kenya (%)
Place of birth for the foreign-born population - Somalia (%)
Place of birth for the foreign-born population - Uganda (%)
Place of birth for the foreign-born population - Zimbabwe (%)
Place of birth for the foreign-born population - Other Eastern Africa (%)
Place of birth for the foreign-born population - Cameroon (%)
Place of birth for the foreign-born population - Congo (%)
Place of birth for the foreign-born population - Democratic Republic of Congo (Zaire) (%)
Place of birth for the foreign-born population - Other Middle Africa (%)
Place of birth for the foreign-born population - Egypt (%)
Place of birth for the foreign-born population - Morocco (%)
Place of birth for the foreign-born population - Sudan (%)
Place of birth for the foreign-born population - Other Northern Africa (%)
Place of birth for the foreign-born population - South Africa (%)
Place of birth for the foreign-born population - Other Southern Africa (%)
Place of birth for the foreign-born population - Cabo Verde (%)
Place of birth for the foreign-born population - Ghana (%)
Place of birth for the foreign-born population - Liberia (%)
Place of birth for the foreign-born population - Nigeria (%)
Place of birth for the foreign-born population - Senegal (%)
Place of birth for the foreign-born population - Sierra Leone (%)
Place of birth for the foreign-born population - Other Western Africa (%)
Place of birth for the foreign-born population - Australia (%)
Place of birth for the foreign-born population - New Zealand (%)
Place of birth for the foreign-born population - Fiji (%)
Place of birth for the foreign-born population - Micronesia (%)
Place of birth for the foreign-born population - Bahamas (%)
Place of birth for the foreign-born population - Barbados (%)
Place of birth for the foreign-born population - Cuba (%)
Place of birth for the foreign-born population - Dominica (%)
Place of birth for the foreign-born population - Dominican Republic (%)
Place of birth for the foreign-born population - Grenada (%)
Place of birth for the foreign-born population - Haiti (%)
Place of birth for the foreign-born population - Jamaica (%)
Place of birth for the foreign-born population - St. Vincent and the Grenadines (%)
Place of birth for the foreign-born population - Trinidad and Tobago (%)
Place of birth for the foreign-born population - West Indies (%)
Place of birth for the foreign-born population - Other Caribbean (%)
Place of birth for the foreign-born population - Belize (%)
Place of birth for the foreign-born population - Costa Rica (%)
Place of birth for the foreign-born population - El Salvador (%)
Place of birth for the foreign-born population - Guatemala (%)
Place of birth for the foreign-born population - Honduras (%)
Place of birth for the foreign-born population - Mexico (%)
Place of birth for the foreign-born population - Nicaragua (%)
Place of birth for the foreign-born population - Panama (%)
Place of birth for the foreign-born population - Other Central America (%)
Place of birth for the foreign-born population - Argentina (%)
Place of birth for the foreign-born population - Bolivia (%)
Place of birth for the foreign-born population - Brazil (%)
Place of birth for the foreign-born population - Chile (%)
Place of birth for the foreign-born population - Colombia (%)
Place of birth for the foreign-born population - Ecuador (%)
Place of birth for the foreign-born population - Guyana (%)
Place of birth for the foreign-born population - Peru (%)
Place of birth for the foreign-born population - Uruguay (%)
Place of birth for the foreign-born population - Venezuela (%)
Place of birth for the foreign-born population - Other South America (%)
Place of birth for the foreign-born population - Canada (%)
Place of birth for the foreign-born population - Other Northern America (%)
Place of birth for the foreign-born population - Other (%)
Latest news about races in Lawrence, IN collected exclusively by city-data.com from local newspapers, TV, and radio stations
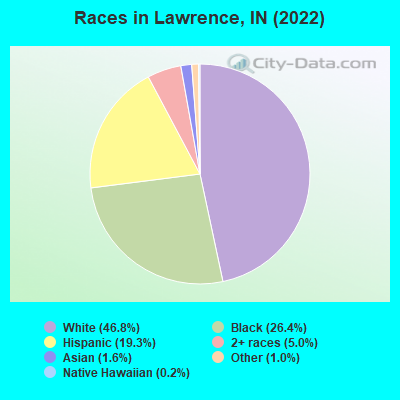
According to 2022 data, the most numerous races in Lawrence, IN are White alone (22,964 residents), Black alone (12,986 residents), and Hispanic (9,489 residents). 80.8% of Lawrence residents speak English at home. 11.4% of Lawrence, IN residents are foreign-born (6.9% born in Latin America, 1.3% born in Asia, 1.3% born in Africa), which is 47.4% greater than the foreign-born rate of 6.0% across the entire state of Indiana.
Race distribution in Lawrence
2000 2022
5,219,373 85.8% White alone 505,462 8.3% Black alone 214,536 3.5% Hispanic 61,115 1.0% Two or more races 58,424 1.0% Asian alone 13,654 0.2% American Indian alone 6,348 0.1% Other race alone 1,573 0.03% Native Hawaiian and Other
5,192,455 76.0% White alone 628,054 9.2% Black alone 534,528 7.8% Hispanic 263,242 3.9% Two or more races 172,880 2.5% Asian alone 33,467 0.5% Other race alone 5,866 0.09% American Indian alone 2,545 0.04% Native Hawaiian and Other
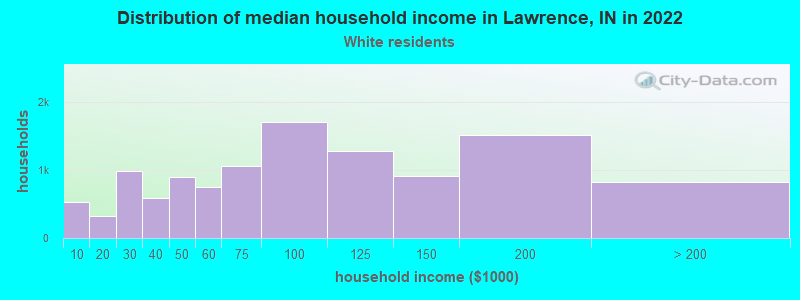
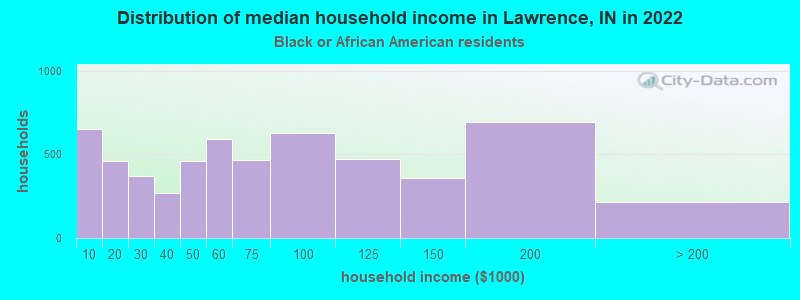
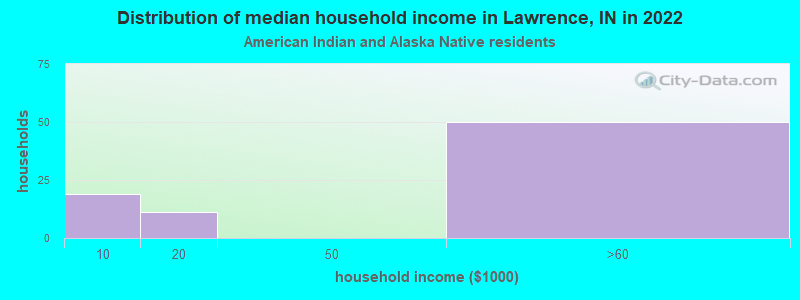
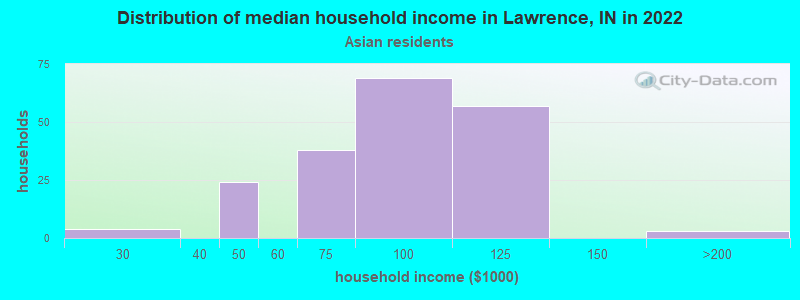
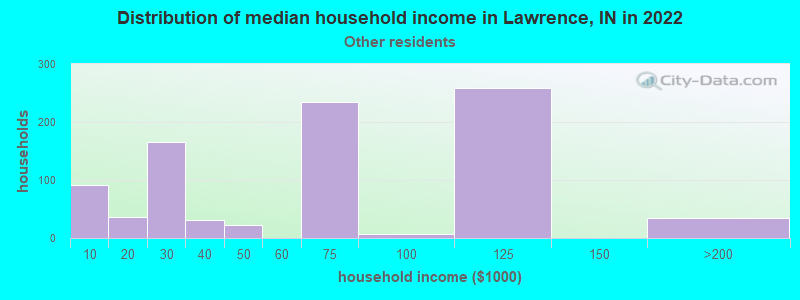
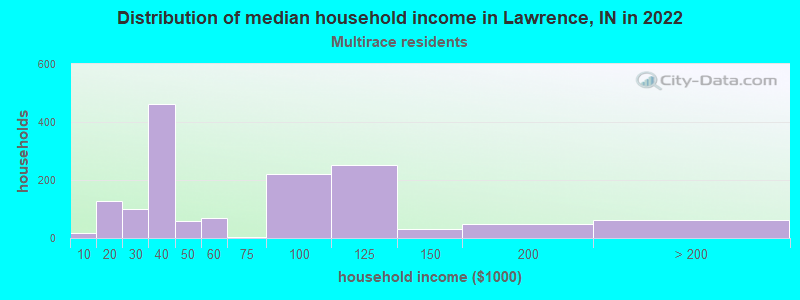
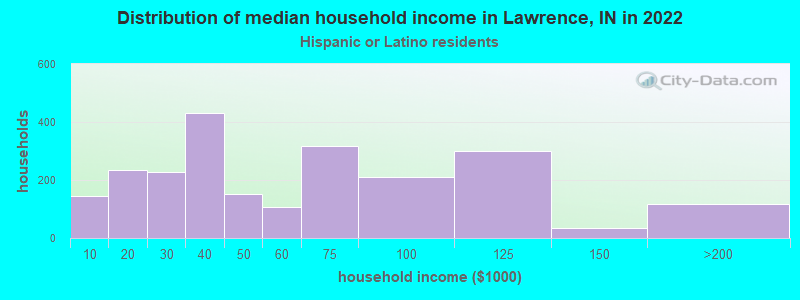
Income and house value in Lawrence Median household income in 2022 $90,131 White non-Hispanic householders$58,202 Black householders$84,555 Asian householders$64,092 Some other race householders$38,769 Two or more races householders$45,727 Hispanic or Latino race householdersMedian 2022 house value $254,580 White Non-Hispanic householders$266,513 Black or African American householders$132,593 American Indian or Alaska Native householders $321,319 Asian householders$234,912 Some other race householders$257,895 Two or more races householders$250,381 Hispanic or Latino householders
Median age by race in Lawrence
39.0 Median age for White residents38.9 39.2 36.8 Median age for Black or African American residents35.7 36.5 7.7 Median age for American Indian / Alaska Native residents42.8 -612,021,857.3 26.5 Median age for Asian residents23.8 26.2 66.7 Median age for Native Hawaiian / Pacific Islander residents-644,025,156.6 67.2 22.2 Median age for Other race residents25.3 17.1 19.6 Median age for Two or more races residents30.8 17.9 41.4 Median age for White alone residents40.8 43.1 18.0 Median age for Hispanic or Latino residents23.7 15.9
Owner/renter occupied households by race in Lawrence
House owners and renters - White residents 8,515 74.6% Owner occupied2,895 25.4% Renter occupiedHouse owners and renters - Black or African American residents 3,002 53.5% Owner occupied2,614 46.5% Renter occupiedHouse owners and renters - American Indian / Alaska Native residents 44 68.7% Owner occupied20 31.3% Renter occupiedHouse owners and renters - Asian residents 260 100.0% Owner occupiedHouse owners and renters - Native Hawaiian / Pacific Islander residents 33 88.0% Owner occupied4 12.0% Renter occupiedHouse owners and renters - Other race residents 414 46.0% Owner occupied485 54.0% Renter occupiedHouse owners and renters - Two or more races residents 963 61.7% Owner occupied599 38.3% Renter occupiedHouse owners and renters - White alone residents 8,215 76.4% Owner occupied2,533 23.6% Renter occupiedHouse owners and renters - Hispanic or Latino residents 1,147 49.3% Owner occupied1,177 50.7% Renter occupied
Language usage in Lawrence
English speakers - Total 80.8% of residents of Lawrence speak English at home.
14.9% of residents speak Spanish at home 2,326 34.2% Speak English very well4,466 65.8% Speak English less than very well4.5% of residents speak other language at home 1,819 88.1% Speak English very well245 11.9% Speak English less than very well
English speakers - Born in the United States 91.6% of residents of Lawrence speak English at home.
7.3% of residents speak Spanish at home 524 60.2% Speak English very well347 39.8% Speak English less than very well1.3% of residents speak other language at home 152 100.0% Speak English very well
English speakers - Native, born elsewhere 75.9% of residents of Lawrence speak English at home.
24.7% of residents speak Spanish at home 44 29.7% Speak English very well104 70.3% Speak English less than very well
English speakers - Foreign-born 13.0% of residents of Lawrence speak English at home.
59.9% of residents speak Spanish at home 564 15.4% Speak English very well3,092 84.6% Speak English less than very well25.6% of residents speak other language at home 1,378 88.2% Speak English very well185 11.8% Speak English less than very well
White (Caucasian) - Speak only English Native:
95.1% (21,847)Foreign-born:
35.8% (316)
White (Caucasian) - Speak another language Native:
4.7% (1,075)Foreign-born:
64.6% (571)
Black or African American - Speak only English Native:
97.5% (10,935)Foreign-born:
16.0% (133)
Black or African American - Speak another language Native:
2.3% (253)Foreign-born:
83.1% (695)
American Indian / Alaska Native - Speak another language Native:
47.1% (78)Foreign-born:
100.0% (61)
Asian - Speak only English Native:
24.6% (21)Foreign-born:
6.3% (40)
Asian - Speak another language Native:
76.2% (64)Foreign-born:
94.4% (602)
Other race - Speak only English Native:
41.7% (628)Foreign-born:
8.7% (141)
Other race - Speak another language Native:
57.7% (869)Foreign-born:
91.4% (1,475)
Two or more races - Speak only English Native:
70.4% (2,547)Foreign-born:
6.0% (103)
Two or more races - Speak another language Native:
33.4% (1,209)Foreign-born:
95.0% (1,624)
White alone - Speak only English Native:
97.1% (21,069)Foreign-born:
71.9% (289)
White alone - Speak another language Native:
2.8% (611)Foreign-born:
28.7% (115)
Hispanic or Latino - Speak only English Native:
43.3% (1,840)Foreign-born:
5.1% (187)
Hispanic or Latino - Speak another language Native:
56.4% (2,398)Foreign-born:
96.3% (3,536)
Foreign-born residents in Lawrence 5,605 residents are foreign born (6.9% Latin America , 1.3% Asia , 1.3% Africa ).
This city:
11.4%Indiana:
5.6%
Marital status for residents in Lawrence Marital status - White (Caucasian) population 15 years and over
Males 33.0% Never married53.7% Now married0.1% Separated2.3% Widowed10.8% DivorcedFemales 29.0% Never married48.3% Now married0.9% Separated8.1% Widowed13.8% DivorcedWomen who gave birth in the past 12 months Now married:
74.5% (169)Unmarried:
25.5% (58)
Women who did not give birth in the past 12 months Now married:
45.3% (2,579)Unmarried:
54.7% (3,114)
Marital status - Black or African American population 15 years and over
Males 41.1% Never married41.6% Now married0.2% Separated2.3% Widowed14.9% DivorcedFemales 52.9% Never married27.3% Now married2.8% Separated6.0% Widowed11.0% DivorcedWomen who gave birth in the past 12 months Now married:
35.0% (71)Unmarried:
65.0% (131)
Women who did not give birth in the past 12 months Now married:
23.9% (889)Unmarried:
76.1% (2,830)
Marital status - Asian population 15 years and over
Males 52.1% Never married47.9% Now married0.0% Separated0.0% Widowed0.0% DivorcedFemales 59.1% Never married29.2% Now married0.0% Separated4.1% Widowed7.6% DivorcedWomen who did not give birth in the past 12 months Now married:
14.6% (54)Unmarried:
85.4% (315)
Marital status - Native Hawaiian / Pacific Islander population 15 years and over
Males 0.0% Never married100.0% Now married0.0% Separated0.0% Widowed0.0% DivorcedFemales 6.1% Never married93.9% Now married0.0% Separated0.0% Widowed0.0% DivorcedWomen who did not give birth in the past 12 months Now married:
66.7% (4)Unmarried:
33.3% (2)
Marital status - Other race population 15 years and over
Males 56.7% Never married43.3% Now married0.0% Separated0.0% Widowed0.0% DivorcedFemales 46.2% Never married51.0% Now married1.9% Separated0.0% Widowed0.9% DivorcedWomen who gave birth in the past 12 months Now married:
83.1% (66)Unmarried:
16.9% (13)
Women who did not give birth in the past 12 months Now married:
49.6% (366)Unmarried:
50.4% (372)
Marital status - Two or more races population 15 years and over
Males 39.1% Never married47.4% Now married2.9% Separated0.0% Widowed10.6% DivorcedFemales 48.5% Never married47.2% Now married0.0% Separated1.2% Widowed3.2% DivorcedWomen who gave birth in the past 12 months Now married:
100.0% (73)Unmarried:
0.0% (0)
Women who did not give birth in the past 12 months Now married:
45.3% (799)Unmarried:
54.7% (967)
Marital status - White alone, not Hispanic / Latino population 15 years and over
Males 33.2% Never married52.6% Now married0.1% Separated2.4% Widowed11.6% DivorcedFemales 28.5% Never married48.0% Now married0.5% Separated8.8% Widowed14.2% DivorcedWomen who gave birth in the past 12 months Now married:
83.5% (127)Unmarried:
16.5% (25)
Women who did not give birth in the past 12 months Now married:
43.8% (2,250)Unmarried:
56.2% (2,887)
Marital status - Hispanic or Latino population 15 years and over
Males 33.8% Never married62.9% Now married1.5% Separated0.0% Widowed1.8% DivorcedFemales 39.7% Never married53.5% Now married2.2% Separated0.7% Widowed3.9% DivorcedWomen who gave birth in the past 12 months Now married:
75.6% (156)Unmarried:
24.4% (50)
Women who did not give birth in the past 12 months Now married:
53.0% (1,256)Unmarried:
47.0% (1,113)
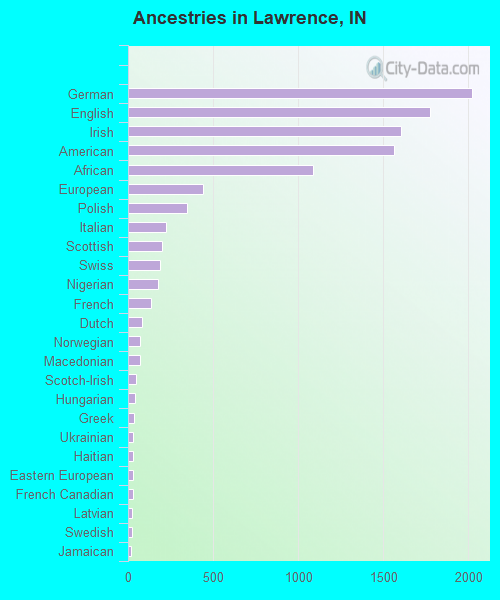
Ancestries in Lawrence
2,021 7.7% German1,778 6.8% English1,607 6.1% Irish1,563 5.9% American1,087 4.1% African440 1.7% European347 1.3% Polish224 0.9% Italian202 0.8% Scottish191 0.7% Swiss176 0.7% Nigerian136 0.5% French80 0.3% Dutch72 0.3% Norwegian72 0.3% Macedonian47 0.2% Scotch-Irish44 0.2% Hungarian36 0.1% Greek31 0.1% Ukrainian31 0.1% Haitian27 0.1% Eastern European27 0.1% French Canadian25 0.09% Latvian25 0.09% Swedish19 0.07% Jamaican14 0.05% Danish13 0.05% British11 0.04% Northern European11 0.04% Scandinavian10 0.04% Austrian10 0.04% Canadian8 0.03% Ugandan8 0.03% Russian7 0.03% Alsatian6 0.02% Romanian
Geographical mobility in Lawrence Same house 1 year ago 22,572 89.8% White (Caucasian)11,577 88.9% Black or African American46 22.4% American Indian / Alaska Native361 47.5% Asian61 94.4% Native Hawaiian / Pacific Islander3,552 98.7% Other race5,380 85.5% Two or more races20,336 89.1% White alone, not Hispanic / Latino8,673 93.2% Hispanic or LatinoMoved within same county 1,078 4.3% White / Caucasian733 5.6% Black or African American104 50.9% American Indian / Alaska Native4 6.2% Native Hawaiian / Pacific Islander41 1.1% Other race213 3.4% Two or more races1,045 4.6% White alone, not Hispanic / Latino198 2.1% Hispanic or LatinoMoved within same state 1,097 4.4% White / Caucasian615 4.7% Black or African American434 57.1% Asian124 3.4% Other race800 12.7% Two or more races1,062 4.7% White alone, not Hispanic / Latino335 3.6% Hispanic or LatinoMoved from different state 315 1.3% White / Caucasian106 0.8% Black or African American96 1.5% Two or more races286 1.3% White alone, not Hispanic / Latino82 0.9% Hispanic or Latino
Children Nativity (place of birth) in Lawrence
Children under 6 years - Living with two parents Both parents native 1,288 100.0% NativeBoth parents foreign-born 918 100.0% NativeOne native, one foreign-born parent 734 100.0% NativeChildren under 6 years - Living with one parent Native parent 1,340 100.0% NativeForeign-born parent 203 100.0% NativeChildren 6 to 17 years - Living with two parents Both parents native 4,122 99.9% Native5 0.1% Foreign-bornBoth parents foreign-born 1,036 78.3% Native286 21.7% Foreign-bornOne native, one foreign-born parent 704 100.0% NativeChildren 6 to 17 years - Living with one parent Native parent 1,794 100.0% NativeForeign-born parent 523 63.7% Native298 36.3% Foreign-born
Grandparents responsible for own grandchildren in Lawrence
Grandparents (30 to 59 years) White / Caucasian 11 55.5% Responsible for grandchildren8 44.5% Not responsible for grandchildrenBlack or African American 8 7.8% Responsible for grandchildren99 92.2% Not responsible for grandchildrenOther race 126 100.0% Not responsible for grandchildrenTwo or more races 11 100.0% Responsible for grandchildrenWhite alone, not Hispanic / Latino 12 49.3% Responsible for grandchildren12 50.7% Not responsible for grandchildrenHispanic or Latino 11 20.3% Responsible for grandchildren45 79.7% Not responsible for grandchildrenGrandparents (60 years and over) White / Caucasian 34 27.4% Responsible for grandchildren90 72.6% Not responsible for grandchildrenBlack or African American 52 38.8% Responsible for grandchildren83 61.2% Not responsible for grandchildrenWhite alone, not Hispanic / Latino 37 28.3% Responsible for grandchildren94 71.7% Not responsible for grandchildren