Races in Laramie, Wyoming (WY) Detailed Stats
Data:
Races - White alone (%)
Races - White alone (% change since 2000)
Races - Black alone (%)
Races - Black alone (% change since 2000)
Races - American Indian alone (%)
Races - American Indian alone (% change since 2000)
Races - Asian alone (%)
Races - Asian alone (% change since 2000)
Races - Hispanic (%)
Races - Hispanic (% change since 2000)
Races - Native Hawaiian and Other Pacific Islander alone (%)
Races - Native Hawaiian and Other Pacific Islander alone (% change since 2000)
Races - Two or more races(%)
Races - Two or more races(% change since 2000)
Races - Other race alone (%)
Races - Other race alone (% change since 2000)
Racial diversity
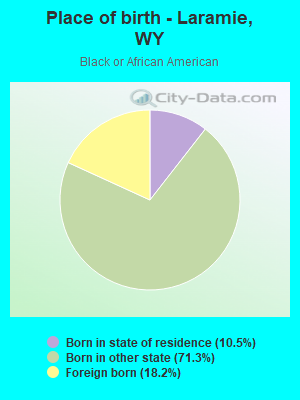
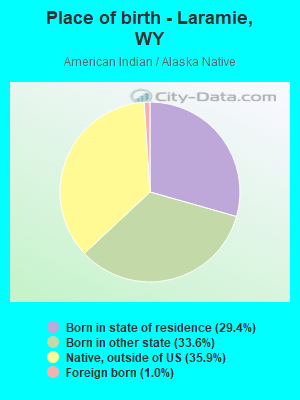
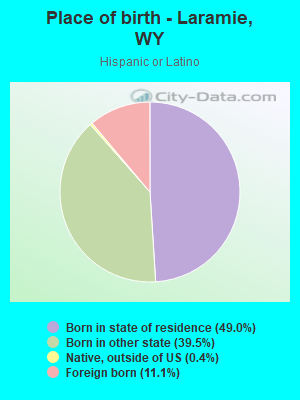
Place of birth - Born in state of residence (%)
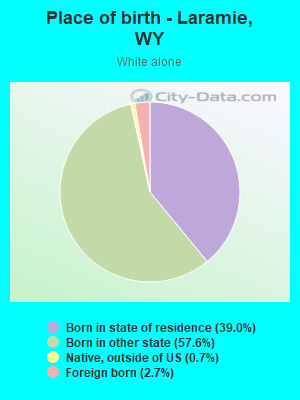
Place of birth - Born in state of residence (%) - White
Place of birth - Born in state of residence (%) - Black or African American
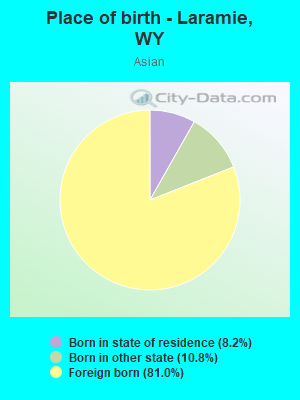
Place of birth - Born in state of residence (%) - Asian
Place of birth - Born in state of residence (%) - Hispanic or Latino
Place of birth - Born in state of residence (%) - American Indian and Alaska Native
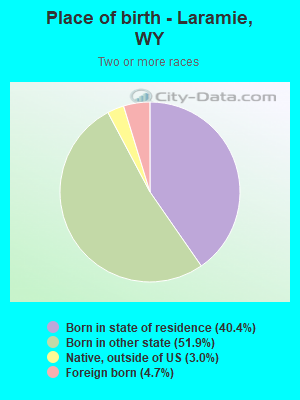
Place of birth - Born in state of residence (%) - Multirace
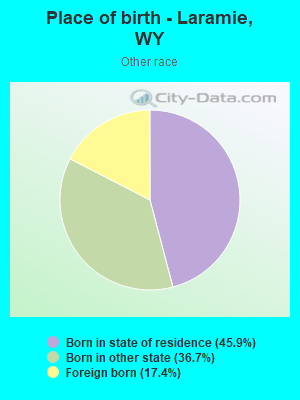
Place of birth - Born in state of residence (%) - Other Race
Place of birth - Born in other state (%)
Place of birth - Born in other state (%) - White
Place of birth - Born in other state (%) - Black or African American
Place of birth - Born in other state (%) - Asian
Place of birth - Born in other state (%) - Hispanic or Latino
Place of birth - Born in other state (%) - American Indian and Alaska Native
Place of birth - Born in other state (%) - Multirace
Place of birth - Born in other state (%) - Other Race
Place of birth - Native, outside of US (%)
Place of birth - Native, outside of US (%) - White
Place of birth - Native, outside of US (%) - Black or African American
Place of birth - Native, outside of US (%) - Asian
Place of birth - Native, outside of US (%) - Hispanic or Latino
Place of birth - Native, outside of US (%) - American Indian and Alaska Native
Place of birth - Native, outside of US (%) - Multirace
Place of birth - Native, outside of US (%) - Other Race
Place of birth - Foreign born (%)
Place of birth - Foreign born (%) - White
Place of birth - Foreign born (%) - Black or African American
Place of birth - Foreign born (%) - Asian
Place of birth - Foreign born (%) - Hispanic or Latino
Place of birth - Foreign born (%) - American Indian and Alaska Native
Place of birth - Foreign born (%) - Multirace
Place of birth - Foreign born (%) - Other Race
Residents speaking English at home (%)
Residents speaking English at home - Born in the United States (%)
Residents speaking English at home - Native, born elsewhere (%)
Residents speaking English at home - Foreign born (%)
Residents speaking Spanish at home (%)
Residents speaking Spanish at home - Born in the United States (%)
Residents speaking Spanish at home - Native, born elsewhere (%)
Residents speaking Spanish at home - Foreign born (%)
Residents speaking other language at home (%)
Residents speaking other language at home - Born in the United States (%)
Residents speaking other language at home - Native, born elsewhere (%)
Residents speaking other language at home - Foreign born (%)
Marital status - Never married (%)
Marital status - Now married (%)
Marital status - Separated (%)
Marital status - Widowed (%)
Marital status - Divorced (%)
Ancestries Reported - Arab (%)
Ancestries Reported - Czech (%)
Ancestries Reported - Danish (%)
Ancestries Reported - Dutch (%)
Ancestries Reported - English (%)
Ancestries Reported - French (%)
Ancestries Reported - French Canadian (%)
Ancestries Reported - German (%)
Ancestries Reported - Greek (%)
Ancestries Reported - Hungarian (%)
Ancestries Reported - Irish (%)
Ancestries Reported - Italian (%)
Ancestries Reported - Lithuanian (%)
Ancestries Reported - Norwegian (%)
Ancestries Reported - Polish (%)
Ancestries Reported - Portuguese (%)
Ancestries Reported - Russian (%)
Ancestries Reported - Scotch-Irish (%)
Ancestries Reported - Scottish (%)
Ancestries Reported - Slovak (%)
Ancestries Reported - Subsaharan African (%)
Ancestries Reported - Swedish (%)
Ancestries Reported - Swiss (%)
Ancestries Reported - Ukrainian (%)
Ancestries Reported - United States (%)
Ancestries Reported - Welsh (%)
Ancestries Reported - West Indian (%)
Ancestries Reported - Other (%)
Geographical mobility - Same house 1 year ago (%)
Geographical mobility - Same house 1 year ago (%) - White
Geographical mobility - Same house 1 year ago (%) - Black or African American
Geographical mobility - Same house 1 year ago (%) - Asian
Geographical mobility - Same house 1 year ago (%) - Hispanic or Latino
Geographical mobility - Same house 1 year ago (%) - American Indian and Alaska Native
Geographical mobility - Same house 1 year ago (%) - Multirace
Geographical mobility - Same house 1 year ago (%) - Other Race
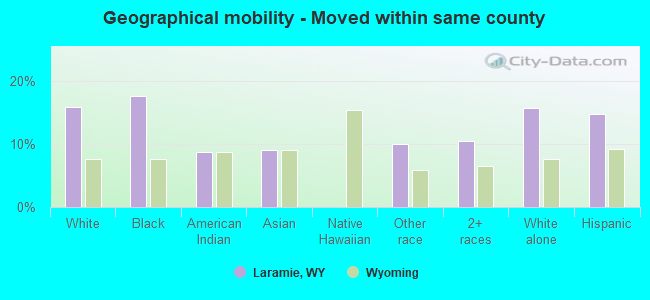
Geographical mobility - Moved within same county (%)
Geographical mobility - Moved within same county (%) - White
Geographical mobility - Moved within same county (%) - Black or African American
Geographical mobility - Moved within same county (%) - Asian
Geographical mobility - Moved within same county (%) - Hispanic or Latino
Geographical mobility - Moved within same county (%) - American Indian and Alaska Native
Geographical mobility - Moved within same county (%) - Multirace
Geographical mobility - Moved within same county (%) - Other Race
Geographical mobility - Moved from different county within same state (%)
Geographical mobility - Moved from different county within same state (%) - White
Geographical mobility - Moved from different county within same state (%) - Black or African American
Geographical mobility - Moved from different county within same state (%) - Asian
Geographical mobility - Moved from different county within same state (%) - Hispanic or Latino
Geographical mobility - Moved from different county within same state (%) - American Indian and Alaska Native
Geographical mobility - Moved from different county within same state (%) - Multirace
Geographical mobility - Moved from different county within same state (%) - Other Race
Geographical mobility - Moved from different state (%)
Geographical mobility - Moved from different state (%) - White
Geographical mobility - Moved from different state (%) - Black or African American
Geographical mobility - Moved from different state (%) - Asian
Geographical mobility - Moved from different state (%) - Hispanic or Latino
Geographical mobility - Moved from different state (%) - American Indian and Alaska Native
Geographical mobility - Moved from different state (%) - Multirace
Geographical mobility - Moved from different state (%) - Other Race
Geographical mobility - Moved from abroad (%)
Geographical mobility - Moved from abroad (%) - White
Geographical mobility - Moved from abroad (%) - Black or African American
Geographical mobility - Moved from abroad (%) - Asian
Geographical mobility - Moved from abroad (%) - Hispanic or Latino
Geographical mobility - Moved from abroad (%) - American Indian and Alaska Native
Geographical mobility - Moved from abroad (%) - Multirace
Geographical mobility - Moved from abroad (%) - Other Race
Place of birth for the foreign-born population - Ireland (%)
Place of birth for the foreign-born population - Denmark (%)
Place of birth for the foreign-born population - Norway (%)
Place of birth for the foreign-born population - Sweden (%)
Place of birth for the foreign-born population - United Kingdom (%)
Place of birth for the foreign-born population - England (%)
Place of birth for the foreign-born population - Scotland (%)
Place of birth for the foreign-born population - Other Northern Europe (%)
Place of birth for the foreign-born population - Austria (%)
Place of birth for the foreign-born population - Belgium (%)
Place of birth for the foreign-born population - France (%)
Place of birth for the foreign-born population - Germany (%)
Place of birth for the foreign-born population - Netherlands (%)
Place of birth for the foreign-born population - Switzerland (%)
Place of birth for the foreign-born population - Other Western Europe (%)
Place of birth for the foreign-born population - Greece (%)
Place of birth for the foreign-born population - Italy (%)
Place of birth for the foreign-born population - Portugal (%)
Place of birth for the foreign-born population - Spain (%)
Place of birth for the foreign-born population - Other Southern Europe (%)
Place of birth for the foreign-born population - Albania (%)
Place of birth for the foreign-born population - Belarus (%)
Place of birth for the foreign-born population - Bosnia and Herzegovina (%)
Place of birth for the foreign-born population - Bulgaria (%)
Place of birth for the foreign-born population - Croatia (%)
Place of birth for the foreign-born population - Czechoslovakia (%)
Place of birth for the foreign-born population - Hungary (%)
Place of birth for the foreign-born population - Latvia (%)
Place of birth for the foreign-born population - Lithuania (%)
Place of birth for the foreign-born population - North Macedonia (Macedonia) (%)
Place of birth for the foreign-born population - Moldova (%)
Place of birth for the foreign-born population - Poland (%)
Place of birth for the foreign-born population - Romania (%)
Place of birth for the foreign-born population - Russia (%)
Place of birth for the foreign-born population - Serbia (%)
Place of birth for the foreign-born population - Ukraine (%)
Place of birth for the foreign-born population - Other Eastern Europe (%)
Place of birth for the foreign-born population - China (%)
Place of birth for the foreign-born population - Hong Kong (%)
Place of birth for the foreign-born population - Taiwan (%)
Place of birth for the foreign-born population - Japan (%)
Place of birth for the foreign-born population - Korea (%)
Place of birth for the foreign-born population - Other Eastern Asia (%)
Place of birth for the foreign-born population - Afghanistan (%)
Place of birth for the foreign-born population - Bangladesh (%)
Place of birth for the foreign-born population - India (%)
Place of birth for the foreign-born population - Iran (%)
Place of birth for the foreign-born population - Kazakhstan (%)
Place of birth for the foreign-born population - Nepal (%)
Place of birth for the foreign-born population - Pakistan (%)
Place of birth for the foreign-born population - Sri Lanka (%)
Place of birth for the foreign-born population - Uzbekistan (%)
Place of birth for the foreign-born population - Other South Central Asia (%)
Place of birth for the foreign-born population - Burma (%)
Place of birth for the foreign-born population - Cambodia (%)
Place of birth for the foreign-born population - Indonesia (%)
Place of birth for the foreign-born population - Laos (%)
Place of birth for the foreign-born population - Malaysia (%)
Place of birth for the foreign-born population - Philippines (%)
Place of birth for the foreign-born population - Singapore (%)
Place of birth for the foreign-born population - Thailand (%)
Place of birth for the foreign-born population - Vietnam (%)
Place of birth for the foreign-born population - Other South Eastern Asia (%)
Place of birth for the foreign-born population - Armenia (%)
Place of birth for the foreign-born population - Iraq (%)
Place of birth for the foreign-born population - Israel (%)
Place of birth for the foreign-born population - Jordan (%)
Place of birth for the foreign-born population - Kuwait (%)
Place of birth for the foreign-born population - Lebanon (%)
Place of birth for the foreign-born population - Saudi Arabia (%)
Place of birth for the foreign-born population - Syria (%)
Place of birth for the foreign-born population - Turkey (%)
Place of birth for the foreign-born population - Yemen (%)
Place of birth for the foreign-born population - Other Western Asia (%)
Place of birth for the foreign-born population - Eritrea (%)
Place of birth for the foreign-born population - Ethiopia (%)
Place of birth for the foreign-born population - Kenya (%)
Place of birth for the foreign-born population - Somalia (%)
Place of birth for the foreign-born population - Uganda (%)
Place of birth for the foreign-born population - Zimbabwe (%)
Place of birth for the foreign-born population - Other Eastern Africa (%)
Place of birth for the foreign-born population - Cameroon (%)
Place of birth for the foreign-born population - Congo (%)
Place of birth for the foreign-born population - Democratic Republic of Congo (Zaire) (%)
Place of birth for the foreign-born population - Other Middle Africa (%)
Place of birth for the foreign-born population - Egypt (%)
Place of birth for the foreign-born population - Morocco (%)
Place of birth for the foreign-born population - Sudan (%)
Place of birth for the foreign-born population - Other Northern Africa (%)
Place of birth for the foreign-born population - South Africa (%)
Place of birth for the foreign-born population - Other Southern Africa (%)
Place of birth for the foreign-born population - Cabo Verde (%)
Place of birth for the foreign-born population - Ghana (%)
Place of birth for the foreign-born population - Liberia (%)
Place of birth for the foreign-born population - Nigeria (%)
Place of birth for the foreign-born population - Senegal (%)
Place of birth for the foreign-born population - Sierra Leone (%)
Place of birth for the foreign-born population - Other Western Africa (%)
Place of birth for the foreign-born population - Australia (%)
Place of birth for the foreign-born population - New Zealand (%)
Place of birth for the foreign-born population - Fiji (%)
Place of birth for the foreign-born population - Micronesia (%)
Place of birth for the foreign-born population - Bahamas (%)
Place of birth for the foreign-born population - Barbados (%)
Place of birth for the foreign-born population - Cuba (%)
Place of birth for the foreign-born population - Dominica (%)
Place of birth for the foreign-born population - Dominican Republic (%)
Place of birth for the foreign-born population - Grenada (%)
Place of birth for the foreign-born population - Haiti (%)
Place of birth for the foreign-born population - Jamaica (%)
Place of birth for the foreign-born population - St. Vincent and the Grenadines (%)
Place of birth for the foreign-born population - Trinidad and Tobago (%)
Place of birth for the foreign-born population - West Indies (%)
Place of birth for the foreign-born population - Other Caribbean (%)
Place of birth for the foreign-born population - Belize (%)
Place of birth for the foreign-born population - Costa Rica (%)
Place of birth for the foreign-born population - El Salvador (%)
Place of birth for the foreign-born population - Guatemala (%)
Place of birth for the foreign-born population - Honduras (%)
Place of birth for the foreign-born population - Mexico (%)
Place of birth for the foreign-born population - Nicaragua (%)
Place of birth for the foreign-born population - Panama (%)
Place of birth for the foreign-born population - Other Central America (%)
Place of birth for the foreign-born population - Argentina (%)
Place of birth for the foreign-born population - Bolivia (%)
Place of birth for the foreign-born population - Brazil (%)
Place of birth for the foreign-born population - Chile (%)
Place of birth for the foreign-born population - Colombia (%)
Place of birth for the foreign-born population - Ecuador (%)
Place of birth for the foreign-born population - Guyana (%)
Place of birth for the foreign-born population - Peru (%)
Place of birth for the foreign-born population - Uruguay (%)
Place of birth for the foreign-born population - Venezuela (%)
Place of birth for the foreign-born population - Other South America (%)
Place of birth for the foreign-born population - Canada (%)
Place of birth for the foreign-born population - Other Northern America (%)
Place of birth for the foreign-born population - Other (%)
Latest news about races in Laramie, WY collected exclusively by city-data.com from local newspapers, TV, and radio stations
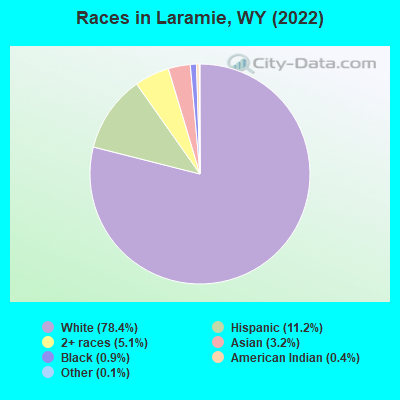
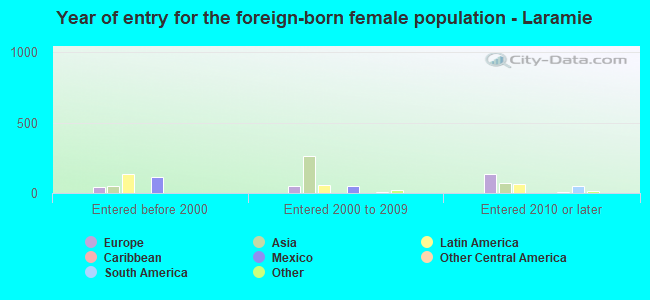
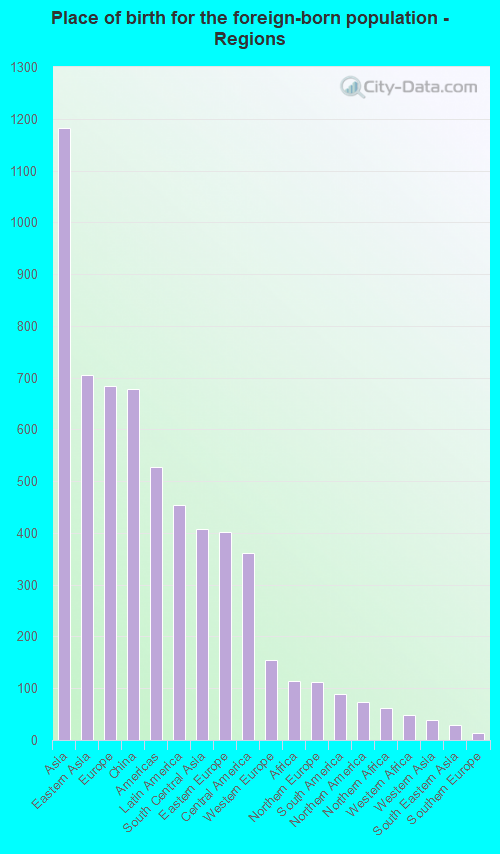
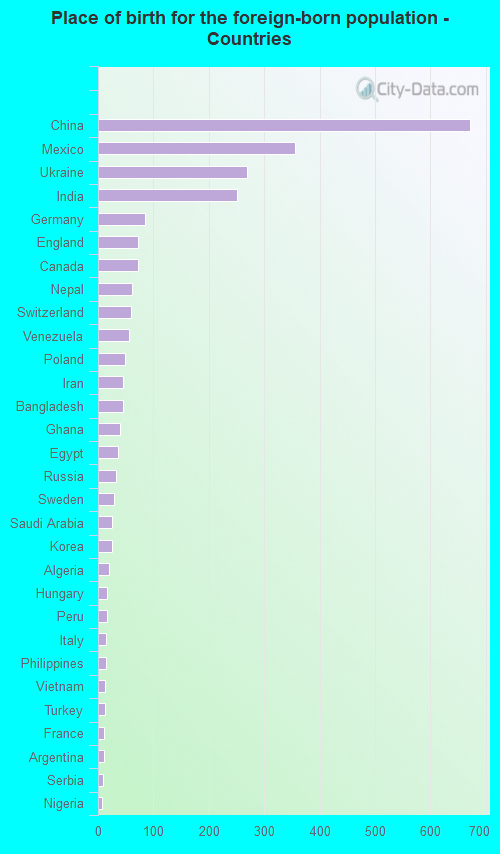
According to 2022 data, the most numerous races in Laramie, WY are White alone (25,033 residents), Hispanic (3,579 residents), and Two or more races (1,614 residents). 89.0% of Laramie residents speak English at home. 7.8% of Laramie, WY residents are foreign-born (3.6% born in Asia, 2.1% born in Europe, 1.4% born in Latin America), which is 61.8% greater than the foreign-born rate of 3.0% across the entire state of Wyoming.
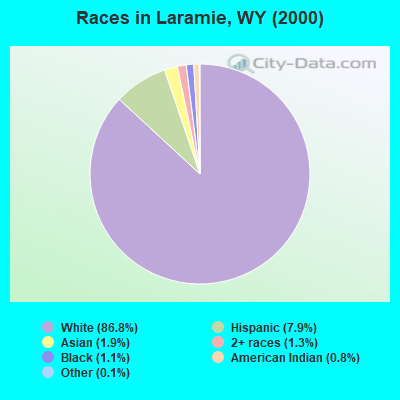
Race distribution in Laramie
2000 2022
438,799 88.9% White alone 31,669 6.4% Hispanic 10,238 2.1% American Indian alone 6,164 1.2% Two or more races 3,504 0.7% Black alone 2,670 0.5% Asian alone 474 0.10% Other race alone 264 0.05% Native Hawaiian and Other
473,220 81.4% White alone 62,803 10.8% Hispanic 22,911 3.9% Two or more races 9,589 1.6% American Indian alone 4,997 0.9% Other race alone 3,990 0.7% Black alone 3,577 0.6% Asian alone 294 0.05% Native Hawaiian and Other
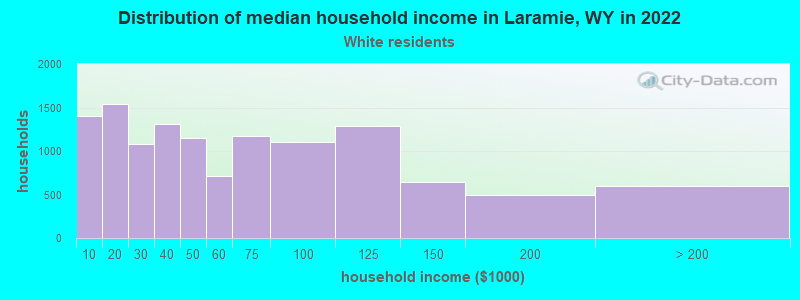
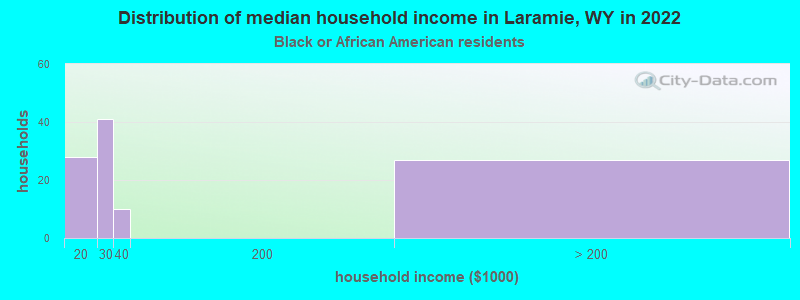
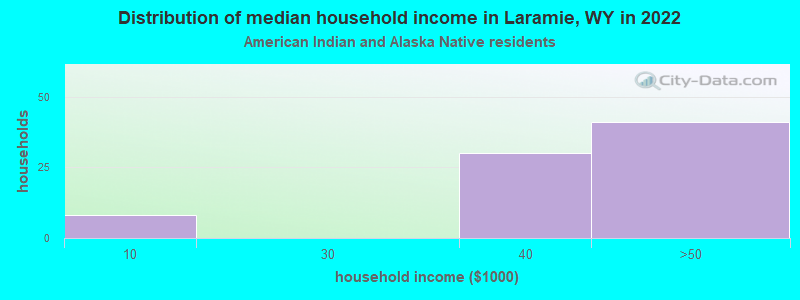
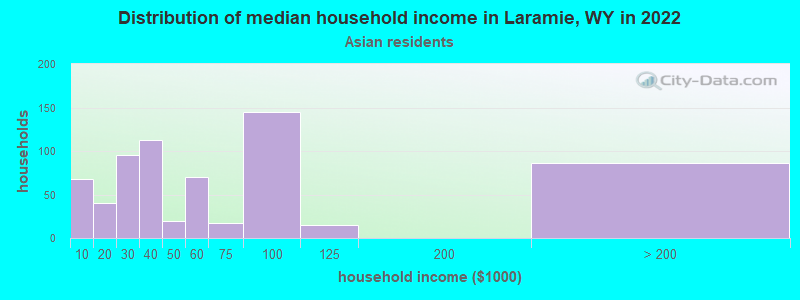
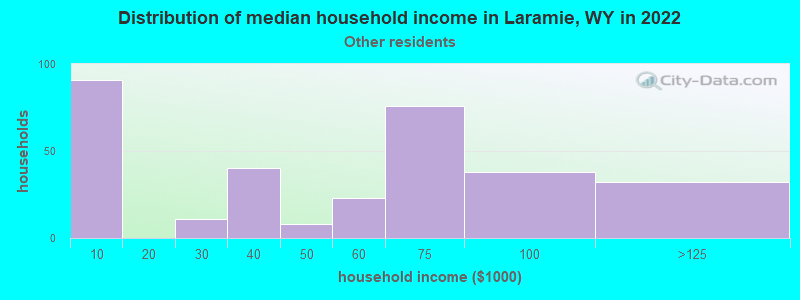
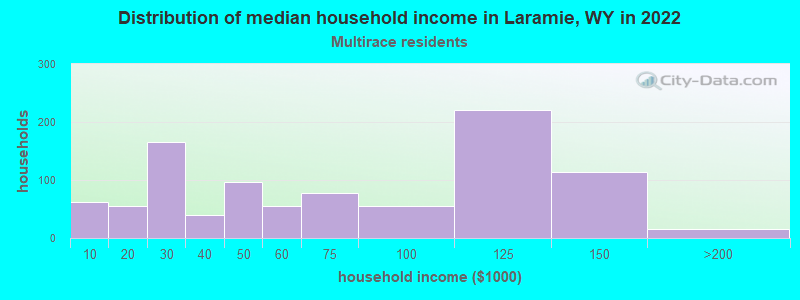
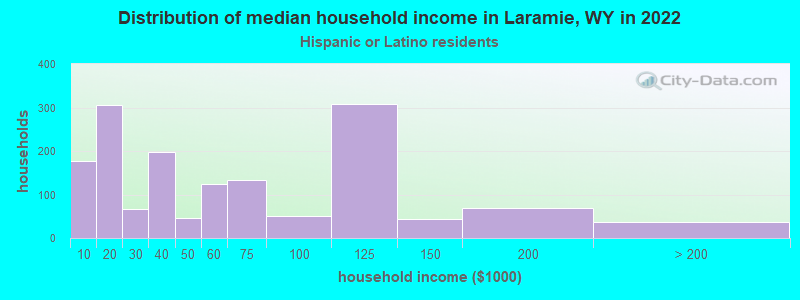
Income and house value in Laramie Median household income in 2022 $49,750 White non-Hispanic householders$24,146 Black householders$29,303 American Indian and Alaska Native householders$65,223 Asian householders$63,507 Some other race householders$48,953 Two or more races householders$42,918 Hispanic or Latino race householdersMedian 2022 house value $318,591 White Non-Hispanic householders$132,451 Black or African American householders$359,471 American Indian or Alaska Native householders $421,336 Asian householders$263,812 Some other race householders$354,293 Two or more races householders$267,355 Hispanic or Latino householders
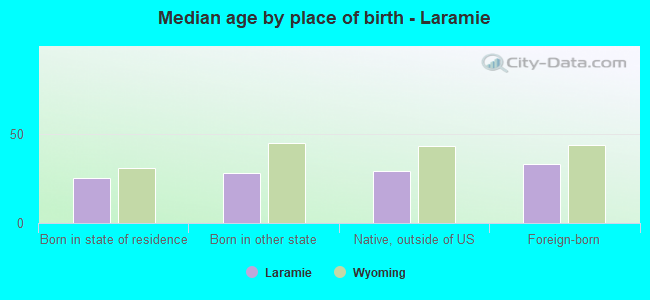
Median age by race in Laramie
26.7 Median age for White residents26.5 26.8 24.9 Median age for Black or African American residents21.1 25.3 42.2 Median age for American Indian / Alaska Native residents72.0 23.7 32.5 Median age for Asian residents29.0 34.6 -594,708,994.1 Median age for Native Hawaiian / Pacific Islander residents-652,729,383.8 -865,828,091.4 42.2 Median age for Other race residents45.4 36.4 31.5 Median age for Two or more races residents28.1 33.3 26.9 Median age for White alone residents26.4 27.4 29.8 Median age for Hispanic or Latino residents32.1 29.2
Owner/renter occupied households by race in Laramie
House owners and renters - White residents 5,841 48.5% Owner occupied6,193 51.5% Renter occupiedHouse owners and renters - Black or African American residents 103 100.0% Renter occupiedHouse owners and renters - American Indian / Alaska Native residents 82 100.0% Renter occupiedHouse owners and renters - Asian residents 121 17.6% Owner occupied566 82.4% Renter occupiedHouse owners and renters - Other race residents 243 63.4% Owner occupied140 36.6% Renter occupiedHouse owners and renters - Two or more races residents 512 48.6% Owner occupied542 51.4% Renter occupiedHouse owners and renters - White alone residents 5,485 48.5% Owner occupied5,818 51.5% Renter occupiedHouse owners and renters - Hispanic or Latino residents 843 50.9% Owner occupied814 49.1% Renter occupied
Language usage in Laramie
English speakers - Total 89.0% of residents of Laramie speak English at home.
4.7% of residents speak Spanish at home 1,161 80.0% Speak English very well290 20.0% Speak English less than very well4.9% of residents speak other language at home 1,085 71.2% Speak English very well438 28.8% Speak English less than very well
English speakers - Born in the United States 95.3% of residents of Laramie speak English at home.
3.6% of residents speak Spanish at home 511 83.6% Speak English very well100 16.4% Speak English less than very well0.9% of residents speak other language at home 147 99.3% Speak English very well1 0.7% Speak English less than very well
English speakers - Native, born elsewhere 87.1% of residents of Laramie speak English at home.
13.3% of residents speak other language at home 33 100.0% Speak English very well
English speakers - Foreign-born 18.9% of residents of Laramie speak English at home.
18.1% of residents speak Spanish at home 250 63.3% Speak English very well145 36.7% Speak English less than very well56.8% of residents speak other language at home 743 59.8% Speak English very well500 40.2% Speak English less than very well
White (Caucasian) - Speak only English Native:
97.3% (23,983)Foreign-born:
26.9% (175)
White (Caucasian) - Speak another language Native:
2.3% (572)Foreign-born:
67.8% (439)
Black or African American - Speak only English Native:
100.0% (309)Foreign-born:
51.5% (28)
American Indian / Alaska Native - Speak another language Native:
7.3% (11)Foreign-born:
100.0% (2)
Asian - Speak only English Native:
93.2% (104)Foreign-born:
29.9% (299)
Asian - Speak another language Native:
41.0% (46)Foreign-born:
67.1% (671)
Other race - Speak only English Native:
66.5% (370)Foreign-born:
0.8% (1)
Other race - Speak another language Native:
34.0% (189)Foreign-born:
100.0% (121)
Two or more races - Speak only English Native:
77.1% (2,142)Foreign-born:
0.6% (1)
Two or more races - Speak another language Native:
24.0% (666)Foreign-born:
100.0% (146)
White alone - Speak only English Native:
97.7% (22,943)Foreign-born:
27.8% (187)
White alone - Speak another language Native:
2.0% (471)Foreign-born:
73.5% (495)
Hispanic or Latino - Speak only English Native:
71.8% (2,134)Foreign-born:
3.8% (15)
Hispanic or Latino - Speak another language Native:
28.2% (839)Foreign-born:
100.0% (402)
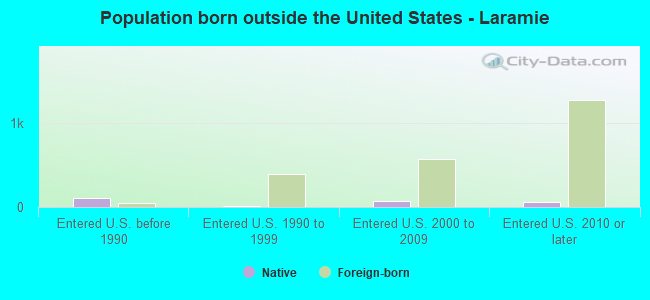
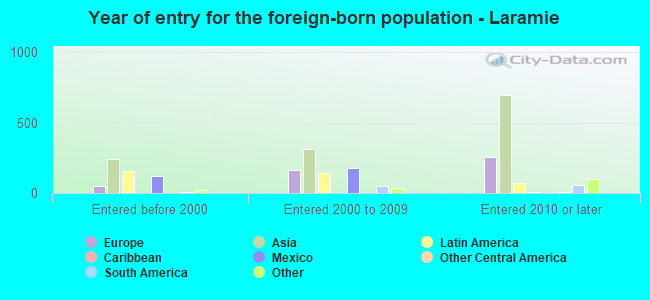
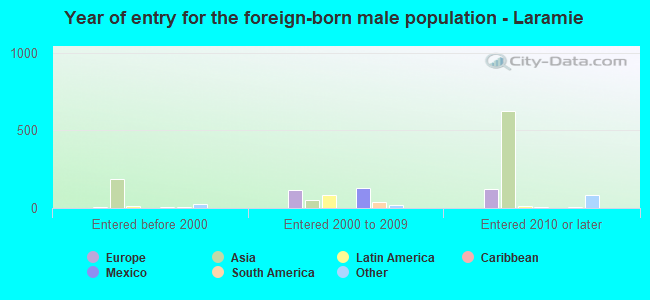
Foreign-born residents in Laramie 2,506 residents are foreign born (3.6% Asia , 2.1% Europe , 1.4% Latin America ).
This city:
7.8%Wyoming:
3.4%
Marital status for residents in Laramie Marital status - White (Caucasian) population 15 years and over
Males 55.6% Never married36.1% Now married0.6% Separated1.4% Widowed6.3% DivorcedFemales 50.2% Never married36.8% Now married1.2% Separated4.0% Widowed7.9% DivorcedWomen who gave birth in the past 12 months Now married:
68.1% (203)Unmarried:
31.9% (95)
Women who did not give birth in the past 12 months Now married:
28.7% (2,246)Unmarried:
71.3% (5,587)
Marital status - Black or African American population 15 years and over
Males 88.6% Never married0.7% Now married0.0% Separated0.0% Widowed10.7% DivorcedFemales 95.4% Never married4.6% Now married0.0% Separated0.0% Widowed0.0% DivorcedWomen who did not give birth in the past 12 months Now married:
4.6% (3)Unmarried:
95.4% (61)
Marital status - American Indian / Alaska Native population 15 years and over
Males 72.5% Never married23.2% Now married0.0% Separated0.0% Widowed4.3% DivorcedFemales 68.3% Never married20.6% Now married0.0% Separated0.0% Widowed11.1% DivorcedWomen who did not give birth in the past 12 months Now married:
27.1% (12)Unmarried:
72.9% (32)
Marital status - Asian population 15 years and over
Males 60.2% Never married37.7% Now married0.0% Separated0.0% Widowed2.1% DivorcedFemales 57.1% Never married37.4% Now married0.0% Separated0.7% Widowed4.8% DivorcedWomen who did not give birth in the past 12 months Now married:
14.3% (42)Unmarried:
85.7% (252)
Marital status - Other race population 15 years and over
Males 31.8% Never married42.4% Now married0.0% Separated0.0% Widowed25.9% DivorcedFemales 22.4% Never married56.3% Now married0.0% Separated13.8% Widowed7.5% DivorcedWomen who gave birth in the past 12 months Now married:
0.0% (0)Unmarried:
100.0% (7)
Women who did not give birth in the past 12 months Now married:
62.6% (110)Unmarried:
37.4% (66)
Marital status - Two or more races population 15 years and over
Males 47.4% Never married42.8% Now married0.0% Separated0.0% Widowed9.8% DivorcedFemales 40.4% Never married40.3% Now married0.5% Separated10.5% Widowed8.2% DivorcedWomen who gave birth in the past 12 months Now married:
100.0% (68)Unmarried:
0.0% (0)
Women who did not give birth in the past 12 months Now married:
32.7% (324)Unmarried:
67.3% (668)
Marital status - White alone, not Hispanic / Latino population 15 years and over
Males 54.6% Never married37.6% Now married0.6% Separated1.2% Widowed6.0% DivorcedFemales 49.3% Never married37.6% Now married1.2% Separated4.0% Widowed7.9% DivorcedWomen who gave birth in the past 12 months Now married:
89.0% (208)Unmarried:
11.0% (26)
Women who did not give birth in the past 12 months Now married:
29.0% (2,180)Unmarried:
71.0% (5,325)
Marital status - Hispanic or Latino population 15 years and over
Males 57.7% Never married24.8% Now married0.0% Separated2.8% Widowed14.7% DivorcedFemales 45.0% Never married37.9% Now married0.7% Separated11.1% Widowed5.2% DivorcedWomen who gave birth in the past 12 months Now married:
0.0% (0)Unmarried:
100.0% (79)
Women who did not give birth in the past 12 months Now married:
37.3% (350)Unmarried:
62.7% (588)
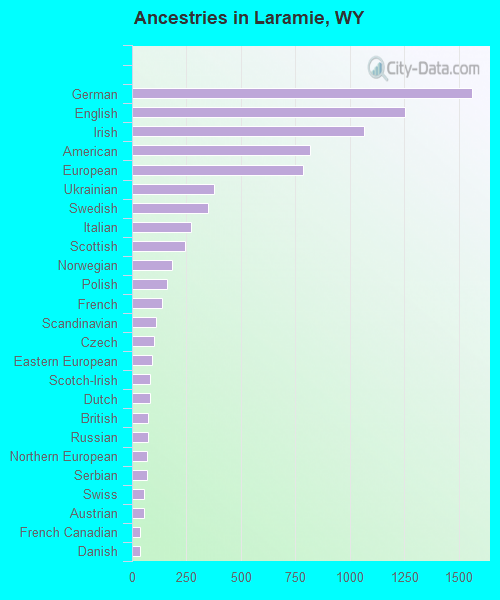
Ancestries in Laramie
1,560 12.4% German1,251 9.9% English1,066 8.5% Irish818 6.5% American784 6.2% European375 3.0% Ukrainian349 2.8% Swedish269 2.1% Italian244 1.9% Scottish185 1.5% Norwegian159 1.3% Polish137 1.1% French112 0.9% Scandinavian102 0.8% Czech90 0.7% Eastern European84 0.7% Scotch-Irish81 0.6% Dutch73 0.6% British73 0.6% Russian71 0.6% Northern European68 0.5% Serbian57 0.5% Swiss55 0.4% Austrian38 0.3% French Canadian37 0.3% Danish33 0.3% Portuguese32 0.3% Cajun26 0.2% Iranian25 0.2% Egyptian20 0.2% Slovene20 0.2% Canadian19 0.2% Finnish19 0.2% Ghanaian18 0.1% Greek17 0.1% Icelander16 0.1% Hungarian16 0.1% Welsh15 0.1% Czechoslovakian12 0.10% Croatian12 0.10% Turkish11 0.09% Nigerian9 0.07% Romanian9 0.07% Armenian8 0.06% Slavic8 0.06% Belgian4 0.03% Jamaican3 0.02% Sudanese1 0.01% African
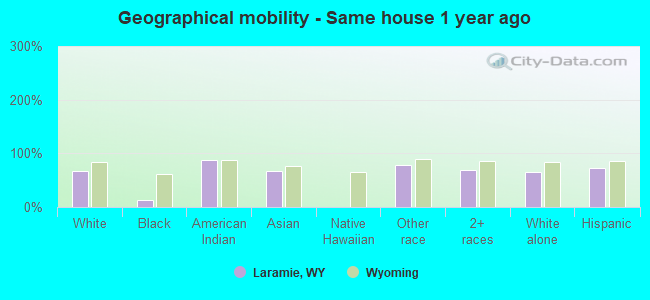
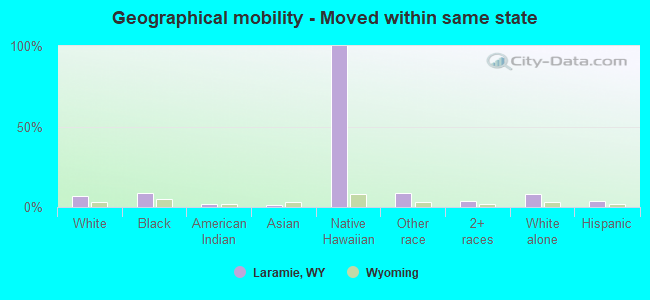
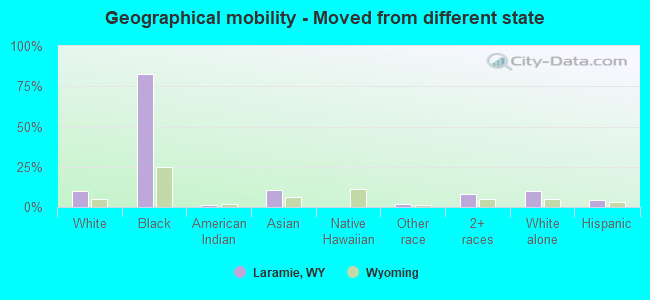
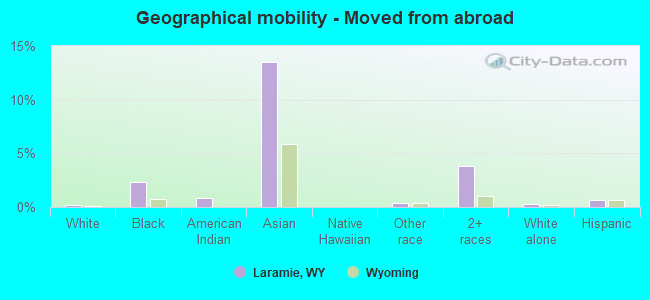
Geographical mobility in Laramie Same house 1 year ago 17,374 66.2% White (Caucasian)38 12.3% Black or African American110 87.5% American Indian / Alaska Native897 67.4% Asian525 78.1% Other race2,160 69.8% Two or more races16,424 66.1% White alone, not Hispanic / Latino2,558 72.8% Hispanic or LatinoMoved within same county 4,148 15.8% White / Caucasian55 17.6% Black or African American11 8.6% American Indian / Alaska Native120 9.0% Asian67 10.0% Other race326 10.5% Two or more races3,887 15.6% White alone, not Hispanic / Latino520 14.8% Hispanic or LatinoMoved within same state 1,957 7.5% White / Caucasian27 8.8% Black or African American3 2.3% American Indian / Alaska Native11 0.8% Asian43 100.0% Native Hawaiian / Pacific Islander61 9.1% Other race124 4.0% Two or more races2,008 8.1% White alone, not Hispanic / Latino136 3.9% Hispanic or LatinoMoved from different state 2,531 9.7% White / Caucasian256 82.7% Black or African American1 1.1% American Indian / Alaska Native140 10.5% Asian13 2.0% Other race248 8.0% Two or more races2,460 9.9% White alone, not Hispanic / Latino153 4.3% Hispanic or LatinoMoved from abroad 59 0.2% White7 2.3% Black or African American1 0.8% American Indian / Alaska Native180 13.5% Asian2 0.4% Other race119 3.9% Two or more races67 0.3% White alone, not Hispanic / Latino22 0.6% Hispanic or Latino
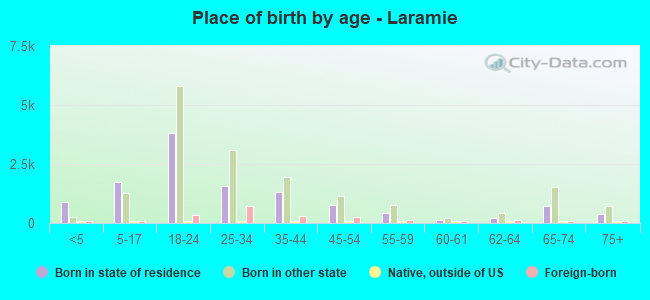
Children Nativity (place of birth) in Laramie
Children under 6 years - Living with two parents Both parents native 860 100.0% NativeBoth parents foreign-born 12 62.9% Native7 37.1% Foreign-bornOne native, one foreign-born parent 3 100.0% NativeChildren under 6 years - Living with one parent Native parent 319 100.0% NativeForeign-born parent 162 100.0% NativeChildren 6 to 17 years - Living with two parents Both parents native 1,472 99.8% Native4 0.2% Foreign-bornBoth parents foreign-born 220 98.1% Native4 1.9% Foreign-bornOne native, one foreign-born parent 227 84.2% Native43 15.8% Foreign-bornChildren 6 to 17 years - Living with one parent Native parent 795 100.0% NativeForeign-born parent 96 53.7% Native83 46.3% Foreign-born
Grandparents responsible for own grandchildren in Laramie
Grandparents (30 to 59 years) White / Caucasian 8 33.6% Responsible for grandchildren15 66.4% Not responsible for grandchildrenOther race 29 100.0% Not responsible for grandchildrenWhite alone, not Hispanic / Latino 10 39.3% Responsible for grandchildren16 60.7% Not responsible for grandchildrenHispanic or Latino 24 100.0% Not responsible for grandchildrenGrandparents (60 years and over) White / Caucasian 21 47.8% Responsible for grandchildren22 52.2% Not responsible for grandchildrenWhite alone, not Hispanic / Latino 22 49.4% Responsible for grandchildren22 50.6% Not responsible for grandchildren