Races in Lakeside, Virginia (VA) Detailed Stats
Data:
Races - White alone (%)
Races - White alone (% change since 2000)
Races - Black alone (%)
Races - Black alone (% change since 2000)
Races - American Indian alone (%)
Races - American Indian alone (% change since 2000)
Races - Asian alone (%)
Races - Asian alone (% change since 2000)
Races - Hispanic (%)
Races - Hispanic (% change since 2000)
Races - Native Hawaiian and Other Pacific Islander alone (%)
Races - Native Hawaiian and Other Pacific Islander alone (% change since 2000)
Races - Two or more races(%)
Races - Two or more races(% change since 2000)
Races - Other race alone (%)
Races - Other race alone (% change since 2000)
Racial diversity
Place of birth - Born in state of residence (%)
Place of birth - Born in state of residence (%) - White
Place of birth - Born in state of residence (%) - Black or African American
Place of birth - Born in state of residence (%) - Asian
Place of birth - Born in state of residence (%) - Hispanic or Latino
Place of birth - Born in state of residence (%) - American Indian and Alaska Native
Place of birth - Born in state of residence (%) - Multirace
Place of birth - Born in state of residence (%) - Other Race
Place of birth - Born in other state (%)
Place of birth - Born in other state (%) - White
Place of birth - Born in other state (%) - Black or African American
Place of birth - Born in other state (%) - Asian
Place of birth - Born in other state (%) - Hispanic or Latino
Place of birth - Born in other state (%) - American Indian and Alaska Native
Place of birth - Born in other state (%) - Multirace
Place of birth - Born in other state (%) - Other Race
Place of birth - Native, outside of US (%)
Place of birth - Native, outside of US (%) - White
Place of birth - Native, outside of US (%) - Black or African American
Place of birth - Native, outside of US (%) - Asian
Place of birth - Native, outside of US (%) - Hispanic or Latino
Place of birth - Native, outside of US (%) - American Indian and Alaska Native
Place of birth - Native, outside of US (%) - Multirace
Place of birth - Native, outside of US (%) - Other Race
Place of birth - Foreign born (%)
Place of birth - Foreign born (%) - White
Place of birth - Foreign born (%) - Black or African American
Place of birth - Foreign born (%) - Asian
Place of birth - Foreign born (%) - Hispanic or Latino
Place of birth - Foreign born (%) - American Indian and Alaska Native
Place of birth - Foreign born (%) - Multirace
Place of birth - Foreign born (%) - Other Race
Residents speaking English at home (%)
Residents speaking English at home - Born in the United States (%)
Residents speaking English at home - Native, born elsewhere (%)
Residents speaking English at home - Foreign born (%)
Residents speaking Spanish at home (%)
Residents speaking Spanish at home - Born in the United States (%)
Residents speaking Spanish at home - Native, born elsewhere (%)
Residents speaking Spanish at home - Foreign born (%)
Residents speaking other language at home (%)
Residents speaking other language at home - Born in the United States (%)
Residents speaking other language at home - Native, born elsewhere (%)
Residents speaking other language at home - Foreign born (%)
Marital status - Never married (%)
Marital status - Now married (%)
Marital status - Separated (%)
Marital status - Widowed (%)
Marital status - Divorced (%)
Ancestries Reported - Arab (%)
Ancestries Reported - Czech (%)
Ancestries Reported - Danish (%)
Ancestries Reported - Dutch (%)
Ancestries Reported - English (%)
Ancestries Reported - French (%)
Ancestries Reported - French Canadian (%)
Ancestries Reported - German (%)
Ancestries Reported - Greek (%)
Ancestries Reported - Hungarian (%)
Ancestries Reported - Irish (%)
Ancestries Reported - Italian (%)
Ancestries Reported - Lithuanian (%)
Ancestries Reported - Norwegian (%)
Ancestries Reported - Polish (%)
Ancestries Reported - Portuguese (%)
Ancestries Reported - Russian (%)
Ancestries Reported - Scotch-Irish (%)
Ancestries Reported - Scottish (%)
Ancestries Reported - Slovak (%)
Ancestries Reported - Subsaharan African (%)
Ancestries Reported - Swedish (%)
Ancestries Reported - Swiss (%)
Ancestries Reported - Ukrainian (%)
Ancestries Reported - United States (%)
Ancestries Reported - Welsh (%)
Ancestries Reported - West Indian (%)
Ancestries Reported - Other (%)
Geographical mobility - Same house 1 year ago (%)
Geographical mobility - Same house 1 year ago (%) - White
Geographical mobility - Same house 1 year ago (%) - Black or African American
Geographical mobility - Same house 1 year ago (%) - Asian
Geographical mobility - Same house 1 year ago (%) - Hispanic or Latino
Geographical mobility - Same house 1 year ago (%) - American Indian and Alaska Native
Geographical mobility - Same house 1 year ago (%) - Multirace
Geographical mobility - Same house 1 year ago (%) - Other Race
Geographical mobility - Moved within same county (%)
Geographical mobility - Moved within same county (%) - White
Geographical mobility - Moved within same county (%) - Black or African American
Geographical mobility - Moved within same county (%) - Asian
Geographical mobility - Moved within same county (%) - Hispanic or Latino
Geographical mobility - Moved within same county (%) - American Indian and Alaska Native
Geographical mobility - Moved within same county (%) - Multirace
Geographical mobility - Moved within same county (%) - Other Race
Geographical mobility - Moved from different county within same state (%)
Geographical mobility - Moved from different county within same state (%) - White
Geographical mobility - Moved from different county within same state (%) - Black or African American
Geographical mobility - Moved from different county within same state (%) - Asian
Geographical mobility - Moved from different county within same state (%) - Hispanic or Latino
Geographical mobility - Moved from different county within same state (%) - American Indian and Alaska Native
Geographical mobility - Moved from different county within same state (%) - Multirace
Geographical mobility - Moved from different county within same state (%) - Other Race
Geographical mobility - Moved from different state (%)
Geographical mobility - Moved from different state (%) - White
Geographical mobility - Moved from different state (%) - Black or African American
Geographical mobility - Moved from different state (%) - Asian
Geographical mobility - Moved from different state (%) - Hispanic or Latino
Geographical mobility - Moved from different state (%) - American Indian and Alaska Native
Geographical mobility - Moved from different state (%) - Multirace
Geographical mobility - Moved from different state (%) - Other Race
Geographical mobility - Moved from abroad (%)
Geographical mobility - Moved from abroad (%) - White
Geographical mobility - Moved from abroad (%) - Black or African American
Geographical mobility - Moved from abroad (%) - Asian
Geographical mobility - Moved from abroad (%) - Hispanic or Latino
Geographical mobility - Moved from abroad (%) - American Indian and Alaska Native
Geographical mobility - Moved from abroad (%) - Multirace
Geographical mobility - Moved from abroad (%) - Other Race
Place of birth for the foreign-born population - Ireland (%)
Place of birth for the foreign-born population - Denmark (%)
Place of birth for the foreign-born population - Norway (%)
Place of birth for the foreign-born population - Sweden (%)
Place of birth for the foreign-born population - United Kingdom (%)
Place of birth for the foreign-born population - England (%)
Place of birth for the foreign-born population - Scotland (%)
Place of birth for the foreign-born population - Other Northern Europe (%)
Place of birth for the foreign-born population - Austria (%)
Place of birth for the foreign-born population - Belgium (%)
Place of birth for the foreign-born population - France (%)
Place of birth for the foreign-born population - Germany (%)
Place of birth for the foreign-born population - Netherlands (%)
Place of birth for the foreign-born population - Switzerland (%)
Place of birth for the foreign-born population - Other Western Europe (%)
Place of birth for the foreign-born population - Greece (%)
Place of birth for the foreign-born population - Italy (%)
Place of birth for the foreign-born population - Portugal (%)
Place of birth for the foreign-born population - Spain (%)
Place of birth for the foreign-born population - Other Southern Europe (%)
Place of birth for the foreign-born population - Albania (%)
Place of birth for the foreign-born population - Belarus (%)
Place of birth for the foreign-born population - Bosnia and Herzegovina (%)
Place of birth for the foreign-born population - Bulgaria (%)
Place of birth for the foreign-born population - Croatia (%)
Place of birth for the foreign-born population - Czechoslovakia (%)
Place of birth for the foreign-born population - Hungary (%)
Place of birth for the foreign-born population - Latvia (%)
Place of birth for the foreign-born population - Lithuania (%)
Place of birth for the foreign-born population - North Macedonia (Macedonia) (%)
Place of birth for the foreign-born population - Moldova (%)
Place of birth for the foreign-born population - Poland (%)
Place of birth for the foreign-born population - Romania (%)
Place of birth for the foreign-born population - Russia (%)
Place of birth for the foreign-born population - Serbia (%)
Place of birth for the foreign-born population - Ukraine (%)
Place of birth for the foreign-born population - Other Eastern Europe (%)
Place of birth for the foreign-born population - China (%)
Place of birth for the foreign-born population - Hong Kong (%)
Place of birth for the foreign-born population - Taiwan (%)
Place of birth for the foreign-born population - Japan (%)
Place of birth for the foreign-born population - Korea (%)
Place of birth for the foreign-born population - Other Eastern Asia (%)
Place of birth for the foreign-born population - Afghanistan (%)
Place of birth for the foreign-born population - Bangladesh (%)
Place of birth for the foreign-born population - India (%)
Place of birth for the foreign-born population - Iran (%)
Place of birth for the foreign-born population - Kazakhstan (%)
Place of birth for the foreign-born population - Nepal (%)
Place of birth for the foreign-born population - Pakistan (%)
Place of birth for the foreign-born population - Sri Lanka (%)
Place of birth for the foreign-born population - Uzbekistan (%)
Place of birth for the foreign-born population - Other South Central Asia (%)
Place of birth for the foreign-born population - Burma (%)
Place of birth for the foreign-born population - Cambodia (%)
Place of birth for the foreign-born population - Indonesia (%)
Place of birth for the foreign-born population - Laos (%)
Place of birth for the foreign-born population - Malaysia (%)
Place of birth for the foreign-born population - Philippines (%)
Place of birth for the foreign-born population - Singapore (%)
Place of birth for the foreign-born population - Thailand (%)
Place of birth for the foreign-born population - Vietnam (%)
Place of birth for the foreign-born population - Other South Eastern Asia (%)
Place of birth for the foreign-born population - Armenia (%)
Place of birth for the foreign-born population - Iraq (%)
Place of birth for the foreign-born population - Israel (%)
Place of birth for the foreign-born population - Jordan (%)
Place of birth for the foreign-born population - Kuwait (%)
Place of birth for the foreign-born population - Lebanon (%)
Place of birth for the foreign-born population - Saudi Arabia (%)
Place of birth for the foreign-born population - Syria (%)
Place of birth for the foreign-born population - Turkey (%)
Place of birth for the foreign-born population - Yemen (%)
Place of birth for the foreign-born population - Other Western Asia (%)
Place of birth for the foreign-born population - Eritrea (%)
Place of birth for the foreign-born population - Ethiopia (%)
Place of birth for the foreign-born population - Kenya (%)
Place of birth for the foreign-born population - Somalia (%)
Place of birth for the foreign-born population - Uganda (%)
Place of birth for the foreign-born population - Zimbabwe (%)
Place of birth for the foreign-born population - Other Eastern Africa (%)
Place of birth for the foreign-born population - Cameroon (%)
Place of birth for the foreign-born population - Congo (%)
Place of birth for the foreign-born population - Democratic Republic of Congo (Zaire) (%)
Place of birth for the foreign-born population - Other Middle Africa (%)
Place of birth for the foreign-born population - Egypt (%)
Place of birth for the foreign-born population - Morocco (%)
Place of birth for the foreign-born population - Sudan (%)
Place of birth for the foreign-born population - Other Northern Africa (%)
Place of birth for the foreign-born population - South Africa (%)
Place of birth for the foreign-born population - Other Southern Africa (%)
Place of birth for the foreign-born population - Cabo Verde (%)
Place of birth for the foreign-born population - Ghana (%)
Place of birth for the foreign-born population - Liberia (%)
Place of birth for the foreign-born population - Nigeria (%)
Place of birth for the foreign-born population - Senegal (%)
Place of birth for the foreign-born population - Sierra Leone (%)
Place of birth for the foreign-born population - Other Western Africa (%)
Place of birth for the foreign-born population - Australia (%)
Place of birth for the foreign-born population - New Zealand (%)
Place of birth for the foreign-born population - Fiji (%)
Place of birth for the foreign-born population - Micronesia (%)
Place of birth for the foreign-born population - Bahamas (%)
Place of birth for the foreign-born population - Barbados (%)
Place of birth for the foreign-born population - Cuba (%)
Place of birth for the foreign-born population - Dominica (%)
Place of birth for the foreign-born population - Dominican Republic (%)
Place of birth for the foreign-born population - Grenada (%)
Place of birth for the foreign-born population - Haiti (%)
Place of birth for the foreign-born population - Jamaica (%)
Place of birth for the foreign-born population - St. Vincent and the Grenadines (%)
Place of birth for the foreign-born population - Trinidad and Tobago (%)
Place of birth for the foreign-born population - West Indies (%)
Place of birth for the foreign-born population - Other Caribbean (%)
Place of birth for the foreign-born population - Belize (%)
Place of birth for the foreign-born population - Costa Rica (%)
Place of birth for the foreign-born population - El Salvador (%)
Place of birth for the foreign-born population - Guatemala (%)
Place of birth for the foreign-born population - Honduras (%)
Place of birth for the foreign-born population - Mexico (%)
Place of birth for the foreign-born population - Nicaragua (%)
Place of birth for the foreign-born population - Panama (%)
Place of birth for the foreign-born population - Other Central America (%)
Place of birth for the foreign-born population - Argentina (%)
Place of birth for the foreign-born population - Bolivia (%)
Place of birth for the foreign-born population - Brazil (%)
Place of birth for the foreign-born population - Chile (%)
Place of birth for the foreign-born population - Colombia (%)
Place of birth for the foreign-born population - Ecuador (%)
Place of birth for the foreign-born population - Guyana (%)
Place of birth for the foreign-born population - Peru (%)
Place of birth for the foreign-born population - Uruguay (%)
Place of birth for the foreign-born population - Venezuela (%)
Place of birth for the foreign-born population - Other South America (%)
Place of birth for the foreign-born population - Canada (%)
Place of birth for the foreign-born population - Other Northern America (%)
Place of birth for the foreign-born population - Other (%)
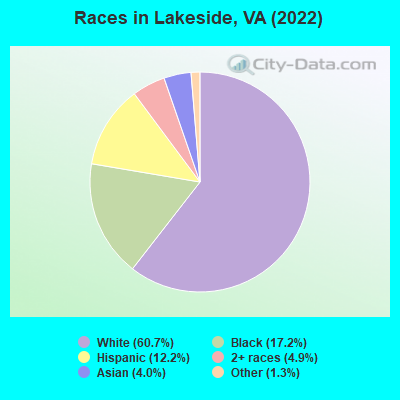
According to 2022 data, the most numerous races in Lakeside, VA are White alone (7,379 residents), Black alone (2,085 residents), and Hispanic (1,486 residents). 87.5% of Lakeside residents speak English at home. 11.9% of Lakeside, VA residents are foreign-born (7.3% born in Latin America, 3.0% born in Asia), which is about the same as the foreign-born rate of 12.0% across the entire state of Virginia.
Race distribution in Lakeside
2000 2022
4,965,637 70.2% White alone 1,376,378 19.4% Black alone 329,540 4.7% Hispanic 259,277 3.7% Asian alone 114,022 1.6% Two or more races 18,596 0.3% American Indian alone 11,685 0.2% Other race alone 3,380 0.05% Native Hawaiian and Other
5,095,130 58.7% White alone 1,594,785 18.4% Black alone 905,750 10.4% Hispanic 602,881 6.9% Asian alone 406,047 4.7% Two or more races 60,419 0.7% Other race alone 11,738 0.1% American Indian alone 6,869 0.08% Native Hawaiian and Other
Income and house value in Lakeside Median household income in 2022 $72,864 White non-Hispanic householders$35,448 Black householders$82,997 Asian householders$42,513 Two or more races householders$67,882 Hispanic or Latino race householdersMedian 2022 house value $281,399 White Non-Hispanic householders$310,167 Black or African American householders$248,001 American Indian or Alaska Native householders $388,535 Asian householders$281,068 Some other race householders$399,448 Two or more races householders$290,327 Hispanic or Latino householders
Median age by race in Lakeside
43.9 Median age for White residents46.3 42.5 30.5 Median age for Black or African American residents15.7 34.0 -1,068,627,449.9 Median age for American Indian / Alaska Native residents-402,222,221.8 -687,861,271.0 40.9 Median age for Asian residents21.0 41.6 -348,441,926.0 Median age for Native Hawaiian / Pacific Islander residents-541,531,822.5 -714,150,046.8 34.5 Median age for Other race residents34.7 34.6 24.6 Median age for Two or more races residents23.8 22.7 44.4 Median age for White alone residents46.2 43.2 35.4 Median age for Hispanic or Latino residents37.3 38.0
Owner/renter occupied households by race in Lakeside
House owners and renters - White residents 2,783 71.2% Owner occupied1,127 28.8% Renter occupiedHouse owners and renters - Black or African American residents 197 24.1% Owner occupied622 75.9% Renter occupiedHouse owners and renters - Asian residents 109 64.9% Owner occupied59 35.1% Renter occupiedHouse owners and renters - Other race residents 117 63.3% Owner occupied68 36.7% Renter occupiedHouse owners and renters - Two or more races residents 210 50.7% Owner occupied205 49.3% Renter occupiedHouse owners and renters - White alone residents 2,658 72.3% Owner occupied1,016 27.7% Renter occupiedHouse owners and renters - Hispanic or Latino residents 312 47.5% Owner occupied345 52.5% Renter occupied
Language usage in Lakeside
English speakers - Total 87.5% of residents of Lakeside speak English at home.
8.8% of residents speak Spanish at home 633 61.8% Speak English very well391 38.2% Speak English less than very well3.2% of residents speak other language at home 236 62.8% Speak English very well140 37.2% Speak English less than very well
English speakers - Born in the United States 93.3% of residents of Lakeside speak English at home.
6.1% of residents speak Spanish at home 178 96.2% Speak English very well7 3.8% Speak English less than very well1.7% of residents speak other language at home 53 100.0% Speak English very well
English speakers - Native, born elsewhere 73.7% of residents of Lakeside speak English at home.
16.6% of residents speak Spanish at home 53 100.0% Speak English very well
English speakers - Foreign-born 40.2% of residents of Lakeside speak English at home.
43.2% of residents speak Spanish at home 236 39.7% Speak English very well359 60.3% Speak English less than very well16.4% of residents speak other language at home 129 57.1% Speak English very well97 42.9% Speak English less than very well
White (Caucasian) - Speak only English Native:
96.1% (6,902)Foreign-born:
52.0% (118)
White (Caucasian) - Speak another language Native:
3.5% (250)Foreign-born:
49.7% (113)
Black or African American - Speak only English Native:
92.1% (1,791)Foreign-born:
29.7% (85)
Black or African American - Speak another language Native:
8.8% (172)Foreign-born:
70.9% (203)
Asian - Speak only English Native:
77.8% (219)Foreign-born:
61.3% (139)
Asian - Speak another language Native:
27.6% (78)Foreign-born:
55.2% (125)
Other race - Speak only English Native:
56.8% (97)Foreign-born:
10.4% (40)
Other race - Speak another language Native:
42.7% (73)Foreign-born:
83.7% (325)
Two or more races - Speak only English Native:
98.4% (670)Foreign-born:
39.8% (143)
Two or more races - Speak another language Native:
2.1% (14)Foreign-born:
60.4% (217)
White alone - Speak only English Native:
98.2% (6,758)Foreign-born:
65.1% (129)
White alone - Speak another language Native:
1.7% (120)Foreign-born:
35.4% (70)
Hispanic or Latino - Speak only English Native:
41.5% (260)Foreign-born:
19.1% (146)
Hispanic or Latino - Speak another language Native:
55.4% (346)Foreign-born:
77.8% (594)
Foreign-born residents in Lakeside 1,445 residents are foreign born (7.3% Latin America , 3.0% Asia ).
This city:
11.9%Virginia:
12.6%
Marital status for residents in Lakeside Marital status - White (Caucasian) population 15 years and over
Males 30.3% Never married50.9% Now married2.0% Separated2.1% Widowed14.7% DivorcedFemales 25.9% Never married46.1% Now married1.5% Separated7.0% Widowed19.5% DivorcedWomen who gave birth in the past 12 months Now married:
100.0% (106)Unmarried:
0.0% (0)
Women who did not give birth in the past 12 months Now married:
49.7% (1,027)Unmarried:
50.3% (1,037)
Marital status - Black or African American population 15 years and over
Males 63.1% Never married30.5% Now married2.9% Separated0.5% Widowed2.9% DivorcedFemales 62.4% Never married15.9% Now married6.2% Separated2.4% Widowed13.1% DivorcedWomen who gave birth in the past 12 months Now married:
100.0% (21)Unmarried:
0.0% (0)
Women who did not give birth in the past 12 months Now married:
13.6% (79)Unmarried:
86.4% (499)
Marital status - Asian population 15 years and over
Males 39.3% Never married60.0% Now married0.0% Separated0.7% Widowed0.0% DivorcedFemales 14.4% Never married55.6% Now married0.0% Separated20.6% Widowed9.4% DivorcedWomen who did not give birth in the past 12 months Now married:
60.3% (82)Unmarried:
39.7% (54)
Marital status - Other race population 15 years and over
Males 20.0% Never married55.7% Now married24.3% Separated0.0% Widowed0.0% DivorcedFemales 35.5% Never married56.4% Now married8.1% Separated0.0% Widowed0.0% DivorcedWomen who gave birth in the past 12 months Now married:
100.0% (16)Unmarried:
0.0% (0)
Women who did not give birth in the past 12 months Now married:
65.7% (85)Unmarried:
34.3% (44)
Marital status - Two or more races population 15 years and over
Males 78.7% Never married13.6% Now married5.4% Separated0.0% Widowed2.2% DivorcedFemales 53.5% Never married36.6% Now married2.5% Separated0.0% Widowed7.4% DivorcedWomen who gave birth in the past 12 months Now married:
0.0% (0)Unmarried:
100.0% (15)
Women who did not give birth in the past 12 months Now married:
19.8% (32)Unmarried:
80.2% (130)
Marital status - White alone, not Hispanic / Latino population 15 years and over
Males 28.0% Never married53.1% Now married2.2% Separated2.3% Widowed14.5% DivorcedFemales 25.4% Never married46.5% Now married1.2% Separated7.3% Widowed19.6% DivorcedWomen who gave birth in the past 12 months Now married:
100.0% (108)Unmarried:
0.0% (0)
Women who did not give birth in the past 12 months Now married:
50.8% (1,019)Unmarried:
49.2% (987)
Marital status - Hispanic or Latino population 15 years and over
Males 61.3% Never married28.9% Now married3.8% Separated0.0% Widowed6.0% DivorcedFemales 38.6% Never married43.6% Now married6.7% Separated0.0% Widowed11.1% DivorcedWomen who gave birth in the past 12 months Now married:
100.0% (13)Unmarried:
0.0% (0)
Women who did not give birth in the past 12 months Now married:
42.5% (92)Unmarried:
57.5% (124)
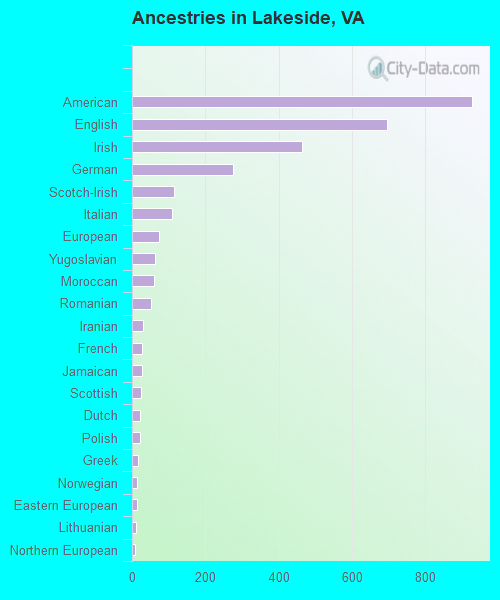
Ancestries in Lakeside
928 15.2% American697 11.4% English465 7.6% Irish275 4.5% German116 1.9% Scotch-Irish109 1.8% Italian73 1.2% European64 1.0% Yugoslavian61 1.0% Moroccan51 0.8% Romanian31 0.5% Iranian27 0.4% French27 0.4% Jamaican25 0.4% Scottish23 0.4% Dutch21 0.3% Polish16 0.3% Greek15 0.2% Norwegian14 0.2% Eastern European10 0.2% Lithuanian9 0.1% Northern European8 0.1% Croatian8 0.1% Ukrainian6 0.10% Portuguese5 0.08% Austrian5 0.08% French Canadian5 0.08% Swedish2 0.03% Canadian
Children Nativity (place of birth) in Lakeside
Children under 6 years - Living with two parents Both parents native 327 98.4% Native5 1.6% Foreign-bornBoth parents foreign-born 58 79.4% Native15 20.6% Foreign-bornOne native, one foreign-born parent 59 100.0% NativeChildren under 6 years - Living with one parent Native parent 130 100.0% NativeForeign-born parent 13 100.0% NativeChildren 6 to 17 years - Living with two parents Both parents native 378 100.0% NativeBoth parents foreign-born 162 91.0% Native16 9.0% Foreign-bornOne native, one foreign-born parent 63 100.0% NativeChildren 6 to 17 years - Living with one parent Native parent 826 100.0% NativeForeign-born parent 99 54.8% Native81 45.2% Foreign-born