Races in Lake Worth, Florida (FL) Detailed Stats
Data:
Races - White alone (%)
Races - White alone (% change since 2000)
Races - Black alone (%)
Races - Black alone (% change since 2000)
Races - American Indian alone (%)
Races - American Indian alone (% change since 2000)
Races - Asian alone (%)
Races - Asian alone (% change since 2000)
Races - Hispanic (%)
Races - Hispanic (% change since 2000)
Races - Native Hawaiian and Other Pacific Islander alone (%)
Races - Native Hawaiian and Other Pacific Islander alone (% change since 2000)
Races - Two or more races(%)
Races - Two or more races(% change since 2000)
Races - Other race alone (%)
Races - Other race alone (% change since 2000)
Racial diversity
Place of birth - Born in state of residence (%)
Place of birth - Born in state of residence (%) - White
Place of birth - Born in state of residence (%) - Black or African American
Place of birth - Born in state of residence (%) - Asian
Place of birth - Born in state of residence (%) - Hispanic or Latino
Place of birth - Born in state of residence (%) - American Indian and Alaska Native
Place of birth - Born in state of residence (%) - Multirace
Place of birth - Born in state of residence (%) - Other Race
Place of birth - Born in other state (%)
Place of birth - Born in other state (%) - White
Place of birth - Born in other state (%) - Black or African American
Place of birth - Born in other state (%) - Asian
Place of birth - Born in other state (%) - Hispanic or Latino
Place of birth - Born in other state (%) - American Indian and Alaska Native
Place of birth - Born in other state (%) - Multirace
Place of birth - Born in other state (%) - Other Race
Place of birth - Native, outside of US (%)
Place of birth - Native, outside of US (%) - White
Place of birth - Native, outside of US (%) - Black or African American
Place of birth - Native, outside of US (%) - Asian
Place of birth - Native, outside of US (%) - Hispanic or Latino
Place of birth - Native, outside of US (%) - American Indian and Alaska Native
Place of birth - Native, outside of US (%) - Multirace
Place of birth - Native, outside of US (%) - Other Race
Place of birth - Foreign born (%)
Place of birth - Foreign born (%) - White
Place of birth - Foreign born (%) - Black or African American
Place of birth - Foreign born (%) - Asian
Place of birth - Foreign born (%) - Hispanic or Latino
Place of birth - Foreign born (%) - American Indian and Alaska Native
Place of birth - Foreign born (%) - Multirace
Place of birth - Foreign born (%) - Other Race
Residents speaking English at home (%)
Residents speaking English at home - Born in the United States (%)
Residents speaking English at home - Native, born elsewhere (%)
Residents speaking English at home - Foreign born (%)
Residents speaking Spanish at home (%)
Residents speaking Spanish at home - Born in the United States (%)
Residents speaking Spanish at home - Native, born elsewhere (%)
Residents speaking Spanish at home - Foreign born (%)
Residents speaking other language at home (%)
Residents speaking other language at home - Born in the United States (%)
Residents speaking other language at home - Native, born elsewhere (%)
Residents speaking other language at home - Foreign born (%)
Marital status - Never married (%)
Marital status - Now married (%)
Marital status - Separated (%)
Marital status - Widowed (%)
Marital status - Divorced (%)
Ancestries Reported - Arab (%)
Ancestries Reported - Czech (%)
Ancestries Reported - Danish (%)
Ancestries Reported - Dutch (%)
Ancestries Reported - English (%)
Ancestries Reported - French (%)
Ancestries Reported - French Canadian (%)
Ancestries Reported - German (%)
Ancestries Reported - Greek (%)
Ancestries Reported - Hungarian (%)
Ancestries Reported - Irish (%)
Ancestries Reported - Italian (%)
Ancestries Reported - Lithuanian (%)
Ancestries Reported - Norwegian (%)
Ancestries Reported - Polish (%)
Ancestries Reported - Portuguese (%)
Ancestries Reported - Russian (%)
Ancestries Reported - Scotch-Irish (%)
Ancestries Reported - Scottish (%)
Ancestries Reported - Slovak (%)
Ancestries Reported - Subsaharan African (%)
Ancestries Reported - Swedish (%)
Ancestries Reported - Swiss (%)
Ancestries Reported - Ukrainian (%)
Ancestries Reported - United States (%)
Ancestries Reported - Welsh (%)
Ancestries Reported - West Indian (%)
Ancestries Reported - Other (%)
Geographical mobility - Same house 1 year ago (%)
Geographical mobility - Same house 1 year ago (%) - White
Geographical mobility - Same house 1 year ago (%) - Black or African American
Geographical mobility - Same house 1 year ago (%) - Asian
Geographical mobility - Same house 1 year ago (%) - Hispanic or Latino
Geographical mobility - Same house 1 year ago (%) - American Indian and Alaska Native
Geographical mobility - Same house 1 year ago (%) - Multirace
Geographical mobility - Same house 1 year ago (%) - Other Race
Geographical mobility - Moved within same county (%)
Geographical mobility - Moved within same county (%) - White
Geographical mobility - Moved within same county (%) - Black or African American
Geographical mobility - Moved within same county (%) - Asian
Geographical mobility - Moved within same county (%) - Hispanic or Latino
Geographical mobility - Moved within same county (%) - American Indian and Alaska Native
Geographical mobility - Moved within same county (%) - Multirace
Geographical mobility - Moved within same county (%) - Other Race
Geographical mobility - Moved from different county within same state (%)
Geographical mobility - Moved from different county within same state (%) - White
Geographical mobility - Moved from different county within same state (%) - Black or African American
Geographical mobility - Moved from different county within same state (%) - Asian
Geographical mobility - Moved from different county within same state (%) - Hispanic or Latino
Geographical mobility - Moved from different county within same state (%) - American Indian and Alaska Native
Geographical mobility - Moved from different county within same state (%) - Multirace
Geographical mobility - Moved from different county within same state (%) - Other Race
Geographical mobility - Moved from different state (%)
Geographical mobility - Moved from different state (%) - White
Geographical mobility - Moved from different state (%) - Black or African American
Geographical mobility - Moved from different state (%) - Asian
Geographical mobility - Moved from different state (%) - Hispanic or Latino
Geographical mobility - Moved from different state (%) - American Indian and Alaska Native
Geographical mobility - Moved from different state (%) - Multirace
Geographical mobility - Moved from different state (%) - Other Race
Geographical mobility - Moved from abroad (%)
Geographical mobility - Moved from abroad (%) - White
Geographical mobility - Moved from abroad (%) - Black or African American
Geographical mobility - Moved from abroad (%) - Asian
Geographical mobility - Moved from abroad (%) - Hispanic or Latino
Geographical mobility - Moved from abroad (%) - American Indian and Alaska Native
Geographical mobility - Moved from abroad (%) - Multirace
Geographical mobility - Moved from abroad (%) - Other Race
Place of birth for the foreign-born population - Ireland (%)
Place of birth for the foreign-born population - Denmark (%)
Place of birth for the foreign-born population - Norway (%)
Place of birth for the foreign-born population - Sweden (%)
Place of birth for the foreign-born population - United Kingdom (%)
Place of birth for the foreign-born population - England (%)
Place of birth for the foreign-born population - Scotland (%)
Place of birth for the foreign-born population - Other Northern Europe (%)
Place of birth for the foreign-born population - Austria (%)
Place of birth for the foreign-born population - Belgium (%)
Place of birth for the foreign-born population - France (%)
Place of birth for the foreign-born population - Germany (%)
Place of birth for the foreign-born population - Netherlands (%)
Place of birth for the foreign-born population - Switzerland (%)
Place of birth for the foreign-born population - Other Western Europe (%)
Place of birth for the foreign-born population - Greece (%)
Place of birth for the foreign-born population - Italy (%)
Place of birth for the foreign-born population - Portugal (%)
Place of birth for the foreign-born population - Spain (%)
Place of birth for the foreign-born population - Other Southern Europe (%)
Place of birth for the foreign-born population - Albania (%)
Place of birth for the foreign-born population - Belarus (%)
Place of birth for the foreign-born population - Bosnia and Herzegovina (%)
Place of birth for the foreign-born population - Bulgaria (%)
Place of birth for the foreign-born population - Croatia (%)
Place of birth for the foreign-born population - Czechoslovakia (%)
Place of birth for the foreign-born population - Hungary (%)
Place of birth for the foreign-born population - Latvia (%)
Place of birth for the foreign-born population - Lithuania (%)
Place of birth for the foreign-born population - North Macedonia (Macedonia) (%)
Place of birth for the foreign-born population - Moldova (%)
Place of birth for the foreign-born population - Poland (%)
Place of birth for the foreign-born population - Romania (%)
Place of birth for the foreign-born population - Russia (%)
Place of birth for the foreign-born population - Serbia (%)
Place of birth for the foreign-born population - Ukraine (%)
Place of birth for the foreign-born population - Other Eastern Europe (%)
Place of birth for the foreign-born population - China (%)
Place of birth for the foreign-born population - Hong Kong (%)
Place of birth for the foreign-born population - Taiwan (%)
Place of birth for the foreign-born population - Japan (%)
Place of birth for the foreign-born population - Korea (%)
Place of birth for the foreign-born population - Other Eastern Asia (%)
Place of birth for the foreign-born population - Afghanistan (%)
Place of birth for the foreign-born population - Bangladesh (%)
Place of birth for the foreign-born population - India (%)
Place of birth for the foreign-born population - Iran (%)
Place of birth for the foreign-born population - Kazakhstan (%)
Place of birth for the foreign-born population - Nepal (%)
Place of birth for the foreign-born population - Pakistan (%)
Place of birth for the foreign-born population - Sri Lanka (%)
Place of birth for the foreign-born population - Uzbekistan (%)
Place of birth for the foreign-born population - Other South Central Asia (%)
Place of birth for the foreign-born population - Burma (%)
Place of birth for the foreign-born population - Cambodia (%)
Place of birth for the foreign-born population - Indonesia (%)
Place of birth for the foreign-born population - Laos (%)
Place of birth for the foreign-born population - Malaysia (%)
Place of birth for the foreign-born population - Philippines (%)
Place of birth for the foreign-born population - Singapore (%)
Place of birth for the foreign-born population - Thailand (%)
Place of birth for the foreign-born population - Vietnam (%)
Place of birth for the foreign-born population - Other South Eastern Asia (%)
Place of birth for the foreign-born population - Armenia (%)
Place of birth for the foreign-born population - Iraq (%)
Place of birth for the foreign-born population - Israel (%)
Place of birth for the foreign-born population - Jordan (%)
Place of birth for the foreign-born population - Kuwait (%)
Place of birth for the foreign-born population - Lebanon (%)
Place of birth for the foreign-born population - Saudi Arabia (%)
Place of birth for the foreign-born population - Syria (%)
Place of birth for the foreign-born population - Turkey (%)
Place of birth for the foreign-born population - Yemen (%)
Place of birth for the foreign-born population - Other Western Asia (%)
Place of birth for the foreign-born population - Eritrea (%)
Place of birth for the foreign-born population - Ethiopia (%)
Place of birth for the foreign-born population - Kenya (%)
Place of birth for the foreign-born population - Somalia (%)
Place of birth for the foreign-born population - Uganda (%)
Place of birth for the foreign-born population - Zimbabwe (%)
Place of birth for the foreign-born population - Other Eastern Africa (%)
Place of birth for the foreign-born population - Cameroon (%)
Place of birth for the foreign-born population - Congo (%)
Place of birth for the foreign-born population - Democratic Republic of Congo (Zaire) (%)
Place of birth for the foreign-born population - Other Middle Africa (%)
Place of birth for the foreign-born population - Egypt (%)
Place of birth for the foreign-born population - Morocco (%)
Place of birth for the foreign-born population - Sudan (%)
Place of birth for the foreign-born population - Other Northern Africa (%)
Place of birth for the foreign-born population - South Africa (%)
Place of birth for the foreign-born population - Other Southern Africa (%)
Place of birth for the foreign-born population - Cabo Verde (%)
Place of birth for the foreign-born population - Ghana (%)
Place of birth for the foreign-born population - Liberia (%)
Place of birth for the foreign-born population - Nigeria (%)
Place of birth for the foreign-born population - Senegal (%)
Place of birth for the foreign-born population - Sierra Leone (%)
Place of birth for the foreign-born population - Other Western Africa (%)
Place of birth for the foreign-born population - Australia (%)
Place of birth for the foreign-born population - New Zealand (%)
Place of birth for the foreign-born population - Fiji (%)
Place of birth for the foreign-born population - Micronesia (%)
Place of birth for the foreign-born population - Bahamas (%)
Place of birth for the foreign-born population - Barbados (%)
Place of birth for the foreign-born population - Cuba (%)
Place of birth for the foreign-born population - Dominica (%)
Place of birth for the foreign-born population - Dominican Republic (%)
Place of birth for the foreign-born population - Grenada (%)
Place of birth for the foreign-born population - Haiti (%)
Place of birth for the foreign-born population - Jamaica (%)
Place of birth for the foreign-born population - St. Vincent and the Grenadines (%)
Place of birth for the foreign-born population - Trinidad and Tobago (%)
Place of birth for the foreign-born population - West Indies (%)
Place of birth for the foreign-born population - Other Caribbean (%)
Place of birth for the foreign-born population - Belize (%)
Place of birth for the foreign-born population - Costa Rica (%)
Place of birth for the foreign-born population - El Salvador (%)
Place of birth for the foreign-born population - Guatemala (%)
Place of birth for the foreign-born population - Honduras (%)
Place of birth for the foreign-born population - Mexico (%)
Place of birth for the foreign-born population - Nicaragua (%)
Place of birth for the foreign-born population - Panama (%)
Place of birth for the foreign-born population - Other Central America (%)
Place of birth for the foreign-born population - Argentina (%)
Place of birth for the foreign-born population - Bolivia (%)
Place of birth for the foreign-born population - Brazil (%)
Place of birth for the foreign-born population - Chile (%)
Place of birth for the foreign-born population - Colombia (%)
Place of birth for the foreign-born population - Ecuador (%)
Place of birth for the foreign-born population - Guyana (%)
Place of birth for the foreign-born population - Peru (%)
Place of birth for the foreign-born population - Uruguay (%)
Place of birth for the foreign-born population - Venezuela (%)
Place of birth for the foreign-born population - Other South America (%)
Place of birth for the foreign-born population - Canada (%)
Place of birth for the foreign-born population - Other Northern America (%)
Place of birth for the foreign-born population - Other (%)
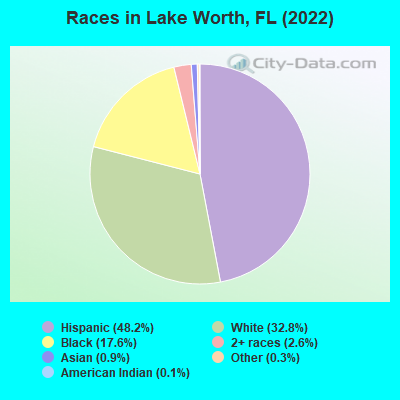
According to 2022 data, the most numerous races in Lake Worth, FL are White alone (13,188 residents), Hispanic (19,371 residents), and Black alone (7,059 residents). 44.6% of Lake Worth residents speak English at home. 38.1% of Lake Worth, FL residents are foreign-born (33.5% born in Latin America), which is 44.9% greater than the foreign-born rate of 21.0% across the entire state of Florida.
Race distribution in Lake Worth
2000 2022
10,458,509 65.4% White alone 2,682,715 16.8% Hispanic 2,264,268 14.2% Black alone 261,693 1.6% Asian alone 236,954 1.5% Two or more races 42,358 0.3% American Indian alone 28,994 0.2% Other race alone 6,887 0.04% Native Hawaiian and Other
11,309,403 50.8% White alone 6,025,039 27.1% Hispanic 3,241,015 14.6% Black alone 861,630 3.9% Two or more races 623,692 2.8% Asian alone 152,054 0.7% Other race alone 22,504 0.1% American Indian alone 9,486 0.04% Native Hawaiian and Other
Income and house value in Lake Worth Median household income in 2022 $67,684 White non-Hispanic householders$43,845 Black householders$37,766 American Indian and Alaska Native householders$124,916 Asian householders$58,378 Some other race householders$46,451 Two or more races householders$50,289 Hispanic or Latino race householdersMedian 2022 house value $334,326 White Non-Hispanic householders$266,314 Black or African American householders$328,976 American Indian or Alaska Native householders $429,847 Asian householders$277,013 Some other race householders$290,386 Two or more races householders$274,338 Hispanic or Latino householders
Median age by race in Lake Worth
40.5 Median age for White residents41.7 38.6 38.4 Median age for Black or African American residents41.6 35.7 28.4 Median age for American Indian / Alaska Native residents29.5 38.3 28.1 Median age for Asian residents38.6 27.0 37.0 Median age for Other race residents39.3 34.4 43.8 Median age for Two or more races residents44.4 42.1 54.2 Median age for White alone residents55.1 53.9 30.8 Median age for Hispanic or Latino residents32.8 27.5
Owner/renter occupied households by race in Lake Worth
House owners and renters - White residents 5,053 54.4% Owner occupied4,231 45.6% Renter occupiedHouse owners and renters - Black or African American residents 628 29.7% Owner occupied1,488 70.3% Renter occupiedHouse owners and renters - American Indian / Alaska Native residents 264 100.0% Renter occupiedHouse owners and renters - Asian residents 82 100.0% Owner occupiedHouse owners and renters - Other race residents 212 22.6% Owner occupied729 77.4% Renter occupiedHouse owners and renters - Two or more races residents 789 40.3% Owner occupied1,167 59.7% Renter occupiedHouse owners and renters - White alone residents 4,329 62.2% Owner occupied2,628 37.8% Renter occupiedHouse owners and renters - Hispanic or Latino residents 1,503 31.9% Owner occupied3,203 68.1% Renter occupied
Language usage in Lake Worth
English speakers - Total 44.6% of residents of Lake Worth speak English at home.
42.4% of residents speak Spanish at home 6,323 40.5% Speak English very well9,286 59.5% Speak English less than very well13.3% of residents speak other language at home 2,116 43.3% Speak English very well2,767 56.7% Speak English less than very well
English speakers - Born in the United States 85.3% of residents of Lake Worth speak English at home.
11.6% of residents speak Spanish at home 1,104 93.8% Speak English very well73 6.2% Speak English less than very well3.1% of residents speak other language at home 262 82.6% Speak English very well55 17.4% Speak English less than very well
English speakers - Native, born elsewhere 21.9% of residents of Lake Worth speak English at home.
64.4% of residents speak Spanish at home 287 50.3% Speak English very well284 49.7% Speak English less than very well12.4% of residents speak other language at home 110 100.0% Speak English very well
English speakers - Foreign-born 10.9% of residents of Lake Worth speak English at home.
64.5% of residents speak Spanish at home 1,594 16.0% Speak English very well8,357 84.0% Speak English less than very well23.1% of residents speak other language at home 1,000 28.1% Speak English very well2,557 71.9% Speak English less than very well
White (Caucasian) - Speak only English Native:
71.8% (10,925)Foreign-born:
8.5% (517)
White (Caucasian) - Speak another language Native:
22.1% (3,358)Foreign-born:
89.4% (5,462)
Black or African American - Speak only English Native:
70.5% (2,426)Foreign-born:
21.7% (698)
Black or African American - Speak another language Native:
31.3% (1,077)Foreign-born:
78.5% (2,523)
American Indian / Alaska Native - Speak only English Native:
51.1% (48)Foreign-born:
6.1% (50)
American Indian / Alaska Native - Speak another language Native:
69.8% (65)Foreign-born:
100.0% (814)
Asian - Speak only English Native:
66.1% (91)Foreign-born:
22.7% (45)
Asian - Speak another language Native:
33.3% (46)Foreign-born:
77.3% (152)
Other race - Speak only English Native:
35.7% (243)Foreign-born:
16.4% (453)
Other race - Speak another language Native:
64.7% (441)Foreign-born:
84.0% (2,319)
Two or more races - Speak only English Native:
53.6% (1,467)Foreign-born:
0.8% (38)
Two or more races - Speak another language Native:
48.6% (1,330)Foreign-born:
69.5% (3,384)
White alone - Speak only English Native:
91.7% (10,385)Foreign-born:
33.7% (505)
White alone - Speak another language Native:
8.0% (908)Foreign-born:
66.1% (990)
Hispanic or Latino - Speak only English Native:
17.9% (1,142)Foreign-born:
4.0% (444)
Hispanic or Latino - Speak another language Native:
76.4% (4,868)Foreign-born:
96.0% (10,760)
Foreign-born residents in Lake Worth 15,319 residents are foreign born (33.5% Latin America ).
This city:
38.1%Florida:
100.0%
Marital status for residents in Lake Worth Marital status - White (Caucasian) population 15 years and over
Males 43.7% Never married35.9% Now married2.6% Separated3.9% Widowed14.0% DivorcedFemales 35.0% Never married33.6% Now married3.2% Separated9.0% Widowed19.1% DivorcedWomen who gave birth in the past 12 months Now married:
47.3% (192)Unmarried:
52.7% (214)
Women who did not give birth in the past 12 months Now married:
34.8% (1,596)Unmarried:
65.2% (2,993)
Marital status - Black or African American population 15 years and over
Males 48.3% Never married33.9% Now married2.4% Separated0.6% Widowed15.0% DivorcedFemales 41.4% Never married34.8% Now married5.9% Separated7.1% Widowed10.7% DivorcedWomen who gave birth in the past 12 months Now married:
60.3% (46)Unmarried:
39.7% (30)
Women who did not give birth in the past 12 months Now married:
33.4% (455)Unmarried:
66.6% (907)
Marital status - American Indian / Alaska Native population 15 years and over
Males 30.8% Never married47.3% Now married5.3% Separated0.0% Widowed16.5% DivorcedFemales 27.7% Never married72.3% Now married0.0% Separated0.0% Widowed0.0% DivorcedWomen who did not give birth in the past 12 months Now married:
72.3% (185)Unmarried:
27.7% (71)
Marital status - Asian population 15 years and over
Males 0.0% Never married100.0% Now married0.0% Separated0.0% Widowed0.0% DivorcedFemales 44.3% Never married31.4% Now married0.0% Separated24.3% Widowed0.0% DivorcedWomen who did not give birth in the past 12 months Now married:
32.4% (23)Unmarried:
67.6% (48)
Marital status - Other race population 15 years and over
Males 81.8% Never married17.6% Now married0.0% Separated0.0% Widowed0.6% DivorcedFemales 72.4% Never married16.3% Now married1.4% Separated3.8% Widowed6.2% DivorcedWomen who gave birth in the past 12 months Now married:
17.1% (12)Unmarried:
82.9% (60)
Women who did not give birth in the past 12 months Now married:
17.7% (137)Unmarried:
82.3% (634)
Marital status - Two or more races population 15 years and over
Males 49.3% Never married33.2% Now married0.0% Separated0.0% Widowed17.5% DivorcedFemales 38.1% Never married37.7% Now married0.0% Separated1.6% Widowed22.6% DivorcedWomen who gave birth in the past 12 months Now married:
0.0% (0)Unmarried:
100.0% (68)
Women who did not give birth in the past 12 months Now married:
39.6% (549)Unmarried:
60.4% (838)
Marital status - White alone, not Hispanic / Latino population 15 years and over
Males 35.5% Never married36.6% Now married2.2% Separated5.9% Widowed19.7% DivorcedFemales 25.9% Never married31.5% Now married2.8% Separated13.7% Widowed26.1% DivorcedWomen who gave birth in the past 12 months Now married:
60.9% (136)Unmarried:
39.1% (88)
Women who did not give birth in the past 12 months Now married:
32.8% (754)Unmarried:
67.2% (1,547)
Marital status - Hispanic or Latino population 15 years and over
Males 56.9% Never married32.8% Now married2.5% Separated1.3% Widowed6.5% DivorcedFemales 49.3% Never married37.2% Now married3.3% Separated2.3% Widowed7.8% DivorcedWomen who gave birth in the past 12 months Now married:
32.2% (106)Unmarried:
67.8% (222)
Women who did not give birth in the past 12 months Now married:
37.2% (1,625)Unmarried:
62.8% (2,737)
Ancestries in Lake Worth
2,810 10.1% Haitian1,074 3.9% English902 3.2% Irish786 2.8% German775 2.8% American704 2.5% Italian635 2.3% African536 1.9% Jamaican280 1.0% European268 1.0% French206 0.7% Finnish190 0.7% Scottish152 0.5% Polish123 0.4% Scotch-Irish111 0.4% British80 0.3% Portuguese79 0.3% Canadian68 0.2% French Canadian54 0.2% Hungarian50 0.2% Swedish49 0.2% Norwegian45 0.2% Romanian40 0.1% Dutch39 0.1% Bulgarian37 0.1% Eastern European33 0.1% Russian31 0.1% Syrian30 0.1% Northern European30 0.1% Slovak29 0.1% Afghan29 0.1% Croatian29 0.1% West Indian24 0.09% British West Indian21 0.08% Bahamian20 0.07% Brazilian18 0.06% Zimbabwean16 0.06% Estonian16 0.06% Scandinavian14 0.05% Yugoslavian12 0.04% Ukrainian12 0.04% Maltese10 0.04% Austrian10 0.04% Egyptian10 0.04% Danish9 0.03% Lithuanian8 0.03% Belgian8 0.03% Greek8 0.03% Trinidadian and Tobagonian8 0.03% Latvian7 0.03% Czech7 0.03% Guyanese5 0.02% Swiss5 0.02% Belizean3 0.01% Czechoslovakian3 0.01% Cape Verdean2 0.01% Welsh
Geographical mobility in Lake Worth Same house 1 year ago 20,073 84.3% White (Caucasian)6,055 86.3% Black or African American641 95.6% American Indian / Alaska Native388 100.0% Asian3,319 95.9% Other race4,358 80.9% Two or more races11,109 84.3% White alone, not Hispanic / Latino15,144 84.7% Hispanic or LatinoMoved within same county 2,371 10.0% White / Caucasian662 9.4% Black or African American4 0.6% American Indian / Alaska Native126 3.6% Other race665 12.3% Two or more races1,221 9.3% White alone, not Hispanic / Latino1,962 11.0% Hispanic or LatinoMoved within same state 485 2.0% White / Caucasian188 2.7% Black or African American37 1.1% Other race25 0.5% Two or more races307 2.3% White alone, not Hispanic / Latino229 1.3% Hispanic or LatinoMoved from different state 489 2.1% White / Caucasian60 0.8% Black or African American7 1.8% Asian45 1.3% Other race468 3.5% White alone, not Hispanic / Latino128 0.7% Hispanic or LatinoMoved from abroad 182 0.8% White14 0.2% Black or African American24 3.6% American Indian / Alaska Native399 7.4% Two or more races28 0.2% White alone, not Hispanic / Latino325 1.8% Hispanic or Latino
Children Nativity (place of birth) in Lake Worth
Children under 6 years - Living with two parents Both parents native 236 99.9% Native0 0.1% Foreign-bornBoth parents foreign-born 804 97.8% Native18 2.2% Foreign-bornOne native, one foreign-born parent 324 100.0% NativeChildren under 6 years - Living with one parent Native parent 581 100.0% NativeForeign-born parent 568 70.9% Native234 29.1% Foreign-bornChildren 6 to 17 years - Living with two parents Both parents native 403 100.0% NativeBoth parents foreign-born 1,371 87.4% Native198 12.6% Foreign-bornOne native, one foreign-born parent 318 100.0% NativeChildren 6 to 17 years - Living with one parent Native parent 409 100.0% NativeForeign-born parent 1,877 59.8% Native1,264 40.2% Foreign-born
Grandparents responsible for own grandchildren in Lake Worth
Grandparents (30 to 59 years) White / Caucasian 19 11.5% Responsible for grandchildren145 88.5% Not responsible for grandchildrenBlack or African American 15 10.7% Responsible for grandchildren130 89.3% Not responsible for grandchildrenAmerican Indian / Alaska Native 43 100.0% Not responsible for grandchildrenAsian 1 100.0% Not responsible for grandchildrenWhite alone, not Hispanic / Latino 3 17.4% Responsible for grandchildren14 82.6% Not responsible for grandchildrenHispanic or Latino 42 13.8% Responsible for grandchildren263 86.2% Not responsible for grandchildrenGrandparents (60 years and over) White / Caucasian 26 20.0% Responsible for grandchildren104 80.0% Not responsible for grandchildrenBlack or African American 260 100.0% Not responsible for grandchildrenAsian 1 100.0% Not responsible for grandchildrenWhite alone, not Hispanic / Latino 13 27.8% Responsible for grandchildren35 72.2% Not responsible for grandchildrenHispanic or Latino 17 13.7% Responsible for grandchildren106 86.3% Not responsible for grandchildren