Races in Lake Park, Florida (FL) Detailed Stats
Data:
Races - White alone (%)
Races - White alone (% change since 2000)
Races - Black alone (%)
Races - Black alone (% change since 2000)
Races - American Indian alone (%)
Races - American Indian alone (% change since 2000)
Races - Asian alone (%)
Races - Asian alone (% change since 2000)
Races - Hispanic (%)
Races - Hispanic (% change since 2000)
Races - Native Hawaiian and Other Pacific Islander alone (%)
Races - Native Hawaiian and Other Pacific Islander alone (% change since 2000)
Races - Two or more races(%)
Races - Two or more races(% change since 2000)
Races - Other race alone (%)
Races - Other race alone (% change since 2000)
Racial diversity
Place of birth - Born in state of residence (%)
Place of birth - Born in state of residence (%) - White
Place of birth - Born in state of residence (%) - Black or African American
Place of birth - Born in state of residence (%) - Asian
Place of birth - Born in state of residence (%) - Hispanic or Latino
Place of birth - Born in state of residence (%) - American Indian and Alaska Native
Place of birth - Born in state of residence (%) - Multirace
Place of birth - Born in state of residence (%) - Other Race
Place of birth - Born in other state (%)
Place of birth - Born in other state (%) - White
Place of birth - Born in other state (%) - Black or African American
Place of birth - Born in other state (%) - Asian
Place of birth - Born in other state (%) - Hispanic or Latino
Place of birth - Born in other state (%) - American Indian and Alaska Native
Place of birth - Born in other state (%) - Multirace
Place of birth - Born in other state (%) - Other Race
Place of birth - Native, outside of US (%)
Place of birth - Native, outside of US (%) - White
Place of birth - Native, outside of US (%) - Black or African American
Place of birth - Native, outside of US (%) - Asian
Place of birth - Native, outside of US (%) - Hispanic or Latino
Place of birth - Native, outside of US (%) - American Indian and Alaska Native
Place of birth - Native, outside of US (%) - Multirace
Place of birth - Native, outside of US (%) - Other Race
Place of birth - Foreign born (%)
Place of birth - Foreign born (%) - White
Place of birth - Foreign born (%) - Black or African American
Place of birth - Foreign born (%) - Asian
Place of birth - Foreign born (%) - Hispanic or Latino
Place of birth - Foreign born (%) - American Indian and Alaska Native
Place of birth - Foreign born (%) - Multirace
Place of birth - Foreign born (%) - Other Race
Residents speaking English at home (%)
Residents speaking English at home - Born in the United States (%)
Residents speaking English at home - Native, born elsewhere (%)
Residents speaking English at home - Foreign born (%)
Residents speaking Spanish at home (%)
Residents speaking Spanish at home - Born in the United States (%)
Residents speaking Spanish at home - Native, born elsewhere (%)
Residents speaking Spanish at home - Foreign born (%)
Residents speaking other language at home (%)
Residents speaking other language at home - Born in the United States (%)
Residents speaking other language at home - Native, born elsewhere (%)
Residents speaking other language at home - Foreign born (%)
Marital status - Never married (%)
Marital status - Now married (%)
Marital status - Separated (%)
Marital status - Widowed (%)
Marital status - Divorced (%)
Ancestries Reported - Arab (%)
Ancestries Reported - Czech (%)
Ancestries Reported - Danish (%)
Ancestries Reported - Dutch (%)
Ancestries Reported - English (%)
Ancestries Reported - French (%)
Ancestries Reported - French Canadian (%)
Ancestries Reported - German (%)
Ancestries Reported - Greek (%)
Ancestries Reported - Hungarian (%)
Ancestries Reported - Irish (%)
Ancestries Reported - Italian (%)
Ancestries Reported - Lithuanian (%)
Ancestries Reported - Norwegian (%)
Ancestries Reported - Polish (%)
Ancestries Reported - Portuguese (%)
Ancestries Reported - Russian (%)
Ancestries Reported - Scotch-Irish (%)
Ancestries Reported - Scottish (%)
Ancestries Reported - Slovak (%)
Ancestries Reported - Subsaharan African (%)
Ancestries Reported - Swedish (%)
Ancestries Reported - Swiss (%)
Ancestries Reported - Ukrainian (%)
Ancestries Reported - United States (%)
Ancestries Reported - Welsh (%)
Ancestries Reported - West Indian (%)
Ancestries Reported - Other (%)
Geographical mobility - Same house 1 year ago (%)
Geographical mobility - Same house 1 year ago (%) - White
Geographical mobility - Same house 1 year ago (%) - Black or African American
Geographical mobility - Same house 1 year ago (%) - Asian
Geographical mobility - Same house 1 year ago (%) - Hispanic or Latino
Geographical mobility - Same house 1 year ago (%) - American Indian and Alaska Native
Geographical mobility - Same house 1 year ago (%) - Multirace
Geographical mobility - Same house 1 year ago (%) - Other Race
Geographical mobility - Moved within same county (%)
Geographical mobility - Moved within same county (%) - White
Geographical mobility - Moved within same county (%) - Black or African American
Geographical mobility - Moved within same county (%) - Asian
Geographical mobility - Moved within same county (%) - Hispanic or Latino
Geographical mobility - Moved within same county (%) - American Indian and Alaska Native
Geographical mobility - Moved within same county (%) - Multirace
Geographical mobility - Moved within same county (%) - Other Race
Geographical mobility - Moved from different county within same state (%)
Geographical mobility - Moved from different county within same state (%) - White
Geographical mobility - Moved from different county within same state (%) - Black or African American
Geographical mobility - Moved from different county within same state (%) - Asian
Geographical mobility - Moved from different county within same state (%) - Hispanic or Latino
Geographical mobility - Moved from different county within same state (%) - American Indian and Alaska Native
Geographical mobility - Moved from different county within same state (%) - Multirace
Geographical mobility - Moved from different county within same state (%) - Other Race
Geographical mobility - Moved from different state (%)
Geographical mobility - Moved from different state (%) - White
Geographical mobility - Moved from different state (%) - Black or African American
Geographical mobility - Moved from different state (%) - Asian
Geographical mobility - Moved from different state (%) - Hispanic or Latino
Geographical mobility - Moved from different state (%) - American Indian and Alaska Native
Geographical mobility - Moved from different state (%) - Multirace
Geographical mobility - Moved from different state (%) - Other Race
Geographical mobility - Moved from abroad (%)
Geographical mobility - Moved from abroad (%) - White
Geographical mobility - Moved from abroad (%) - Black or African American
Geographical mobility - Moved from abroad (%) - Asian
Geographical mobility - Moved from abroad (%) - Hispanic or Latino
Geographical mobility - Moved from abroad (%) - American Indian and Alaska Native
Geographical mobility - Moved from abroad (%) - Multirace
Geographical mobility - Moved from abroad (%) - Other Race
Place of birth for the foreign-born population - Ireland (%)
Place of birth for the foreign-born population - Denmark (%)
Place of birth for the foreign-born population - Norway (%)
Place of birth for the foreign-born population - Sweden (%)
Place of birth for the foreign-born population - United Kingdom (%)
Place of birth for the foreign-born population - England (%)
Place of birth for the foreign-born population - Scotland (%)
Place of birth for the foreign-born population - Other Northern Europe (%)
Place of birth for the foreign-born population - Austria (%)
Place of birth for the foreign-born population - Belgium (%)
Place of birth for the foreign-born population - France (%)
Place of birth for the foreign-born population - Germany (%)
Place of birth for the foreign-born population - Netherlands (%)
Place of birth for the foreign-born population - Switzerland (%)
Place of birth for the foreign-born population - Other Western Europe (%)
Place of birth for the foreign-born population - Greece (%)
Place of birth for the foreign-born population - Italy (%)
Place of birth for the foreign-born population - Portugal (%)
Place of birth for the foreign-born population - Spain (%)
Place of birth for the foreign-born population - Other Southern Europe (%)
Place of birth for the foreign-born population - Albania (%)
Place of birth for the foreign-born population - Belarus (%)
Place of birth for the foreign-born population - Bosnia and Herzegovina (%)
Place of birth for the foreign-born population - Bulgaria (%)
Place of birth for the foreign-born population - Croatia (%)
Place of birth for the foreign-born population - Czechoslovakia (%)
Place of birth for the foreign-born population - Hungary (%)
Place of birth for the foreign-born population - Latvia (%)
Place of birth for the foreign-born population - Lithuania (%)
Place of birth for the foreign-born population - North Macedonia (Macedonia) (%)
Place of birth for the foreign-born population - Moldova (%)
Place of birth for the foreign-born population - Poland (%)
Place of birth for the foreign-born population - Romania (%)
Place of birth for the foreign-born population - Russia (%)
Place of birth for the foreign-born population - Serbia (%)
Place of birth for the foreign-born population - Ukraine (%)
Place of birth for the foreign-born population - Other Eastern Europe (%)
Place of birth for the foreign-born population - China (%)
Place of birth for the foreign-born population - Hong Kong (%)
Place of birth for the foreign-born population - Taiwan (%)
Place of birth for the foreign-born population - Japan (%)
Place of birth for the foreign-born population - Korea (%)
Place of birth for the foreign-born population - Other Eastern Asia (%)
Place of birth for the foreign-born population - Afghanistan (%)
Place of birth for the foreign-born population - Bangladesh (%)
Place of birth for the foreign-born population - India (%)
Place of birth for the foreign-born population - Iran (%)
Place of birth for the foreign-born population - Kazakhstan (%)
Place of birth for the foreign-born population - Nepal (%)
Place of birth for the foreign-born population - Pakistan (%)
Place of birth for the foreign-born population - Sri Lanka (%)
Place of birth for the foreign-born population - Uzbekistan (%)
Place of birth for the foreign-born population - Other South Central Asia (%)
Place of birth for the foreign-born population - Burma (%)
Place of birth for the foreign-born population - Cambodia (%)
Place of birth for the foreign-born population - Indonesia (%)
Place of birth for the foreign-born population - Laos (%)
Place of birth for the foreign-born population - Malaysia (%)
Place of birth for the foreign-born population - Philippines (%)
Place of birth for the foreign-born population - Singapore (%)
Place of birth for the foreign-born population - Thailand (%)
Place of birth for the foreign-born population - Vietnam (%)
Place of birth for the foreign-born population - Other South Eastern Asia (%)
Place of birth for the foreign-born population - Armenia (%)
Place of birth for the foreign-born population - Iraq (%)
Place of birth for the foreign-born population - Israel (%)
Place of birth for the foreign-born population - Jordan (%)
Place of birth for the foreign-born population - Kuwait (%)
Place of birth for the foreign-born population - Lebanon (%)
Place of birth for the foreign-born population - Saudi Arabia (%)
Place of birth for the foreign-born population - Syria (%)
Place of birth for the foreign-born population - Turkey (%)
Place of birth for the foreign-born population - Yemen (%)
Place of birth for the foreign-born population - Other Western Asia (%)
Place of birth for the foreign-born population - Eritrea (%)
Place of birth for the foreign-born population - Ethiopia (%)
Place of birth for the foreign-born population - Kenya (%)
Place of birth for the foreign-born population - Somalia (%)
Place of birth for the foreign-born population - Uganda (%)
Place of birth for the foreign-born population - Zimbabwe (%)
Place of birth for the foreign-born population - Other Eastern Africa (%)
Place of birth for the foreign-born population - Cameroon (%)
Place of birth for the foreign-born population - Congo (%)
Place of birth for the foreign-born population - Democratic Republic of Congo (Zaire) (%)
Place of birth for the foreign-born population - Other Middle Africa (%)
Place of birth for the foreign-born population - Egypt (%)
Place of birth for the foreign-born population - Morocco (%)
Place of birth for the foreign-born population - Sudan (%)
Place of birth for the foreign-born population - Other Northern Africa (%)
Place of birth for the foreign-born population - South Africa (%)
Place of birth for the foreign-born population - Other Southern Africa (%)
Place of birth for the foreign-born population - Cabo Verde (%)
Place of birth for the foreign-born population - Ghana (%)
Place of birth for the foreign-born population - Liberia (%)
Place of birth for the foreign-born population - Nigeria (%)
Place of birth for the foreign-born population - Senegal (%)
Place of birth for the foreign-born population - Sierra Leone (%)
Place of birth for the foreign-born population - Other Western Africa (%)
Place of birth for the foreign-born population - Australia (%)
Place of birth for the foreign-born population - New Zealand (%)
Place of birth for the foreign-born population - Fiji (%)
Place of birth for the foreign-born population - Micronesia (%)
Place of birth for the foreign-born population - Bahamas (%)
Place of birth for the foreign-born population - Barbados (%)
Place of birth for the foreign-born population - Cuba (%)
Place of birth for the foreign-born population - Dominica (%)
Place of birth for the foreign-born population - Dominican Republic (%)
Place of birth for the foreign-born population - Grenada (%)
Place of birth for the foreign-born population - Haiti (%)
Place of birth for the foreign-born population - Jamaica (%)
Place of birth for the foreign-born population - St. Vincent and the Grenadines (%)
Place of birth for the foreign-born population - Trinidad and Tobago (%)
Place of birth for the foreign-born population - West Indies (%)
Place of birth for the foreign-born population - Other Caribbean (%)
Place of birth for the foreign-born population - Belize (%)
Place of birth for the foreign-born population - Costa Rica (%)
Place of birth for the foreign-born population - El Salvador (%)
Place of birth for the foreign-born population - Guatemala (%)
Place of birth for the foreign-born population - Honduras (%)
Place of birth for the foreign-born population - Mexico (%)
Place of birth for the foreign-born population - Nicaragua (%)
Place of birth for the foreign-born population - Panama (%)
Place of birth for the foreign-born population - Other Central America (%)
Place of birth for the foreign-born population - Argentina (%)
Place of birth for the foreign-born population - Bolivia (%)
Place of birth for the foreign-born population - Brazil (%)
Place of birth for the foreign-born population - Chile (%)
Place of birth for the foreign-born population - Colombia (%)
Place of birth for the foreign-born population - Ecuador (%)
Place of birth for the foreign-born population - Guyana (%)
Place of birth for the foreign-born population - Peru (%)
Place of birth for the foreign-born population - Uruguay (%)
Place of birth for the foreign-born population - Venezuela (%)
Place of birth for the foreign-born population - Other South America (%)
Place of birth for the foreign-born population - Canada (%)
Place of birth for the foreign-born population - Other Northern America (%)
Place of birth for the foreign-born population - Other (%)
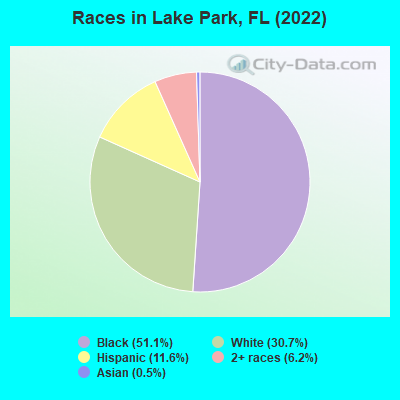
According to 2022 data, the most numerous races in Lake Park, FL are White alone (2,806 residents), Hispanic (1,063 residents), and Black alone (4,672 residents). 70.9% of Lake Park residents speak English at home. 28.4% of Lake Park, FL residents are foreign-born (24.5% born in Latin America), which is 26.0% greater than the foreign-born rate of 21.0% across the entire state of Florida.
Race distribution in Lake Park
2000 2022
10,458,509 65.4% White alone 2,682,715 16.8% Hispanic 2,264,268 14.2% Black alone 261,693 1.6% Asian alone 236,954 1.5% Two or more races 42,358 0.3% American Indian alone 28,994 0.2% Other race alone 6,887 0.04% Native Hawaiian and Other
11,309,403 50.8% White alone 6,025,039 27.1% Hispanic 3,241,015 14.6% Black alone 861,630 3.9% Two or more races 623,692 2.8% Asian alone 152,054 0.7% Other race alone 22,504 0.1% American Indian alone 9,486 0.04% Native Hawaiian and Other
Income and house value in Lake Park Median household income in 2022 $69,195 White non-Hispanic householders$45,161 Black householders$85,026 Some other race householders$81,002 Two or more races householders$90,587 Hispanic or Latino race householdersMedian 2022 house value $390,103 White Non-Hispanic householders$395,568 Black or African American householders $417,427 Asian householders$578,009 Some other race householders$310,233 Two or more races householders$401,033 Hispanic or Latino householders
Median age by race in Lake Park
52.4 Median age for White residents48.2 55.0 32.4 Median age for Black or African American residents25.8 38.8 -724,168,912.1 Median age for American Indian / Alaska Native residents-806,112,702.2 -660,098,521.5 43.2 Median age for Asian residents-707,317,072.5 42.9 -674,285,713.6 Median age for Native Hawaiian / Pacific Islander residents-674,264,006.9 -672,397,325.0 51.6 Median age for Other race residents65.1 52.0 24.3 Median age for Two or more races residents28.9 19.0 54.0 Median age for White alone residents48.8 55.7 34.9 Median age for Hispanic or Latino residents36.8 25.9
Owner/renter occupied households by race in Lake Park
House owners and renters - White residents 1,047 64.9% Owner occupied565 35.1% Renter occupiedHouse owners and renters - Black or African American residents 373 26.6% Owner occupied1,028 73.4% Renter occupiedHouse owners and renters - Asian residents 12 29.7% Owner occupied28 70.3% Renter occupiedHouse owners and renters - Other race residents 47 100.0% Renter occupiedHouse owners and renters - Two or more races residents 104 51.5% Owner occupied97 48.5% Renter occupiedHouse owners and renters - White alone residents 1,088 69.4% Owner occupied480 30.6% Renter occupiedHouse owners and renters - Hispanic or Latino residents 75 22.9% Owner occupied252 77.1% Renter occupied
Language usage in Lake Park
English speakers - Total 70.9% of residents of Lake Park speak English at home.
6.4% of residents speak Spanish at home 419 77.4% Speak English very well122 22.6% Speak English less than very well22.9% of residents speak other language at home 798 41.2% Speak English very well1,141 58.8% Speak English less than very well
English speakers - Born in the United States 92.3% of residents of Lake Park speak English at home.
4.7% of residents speak Spanish at home 114 100.0% Speak English very well2.8% of residents speak other language at home 62 91.2% Speak English very well6 8.8% Speak English less than very well
English speakers - Native, born elsewhere 24.9% of residents of Lake Park speak English at home.
51.9% of residents speak Spanish at home 105 84.0% Speak English very well20 16.0% Speak English less than very well16.6% of residents speak other language at home 40 100.0% Speak English very well
English speakers - Foreign-born 31.6% of residents of Lake Park speak English at home.
8.1% of residents speak Spanish at home 112 53.3% Speak English very well98 46.7% Speak English less than very well61.1% of residents speak other language at home 452 28.6% Speak English very well1,129 71.4% Speak English less than very well
White (Caucasian) - Speak only English Native:
99.9% (2,529)Foreign-born:
68.1% (124)
White (Caucasian) - Speak another language Native:
2.5% (63)Foreign-born:
47.4% (86)
Black or African American - Speak only English Native:
87.2% (2,098)Foreign-born:
29.1% (609)
Black or African American - Speak another language Native:
12.6% (303)Foreign-born:
71.2% (1,490)
Other race - Speak another language Native:
89.8% (55)Foreign-born:
100.0% (81)
Two or more races - Speak only English Native:
57.0% (516)Foreign-born:
43.3% (71)
Two or more races - Speak another language Native:
42.8% (387)Foreign-born:
48.4% (79)
White alone - Speak only English Native:
99.8% (2,333)Foreign-born:
65.4% (133)
White alone - Speak another language Native:
0.7% (16)Foreign-born:
37.6% (77)
Hispanic or Latino - Speak only English Native:
54.1% (399)Foreign-born:
11.9% (29)
Hispanic or Latino - Speak another language Native:
46.5% (343)Foreign-born:
87.9% (215)
Foreign-born residents in Lake Park 2,593 residents are foreign born (24.5% Latin America ).
This city:
28.4%Florida:
21.1%
Marital status for residents in Lake Park Marital status - White (Caucasian) population 15 years and over
Males 32.4% Never married51.6% Now married0.0% Separated3.8% Widowed12.2% DivorcedFemales 27.5% Never married38.2% Now married0.0% Separated25.6% Widowed8.7% DivorcedWomen who gave birth in the past 12 months Now married:
100.0% (17)Unmarried:
0.0% (0)
Women who did not give birth in the past 12 months Now married:
53.4% (248)Unmarried:
46.6% (217)
Marital status - Black or African American population 15 years and over
Males 57.5% Never married35.0% Now married0.0% Separated0.0% Widowed7.5% DivorcedFemales 41.4% Never married32.9% Now married7.6% Separated3.8% Widowed14.2% DivorcedWomen who gave birth in the past 12 months Now married:
59.0% (111)Unmarried:
41.0% (77)
Women who did not give birth in the past 12 months Now married:
35.9% (454)Unmarried:
64.1% (809)
Marital status - Other race population 15 years and over
Males 20.8% Never married79.2% Now married0.0% Separated0.0% Widowed0.0% DivorcedFemales 12.2% Never married0.0% Now married44.9% Separated0.0% Widowed42.9% DivorcedWomen who did not give birth in the past 12 months Now married:
78.6% (35)Unmarried:
21.4% (10)
Marital status - Two or more races population 15 years and over
Males 50.6% Never married18.8% Now married0.0% Separated0.0% Widowed30.6% DivorcedFemales 68.6% Never married13.3% Now married0.0% Separated3.8% Widowed14.4% DivorcedWomen who did not give birth in the past 12 months Now married:
13.8% (49)Unmarried:
86.2% (305)
Marital status - White alone, not Hispanic / Latino population 15 years and over
Males 31.5% Never married52.1% Now married0.0% Separated2.4% Widowed13.9% DivorcedFemales 20.8% Never married41.9% Now married0.0% Separated28.4% Widowed8.9% DivorcedWomen who gave birth in the past 12 months Now married:
100.0% (20)Unmarried:
0.0% (0)
Women who did not give birth in the past 12 months Now married:
70.0% (283)Unmarried:
30.0% (121)
Marital status - Hispanic or Latino population 15 years and over
Males 26.6% Never married45.1% Now married0.0% Separated5.5% Widowed22.8% DivorcedFemales 67.4% Never married11.9% Now married6.4% Separated0.0% Widowed14.2% DivorcedWomen who did not give birth in the past 12 months Now married:
19.5% (65)Unmarried:
80.5% (268)
Ancestries in Lake Park
1,823 30.4% Haitian627 10.4% Jamaican378 6.3% African216 3.6% American141 2.3% German99 1.6% English94 1.6% Irish92 1.5% Scottish87 1.4% Norwegian79 1.3% Eastern European74 1.2% European71 1.2% Swedish57 0.9% Russian53 0.9% Iraqi36 0.6% South African29 0.5% Italian20 0.3% Hungarian20 0.3% Polish19 0.3% Romanian19 0.3% Ukrainian13 0.2% British13 0.2% French10 0.2% Swiss8 0.1% French Canadian8 0.1% Scotch-Irish7 0.1% Slovene
Children Nativity (place of birth) in Lake Park
Children under 6 years - Living with two parents Both parents native 244 100.0% NativeBoth parents foreign-born 140 100.0% NativeOne native, one foreign-born parent 15 100.0% NativeChildren under 6 years - Living with one parent Native parent 252 100.0% NativeForeign-born parent 138 100.0% NativeChildren 6 to 17 years - Living with two parents Both parents native 340 100.0% NativeBoth parents foreign-born 74 28.8% Native184 71.2% Foreign-bornOne native, one foreign-born parent 59 100.0% NativeChildren 6 to 17 years - Living with one parent Native parent 254 100.0% NativeForeign-born parent 254 54.2% Native215 45.8% Foreign-born
Grandparents responsible for own grandchildren in Lake Park
Grandparents (30 to 59 years) White / Caucasian 24 100.0% Responsible for grandchildrenHispanic or Latino 33 100.0% Responsible for grandchildren
Grandparents (60 years and over) White / Caucasian 9 100.0% Not responsible for grandchildrenHispanic or Latino 21 100.0% Not responsible for grandchildren