Races in Lake Mary, Florida (FL) Detailed Stats
Data:
Races - White alone (%)
Races - White alone (% change since 2000)
Races - Black alone (%)
Races - Black alone (% change since 2000)
Races - American Indian alone (%)
Races - American Indian alone (% change since 2000)
Races - Asian alone (%)
Races - Asian alone (% change since 2000)
Races - Hispanic (%)
Races - Hispanic (% change since 2000)
Races - Native Hawaiian and Other Pacific Islander alone (%)
Races - Native Hawaiian and Other Pacific Islander alone (% change since 2000)
Races - Two or more races(%)
Races - Two or more races(% change since 2000)
Races - Other race alone (%)
Races - Other race alone (% change since 2000)
Racial diversity
Place of birth - Born in state of residence (%)
Place of birth - Born in state of residence (%) - White
Place of birth - Born in state of residence (%) - Black or African American
Place of birth - Born in state of residence (%) - Asian
Place of birth - Born in state of residence (%) - Hispanic or Latino
Place of birth - Born in state of residence (%) - American Indian and Alaska Native
Place of birth - Born in state of residence (%) - Multirace
Place of birth - Born in state of residence (%) - Other Race
Place of birth - Born in other state (%)
Place of birth - Born in other state (%) - White
Place of birth - Born in other state (%) - Black or African American
Place of birth - Born in other state (%) - Asian
Place of birth - Born in other state (%) - Hispanic or Latino
Place of birth - Born in other state (%) - American Indian and Alaska Native
Place of birth - Born in other state (%) - Multirace
Place of birth - Born in other state (%) - Other Race
Place of birth - Native, outside of US (%)
Place of birth - Native, outside of US (%) - White
Place of birth - Native, outside of US (%) - Black or African American
Place of birth - Native, outside of US (%) - Asian
Place of birth - Native, outside of US (%) - Hispanic or Latino
Place of birth - Native, outside of US (%) - American Indian and Alaska Native
Place of birth - Native, outside of US (%) - Multirace
Place of birth - Native, outside of US (%) - Other Race
Place of birth - Foreign born (%)
Place of birth - Foreign born (%) - White
Place of birth - Foreign born (%) - Black or African American
Place of birth - Foreign born (%) - Asian
Place of birth - Foreign born (%) - Hispanic or Latino
Place of birth - Foreign born (%) - American Indian and Alaska Native
Place of birth - Foreign born (%) - Multirace
Place of birth - Foreign born (%) - Other Race
Residents speaking English at home (%)
Residents speaking English at home - Born in the United States (%)
Residents speaking English at home - Native, born elsewhere (%)
Residents speaking English at home - Foreign born (%)
Residents speaking Spanish at home (%)
Residents speaking Spanish at home - Born in the United States (%)
Residents speaking Spanish at home - Native, born elsewhere (%)
Residents speaking Spanish at home - Foreign born (%)
Residents speaking other language at home (%)
Residents speaking other language at home - Born in the United States (%)
Residents speaking other language at home - Native, born elsewhere (%)
Residents speaking other language at home - Foreign born (%)
Marital status - Never married (%)
Marital status - Now married (%)
Marital status - Separated (%)
Marital status - Widowed (%)
Marital status - Divorced (%)
Ancestries Reported - Arab (%)
Ancestries Reported - Czech (%)
Ancestries Reported - Danish (%)
Ancestries Reported - Dutch (%)
Ancestries Reported - English (%)
Ancestries Reported - French (%)
Ancestries Reported - French Canadian (%)
Ancestries Reported - German (%)
Ancestries Reported - Greek (%)
Ancestries Reported - Hungarian (%)
Ancestries Reported - Irish (%)
Ancestries Reported - Italian (%)
Ancestries Reported - Lithuanian (%)
Ancestries Reported - Norwegian (%)
Ancestries Reported - Polish (%)
Ancestries Reported - Portuguese (%)
Ancestries Reported - Russian (%)
Ancestries Reported - Scotch-Irish (%)
Ancestries Reported - Scottish (%)
Ancestries Reported - Slovak (%)
Ancestries Reported - Subsaharan African (%)
Ancestries Reported - Swedish (%)
Ancestries Reported - Swiss (%)
Ancestries Reported - Ukrainian (%)
Ancestries Reported - United States (%)
Ancestries Reported - Welsh (%)
Ancestries Reported - West Indian (%)
Ancestries Reported - Other (%)
Geographical mobility - Same house 1 year ago (%)
Geographical mobility - Same house 1 year ago (%) - White
Geographical mobility - Same house 1 year ago (%) - Black or African American
Geographical mobility - Same house 1 year ago (%) - Asian
Geographical mobility - Same house 1 year ago (%) - Hispanic or Latino
Geographical mobility - Same house 1 year ago (%) - American Indian and Alaska Native
Geographical mobility - Same house 1 year ago (%) - Multirace
Geographical mobility - Same house 1 year ago (%) - Other Race
Geographical mobility - Moved within same county (%)
Geographical mobility - Moved within same county (%) - White
Geographical mobility - Moved within same county (%) - Black or African American
Geographical mobility - Moved within same county (%) - Asian
Geographical mobility - Moved within same county (%) - Hispanic or Latino
Geographical mobility - Moved within same county (%) - American Indian and Alaska Native
Geographical mobility - Moved within same county (%) - Multirace
Geographical mobility - Moved within same county (%) - Other Race
Geographical mobility - Moved from different county within same state (%)
Geographical mobility - Moved from different county within same state (%) - White
Geographical mobility - Moved from different county within same state (%) - Black or African American
Geographical mobility - Moved from different county within same state (%) - Asian
Geographical mobility - Moved from different county within same state (%) - Hispanic or Latino
Geographical mobility - Moved from different county within same state (%) - American Indian and Alaska Native
Geographical mobility - Moved from different county within same state (%) - Multirace
Geographical mobility - Moved from different county within same state (%) - Other Race
Geographical mobility - Moved from different state (%)
Geographical mobility - Moved from different state (%) - White
Geographical mobility - Moved from different state (%) - Black or African American
Geographical mobility - Moved from different state (%) - Asian
Geographical mobility - Moved from different state (%) - Hispanic or Latino
Geographical mobility - Moved from different state (%) - American Indian and Alaska Native
Geographical mobility - Moved from different state (%) - Multirace
Geographical mobility - Moved from different state (%) - Other Race
Geographical mobility - Moved from abroad (%)
Geographical mobility - Moved from abroad (%) - White
Geographical mobility - Moved from abroad (%) - Black or African American
Geographical mobility - Moved from abroad (%) - Asian
Geographical mobility - Moved from abroad (%) - Hispanic or Latino
Geographical mobility - Moved from abroad (%) - American Indian and Alaska Native
Geographical mobility - Moved from abroad (%) - Multirace
Geographical mobility - Moved from abroad (%) - Other Race
Place of birth for the foreign-born population - Ireland (%)
Place of birth for the foreign-born population - Denmark (%)
Place of birth for the foreign-born population - Norway (%)
Place of birth for the foreign-born population - Sweden (%)
Place of birth for the foreign-born population - United Kingdom (%)
Place of birth for the foreign-born population - England (%)
Place of birth for the foreign-born population - Scotland (%)
Place of birth for the foreign-born population - Other Northern Europe (%)
Place of birth for the foreign-born population - Austria (%)
Place of birth for the foreign-born population - Belgium (%)
Place of birth for the foreign-born population - France (%)
Place of birth for the foreign-born population - Germany (%)
Place of birth for the foreign-born population - Netherlands (%)
Place of birth for the foreign-born population - Switzerland (%)
Place of birth for the foreign-born population - Other Western Europe (%)
Place of birth for the foreign-born population - Greece (%)
Place of birth for the foreign-born population - Italy (%)
Place of birth for the foreign-born population - Portugal (%)
Place of birth for the foreign-born population - Spain (%)
Place of birth for the foreign-born population - Other Southern Europe (%)
Place of birth for the foreign-born population - Albania (%)
Place of birth for the foreign-born population - Belarus (%)
Place of birth for the foreign-born population - Bosnia and Herzegovina (%)
Place of birth for the foreign-born population - Bulgaria (%)
Place of birth for the foreign-born population - Croatia (%)
Place of birth for the foreign-born population - Czechoslovakia (%)
Place of birth for the foreign-born population - Hungary (%)
Place of birth for the foreign-born population - Latvia (%)
Place of birth for the foreign-born population - Lithuania (%)
Place of birth for the foreign-born population - North Macedonia (Macedonia) (%)
Place of birth for the foreign-born population - Moldova (%)
Place of birth for the foreign-born population - Poland (%)
Place of birth for the foreign-born population - Romania (%)
Place of birth for the foreign-born population - Russia (%)
Place of birth for the foreign-born population - Serbia (%)
Place of birth for the foreign-born population - Ukraine (%)
Place of birth for the foreign-born population - Other Eastern Europe (%)
Place of birth for the foreign-born population - China (%)
Place of birth for the foreign-born population - Hong Kong (%)
Place of birth for the foreign-born population - Taiwan (%)
Place of birth for the foreign-born population - Japan (%)
Place of birth for the foreign-born population - Korea (%)
Place of birth for the foreign-born population - Other Eastern Asia (%)
Place of birth for the foreign-born population - Afghanistan (%)
Place of birth for the foreign-born population - Bangladesh (%)
Place of birth for the foreign-born population - India (%)
Place of birth for the foreign-born population - Iran (%)
Place of birth for the foreign-born population - Kazakhstan (%)
Place of birth for the foreign-born population - Nepal (%)
Place of birth for the foreign-born population - Pakistan (%)
Place of birth for the foreign-born population - Sri Lanka (%)
Place of birth for the foreign-born population - Uzbekistan (%)
Place of birth for the foreign-born population - Other South Central Asia (%)
Place of birth for the foreign-born population - Burma (%)
Place of birth for the foreign-born population - Cambodia (%)
Place of birth for the foreign-born population - Indonesia (%)
Place of birth for the foreign-born population - Laos (%)
Place of birth for the foreign-born population - Malaysia (%)
Place of birth for the foreign-born population - Philippines (%)
Place of birth for the foreign-born population - Singapore (%)
Place of birth for the foreign-born population - Thailand (%)
Place of birth for the foreign-born population - Vietnam (%)
Place of birth for the foreign-born population - Other South Eastern Asia (%)
Place of birth for the foreign-born population - Armenia (%)
Place of birth for the foreign-born population - Iraq (%)
Place of birth for the foreign-born population - Israel (%)
Place of birth for the foreign-born population - Jordan (%)
Place of birth for the foreign-born population - Kuwait (%)
Place of birth for the foreign-born population - Lebanon (%)
Place of birth for the foreign-born population - Saudi Arabia (%)
Place of birth for the foreign-born population - Syria (%)
Place of birth for the foreign-born population - Turkey (%)
Place of birth for the foreign-born population - Yemen (%)
Place of birth for the foreign-born population - Other Western Asia (%)
Place of birth for the foreign-born population - Eritrea (%)
Place of birth for the foreign-born population - Ethiopia (%)
Place of birth for the foreign-born population - Kenya (%)
Place of birth for the foreign-born population - Somalia (%)
Place of birth for the foreign-born population - Uganda (%)
Place of birth for the foreign-born population - Zimbabwe (%)
Place of birth for the foreign-born population - Other Eastern Africa (%)
Place of birth for the foreign-born population - Cameroon (%)
Place of birth for the foreign-born population - Congo (%)
Place of birth for the foreign-born population - Democratic Republic of Congo (Zaire) (%)
Place of birth for the foreign-born population - Other Middle Africa (%)
Place of birth for the foreign-born population - Egypt (%)
Place of birth for the foreign-born population - Morocco (%)
Place of birth for the foreign-born population - Sudan (%)
Place of birth for the foreign-born population - Other Northern Africa (%)
Place of birth for the foreign-born population - South Africa (%)
Place of birth for the foreign-born population - Other Southern Africa (%)
Place of birth for the foreign-born population - Cabo Verde (%)
Place of birth for the foreign-born population - Ghana (%)
Place of birth for the foreign-born population - Liberia (%)
Place of birth for the foreign-born population - Nigeria (%)
Place of birth for the foreign-born population - Senegal (%)
Place of birth for the foreign-born population - Sierra Leone (%)
Place of birth for the foreign-born population - Other Western Africa (%)
Place of birth for the foreign-born population - Australia (%)
Place of birth for the foreign-born population - New Zealand (%)
Place of birth for the foreign-born population - Fiji (%)
Place of birth for the foreign-born population - Micronesia (%)
Place of birth for the foreign-born population - Bahamas (%)
Place of birth for the foreign-born population - Barbados (%)
Place of birth for the foreign-born population - Cuba (%)
Place of birth for the foreign-born population - Dominica (%)
Place of birth for the foreign-born population - Dominican Republic (%)
Place of birth for the foreign-born population - Grenada (%)
Place of birth for the foreign-born population - Haiti (%)
Place of birth for the foreign-born population - Jamaica (%)
Place of birth for the foreign-born population - St. Vincent and the Grenadines (%)
Place of birth for the foreign-born population - Trinidad and Tobago (%)
Place of birth for the foreign-born population - West Indies (%)
Place of birth for the foreign-born population - Other Caribbean (%)
Place of birth for the foreign-born population - Belize (%)
Place of birth for the foreign-born population - Costa Rica (%)
Place of birth for the foreign-born population - El Salvador (%)
Place of birth for the foreign-born population - Guatemala (%)
Place of birth for the foreign-born population - Honduras (%)
Place of birth for the foreign-born population - Mexico (%)
Place of birth for the foreign-born population - Nicaragua (%)
Place of birth for the foreign-born population - Panama (%)
Place of birth for the foreign-born population - Other Central America (%)
Place of birth for the foreign-born population - Argentina (%)
Place of birth for the foreign-born population - Bolivia (%)
Place of birth for the foreign-born population - Brazil (%)
Place of birth for the foreign-born population - Chile (%)
Place of birth for the foreign-born population - Colombia (%)
Place of birth for the foreign-born population - Ecuador (%)
Place of birth for the foreign-born population - Guyana (%)
Place of birth for the foreign-born population - Peru (%)
Place of birth for the foreign-born population - Uruguay (%)
Place of birth for the foreign-born population - Venezuela (%)
Place of birth for the foreign-born population - Other South America (%)
Place of birth for the foreign-born population - Canada (%)
Place of birth for the foreign-born population - Other Northern America (%)
Place of birth for the foreign-born population - Other (%)
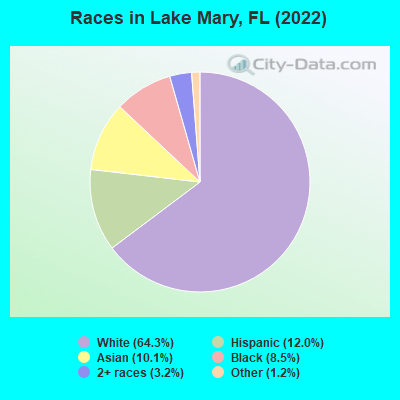
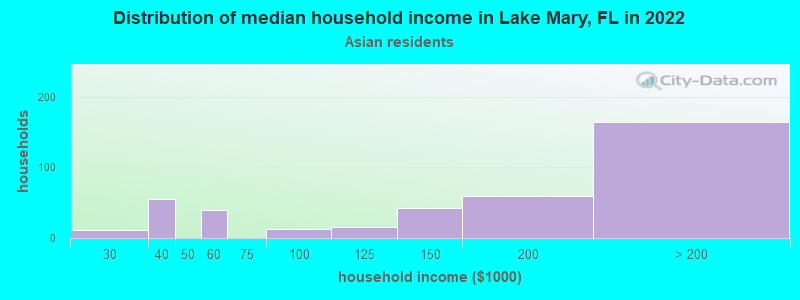
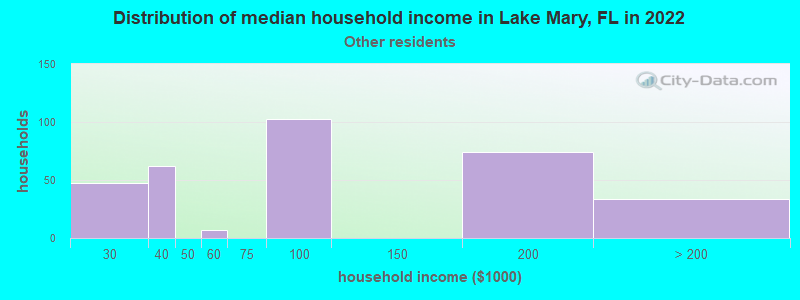
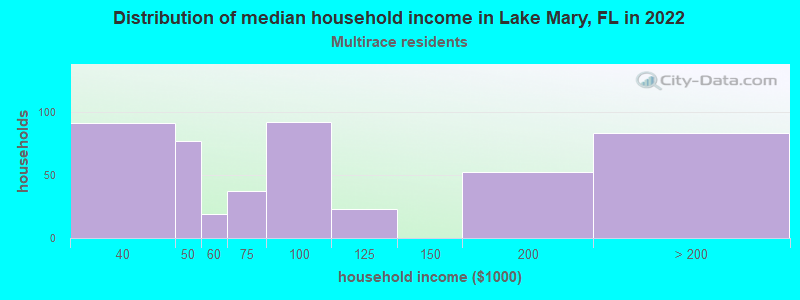
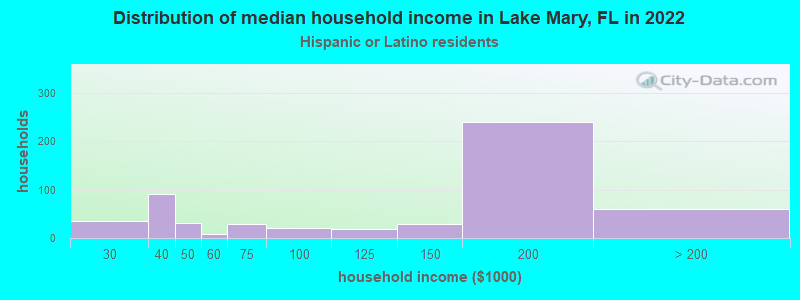
According to 2022 data, the most numerous races in Lake Mary, FL are White alone (10,873 residents), Hispanic (2,035 residents), and Black alone (1,432 residents). 80.5% of Lake Mary residents speak English at home. 17.1% of Lake Mary, FL residents are foreign-born (6.9% born in Latin America, 5.8% born in Asia, 2.5% born in Europe), which is 22.5% less than the foreign-born rate of 21.0% across the entire state of Florida.
Race distribution in Lake Mary
2000 2022
10,458,509 65.4% White alone 2,682,715 16.8% Hispanic 2,264,268 14.2% Black alone 261,693 1.6% Asian alone 236,954 1.5% Two or more races 42,358 0.3% American Indian alone 28,994 0.2% Other race alone 6,887 0.04% Native Hawaiian and Other
11,309,403 50.8% White alone 6,025,039 27.1% Hispanic 3,241,015 14.6% Black alone 861,630 3.9% Two or more races 623,692 2.8% Asian alone 152,054 0.7% Other race alone 22,504 0.1% American Indian alone 9,486 0.04% Native Hawaiian and Other
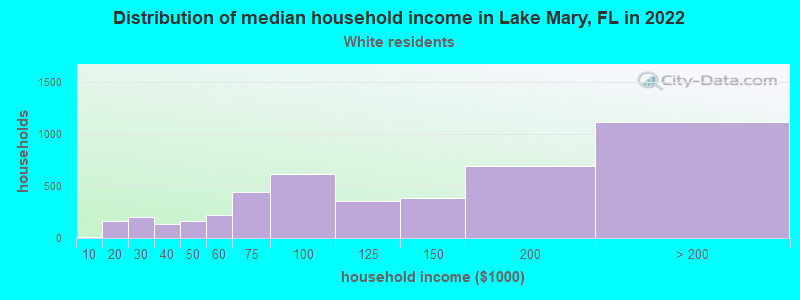
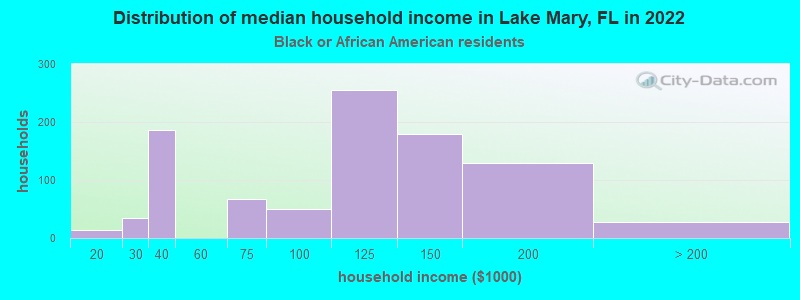
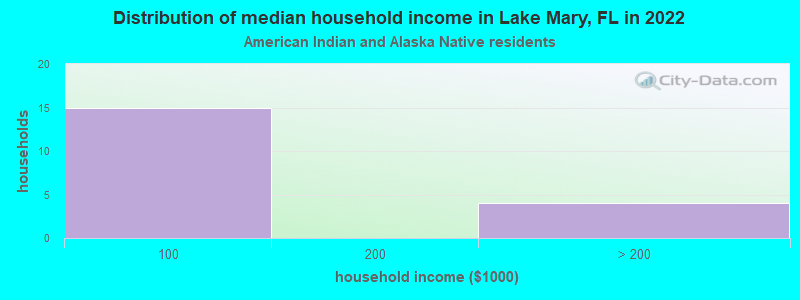
Income and house value in Lake Mary Median household income in 2022 $111,585 White non-Hispanic householders$113,276 Black householders$150,720 Asian householders$119,677 Some other race householders$72,461 Two or more races householders$128,352 Hispanic or Latino race householdersMedian 2022 house value $488,836 White Non-Hispanic householders$537,503 Black or African American householders$352,567 American Indian or Alaska Native householders $461,799 Asian householders$506,951 Some other race householders$449,361 Two or more races householders$489,106 Hispanic or Latino householders
Median age by race in Lake Mary
46.5 Median age for White residents45.8 47.5 46.4 Median age for Black or African American residents46.5 45.2 45.1 Median age for American Indian / Alaska Native residents-541,955,349.7 -503,171,246.9 36.6 Median age for Asian residents37.5 36.0 -679,849,340.2 Median age for Native Hawaiian / Pacific Islander residents-858,307,848.3 -443,298,968.6 32.4 Median age for Other race residents29.2 33.8 35.4 Median age for Two or more races residents24.4 38.1 46.2 Median age for White alone residents45.0 48.1 33.4 Median age for Hispanic or Latino residents30.1 35.8
Owner/renter occupied households by race in Lake Mary
House owners and renters - White residents 3,239 72.4% Owner occupied1,233 27.6% Renter occupiedHouse owners and renters - Black or African American residents 542 56.2% Owner occupied422 43.8% Renter occupiedHouse owners and renters - American Indian / Alaska Native residents 15 100.0% Owner occupiedHouse owners and renters - Asian residents 244 54.5% Owner occupied203 45.5% Renter occupiedHouse owners and renters - Other race residents 88 38.9% Owner occupied138 61.1% Renter occupiedHouse owners and renters - Two or more races residents 315 66.5% Owner occupied159 33.5% Renter occupiedHouse owners and renters - White alone residents 3,267 72.1% Owner occupied1,264 27.9% Renter occupiedHouse owners and renters - Hispanic or Latino residents 342 63.8% Owner occupied194 36.2% Renter occupied
Language usage in Lake Mary
English speakers - Total 80.5% of residents of Lake Mary speak English at home.
7.9% of residents speak Spanish at home 1,052 83.4% Speak English very well209 16.6% Speak English less than very well11.8% of residents speak other language at home 1,505 79.7% Speak English very well384 20.3% Speak English less than very well
English speakers - Born in the United States 92.1% of residents of Lake Mary speak English at home.
2.5% of residents speak Spanish at home 201 100.0% Speak English very well5.2% of residents speak other language at home 372 90.3% Speak English very well40 9.7% Speak English less than very well
English speakers - Native, born elsewhere 69.7% of residents of Lake Mary speak English at home.
38.4% of residents speak Spanish at home 189 83.6% Speak English very well37 16.4% Speak English less than very well
English speakers - Foreign-born 29.7% of residents of Lake Mary speak English at home.
24.0% of residents speak Spanish at home 545 77.1% Speak English very well162 22.9% Speak English less than very well45.1% of residents speak other language at home 990 74.5% Speak English very well339 25.5% Speak English less than very well
White (Caucasian) - Speak only English Native:
99.3% (9,521)Foreign-born:
30.9% (235)
White (Caucasian) - Speak another language Native:
2.6% (250)Foreign-born:
67.8% (515)
Black or African American - Speak only English Native:
84.4% (986)Foreign-born:
58.5% (209)
Black or African American - Speak another language Native:
19.5% (228)Foreign-born:
34.0% (122)
Asian - Speak only English Native:
61.7% (328)Foreign-born:
29.1% (295)
Asian - Speak another language Native:
38.3% (203)Foreign-born:
67.7% (686)
Other race - Speak another language Native:
53.8% (129)Foreign-born:
100.0% (200)
Two or more races - Speak only English Native:
68.4% (868)Foreign-born:
18.7% (62)
Two or more races - Speak another language Native:
31.1% (395)Foreign-born:
81.4% (268)
White alone - Speak only English Native:
96.9% (9,433)Foreign-born:
30.5% (234)
White alone - Speak another language Native:
3.1% (303)Foreign-born:
69.1% (530)
Hispanic or Latino - Speak only English Native:
55.9% (648)Foreign-born:
4.4% (29)
Hispanic or Latino - Speak another language Native:
45.4% (526)Foreign-born:
94.8% (634)
Foreign-born residents in Lake Mary 2,896 residents are foreign born (6.9% Latin America , 5.8% Asia , 2.5% Europe ).
This city:
17.1%Florida:
21.1%
Marital status for residents in Lake Mary Marital status - White (Caucasian) population 15 years and over
Males 25.9% Never married65.1% Now married0.0% Separated4.7% Widowed4.3% DivorcedFemales 18.4% Never married50.2% Now married1.1% Separated12.2% Widowed18.2% DivorcedWomen who gave birth in the past 12 months Now married:
100.0% (22)Unmarried:
0.0% (0)
Women who did not give birth in the past 12 months Now married:
45.5% (1,092)Unmarried:
54.5% (1,308)
Marital status - Black or African American population 15 years and over
Males 30.6% Never married42.5% Now married0.0% Separated8.3% Widowed18.6% DivorcedFemales 32.4% Never married19.1% Now married0.0% Separated6.2% Widowed42.3% DivorcedWomen who did not give birth in the past 12 months Now married:
20.1% (143)Unmarried:
79.9% (566)
Marital status - American Indian / Alaska Native population 15 years and over
Males 0.0% Never married100.0% Now married0.0% Separated0.0% Widowed0.0% DivorcedFemales 10.0% Never married90.0% Now married0.0% Separated0.0% Widowed0.0% DivorcedWomen who did not give birth in the past 12 months Now married:
0.0% (0)Unmarried:
100.0% (2)
Marital status - Asian population 15 years and over
Males 24.0% Never married70.1% Now married0.0% Separated0.0% Widowed5.9% DivorcedFemales 18.3% Never married61.8% Now married0.0% Separated9.6% Widowed10.4% DivorcedWomen who gave birth in the past 12 months Now married:
100.0% (47)Unmarried:
0.0% (0)
Women who did not give birth in the past 12 months Now married:
60.9% (273)Unmarried:
39.1% (175)
Marital status - Other race population 15 years and over
Males 29.8% Never married70.2% Now married0.0% Separated0.0% Widowed0.0% DivorcedFemales 48.0% Never married44.9% Now married0.0% Separated0.0% Widowed7.0% DivorcedWomen who did not give birth in the past 12 months Now married:
44.0% (88)Unmarried:
56.0% (112)
Marital status - Two or more races population 15 years and over
Males 32.7% Never married47.5% Now married0.0% Separated1.1% Widowed18.7% DivorcedFemales 17.5% Never married60.9% Now married0.0% Separated3.8% Widowed17.7% DivorcedWomen who did not give birth in the past 12 months Now married:
49.5% (215)Unmarried:
50.5% (220)
Marital status - White alone, not Hispanic / Latino population 15 years and over
Males 26.3% Never married64.5% Now married0.0% Separated4.9% Widowed4.3% DivorcedFemales 17.6% Never married50.2% Now married1.1% Separated12.1% Widowed19.0% DivorcedWomen who gave birth in the past 12 months Now married:
100.0% (23)Unmarried:
0.0% (0)
Women who did not give birth in the past 12 months Now married:
45.2% (1,088)Unmarried:
54.8% (1,319)
Marital status - Hispanic or Latino population 15 years and over
Males 26.6% Never married70.4% Now married0.0% Separated0.0% Widowed3.0% DivorcedFemales 31.3% Never married56.2% Now married0.0% Separated7.0% Widowed5.5% DivorcedWomen who did not give birth in the past 12 months Now married:
53.9% (370)Unmarried:
46.1% (316)
Ancestries in Lake Mary
2,485 23.6% American902 8.6% English561 5.3% German474 4.5% Italian377 3.6% Irish295 2.8% Portuguese216 2.1% Polish185 1.8% Trinidadian and Tobagonian121 1.1% Russian108 1.0% African104 1.0% French92 0.9% Iranian91 0.9% European83 0.8% Danish82 0.8% Canadian81 0.8% Croatian72 0.7% Brazilian58 0.6% Eastern European56 0.5% Jamaican45 0.4% Ukrainian44 0.4% U.S. Virgin Islander42 0.4% Scottish40 0.4% Haitian35 0.3% Egyptian33 0.3% Dutch16 0.2% Northern European15 0.1% Czech15 0.1% Israeli15 0.1% Swedish14 0.1% French Canadian14 0.1% Norwegian13 0.1% Guyanese13 0.1% Nigerian9 0.09% Czechoslovakian8 0.08% British7 0.07% Austrian
Geographical mobility in Lake Mary Same house 1 year ago 8,880 83.0% White (Caucasian)1,240 76.8% Black or African American21 100.0% American Indian / Alaska Native1,482 86.4% Asian265 49.6% Other race1,340 75.8% Two or more races8,883 81.9% White alone, not Hispanic / Latino1,550 79.0% Hispanic or LatinoMoved within same county 605 5.7% White / Caucasian85 5.2% Black or African American189 11.0% Asian134 25.1% Other race379 21.5% Two or more races621 5.7% White alone, not Hispanic / Latino389 19.8% Hispanic or LatinoMoved within same state 359 3.4% White / Caucasian19 1.2% Black or African American28 1.7% Asian165 9.3% Two or more races390 3.6% White alone, not Hispanic / Latino93 4.7% Hispanic or LatinoMoved from different state 907 8.5% White / Caucasian260 16.1% Black or African American190 35.7% Other race971 9.0% White alone, not Hispanic / LatinoMoved from abroad 20 0.2% White9 0.6% Black or African American38 2.2% Asian38 0.3% White alone, not Hispanic / Latino
Children Nativity (place of birth) in Lake Mary
Children under 6 years - Living with two parents Both parents native 556 100.0% NativeBoth parents foreign-born 327 83.3% Native65 16.7% Foreign-bornOne native, one foreign-born parent 97 100.0% NativeChildren under 6 years - Living with one parent Native parent 55 100.0% NativeChildren 6 to 17 years - Living with two parents Both parents native 774 98.7% Native10 1.3% Foreign-bornBoth parents foreign-born 174 76.3% Native54 23.7% Foreign-bornOne native, one foreign-born parent 405 100.0% NativeChildren 6 to 17 years - Living with one parent Native parent 612 100.0% NativeForeign-born parent 83 52.2% Native76 47.8% Foreign-born
Grandparents responsible for own grandchildren in Lake Mary
Grandparents (30 to 59 years) American Indian / Alaska Native 3 100.0% Responsible for grandchildrenAsian 40 100.0% Not responsible for grandchildrenOther race 6 100.0% Responsible for grandchildrenHispanic or Latino 8 100.0% Responsible for grandchildren
Grandparents (60 years and over) Asian 74 100.0% Not responsible for grandchildrenHispanic or Latino 65 100.0% Not responsible for grandchildren