Races in Lacey, Washington (WA) Detailed Stats
Data:
Races - White alone (%)
Races - White alone (% change since 2000)
Races - Black alone (%)
Races - Black alone (% change since 2000)
Races - American Indian alone (%)
Races - American Indian alone (% change since 2000)
Races - Asian alone (%)
Races - Asian alone (% change since 2000)
Races - Hispanic (%)
Races - Hispanic (% change since 2000)
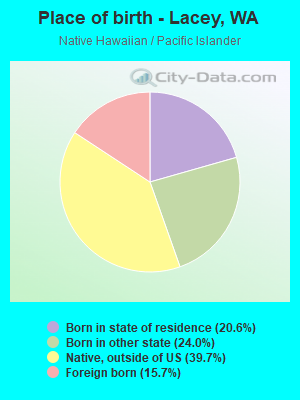
Races - Native Hawaiian and Other Pacific Islander alone (%)
Races - Native Hawaiian and Other Pacific Islander alone (% change since 2000)
Races - Two or more races(%)
Races - Two or more races(% change since 2000)
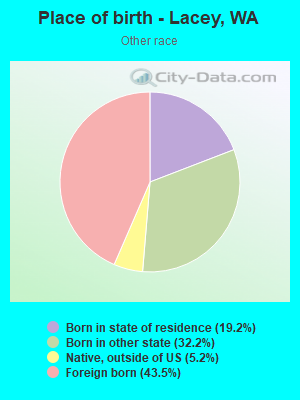
Races - Other race alone (%)
Races - Other race alone (% change since 2000)
Racial diversity
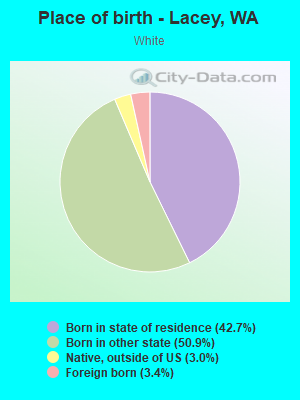
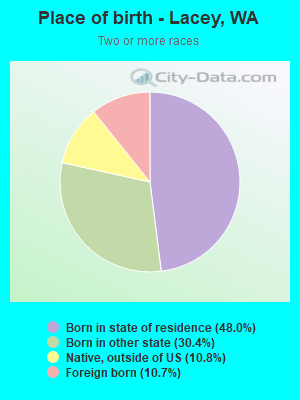
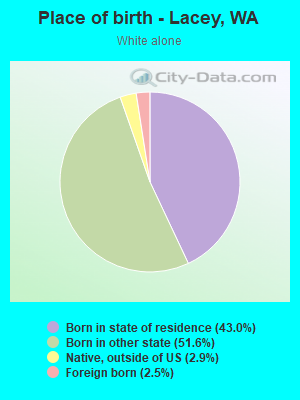
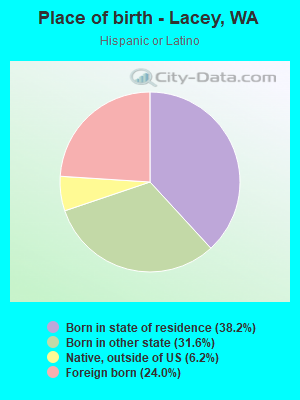
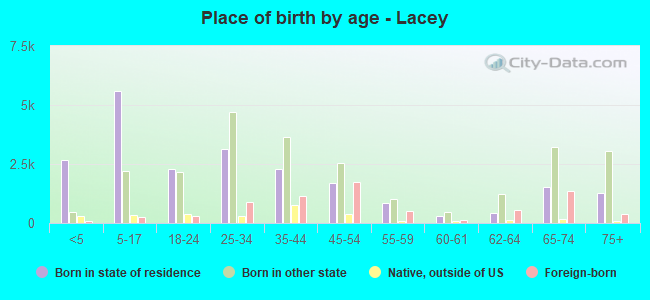
Place of birth - Born in state of residence (%)
Place of birth - Born in state of residence (%) - White
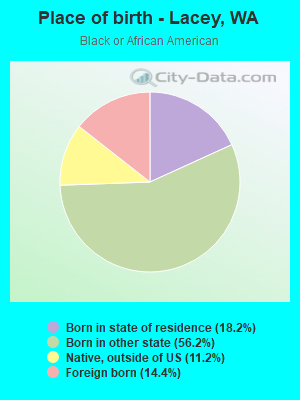
Place of birth - Born in state of residence (%) - Black or African American
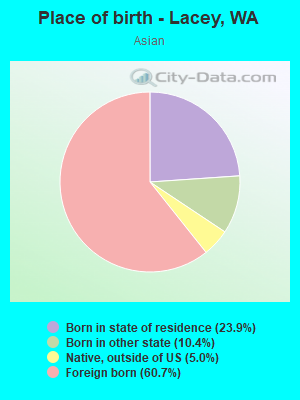
Place of birth - Born in state of residence (%) - Asian
Place of birth - Born in state of residence (%) - Hispanic or Latino
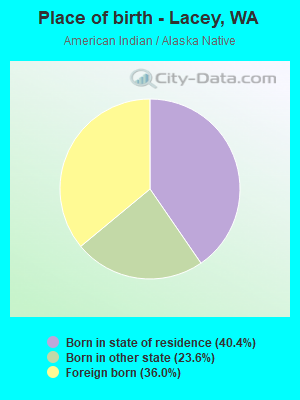
Place of birth - Born in state of residence (%) - American Indian and Alaska Native
Place of birth - Born in state of residence (%) - Multirace
Place of birth - Born in state of residence (%) - Other Race
Place of birth - Born in other state (%)
Place of birth - Born in other state (%) - White
Place of birth - Born in other state (%) - Black or African American
Place of birth - Born in other state (%) - Asian
Place of birth - Born in other state (%) - Hispanic or Latino
Place of birth - Born in other state (%) - American Indian and Alaska Native
Place of birth - Born in other state (%) - Multirace
Place of birth - Born in other state (%) - Other Race
Place of birth - Native, outside of US (%)
Place of birth - Native, outside of US (%) - White
Place of birth - Native, outside of US (%) - Black or African American
Place of birth - Native, outside of US (%) - Asian
Place of birth - Native, outside of US (%) - Hispanic or Latino
Place of birth - Native, outside of US (%) - American Indian and Alaska Native
Place of birth - Native, outside of US (%) - Multirace
Place of birth - Native, outside of US (%) - Other Race
Place of birth - Foreign born (%)
Place of birth - Foreign born (%) - White
Place of birth - Foreign born (%) - Black or African American
Place of birth - Foreign born (%) - Asian
Place of birth - Foreign born (%) - Hispanic or Latino
Place of birth - Foreign born (%) - American Indian and Alaska Native
Place of birth - Foreign born (%) - Multirace
Place of birth - Foreign born (%) - Other Race
Residents speaking English at home (%)
Residents speaking English at home - Born in the United States (%)
Residents speaking English at home - Native, born elsewhere (%)
Residents speaking English at home - Foreign born (%)
Residents speaking Spanish at home (%)
Residents speaking Spanish at home - Born in the United States (%)
Residents speaking Spanish at home - Native, born elsewhere (%)
Residents speaking Spanish at home - Foreign born (%)
Residents speaking other language at home (%)
Residents speaking other language at home - Born in the United States (%)
Residents speaking other language at home - Native, born elsewhere (%)
Residents speaking other language at home - Foreign born (%)
Marital status - Never married (%)
Marital status - Now married (%)
Marital status - Separated (%)
Marital status - Widowed (%)
Marital status - Divorced (%)
Ancestries Reported - Arab (%)
Ancestries Reported - Czech (%)
Ancestries Reported - Danish (%)
Ancestries Reported - Dutch (%)
Ancestries Reported - English (%)
Ancestries Reported - French (%)
Ancestries Reported - French Canadian (%)
Ancestries Reported - German (%)
Ancestries Reported - Greek (%)
Ancestries Reported - Hungarian (%)
Ancestries Reported - Irish (%)
Ancestries Reported - Italian (%)
Ancestries Reported - Lithuanian (%)
Ancestries Reported - Norwegian (%)
Ancestries Reported - Polish (%)
Ancestries Reported - Portuguese (%)
Ancestries Reported - Russian (%)
Ancestries Reported - Scotch-Irish (%)
Ancestries Reported - Scottish (%)
Ancestries Reported - Slovak (%)
Ancestries Reported - Subsaharan African (%)
Ancestries Reported - Swedish (%)
Ancestries Reported - Swiss (%)
Ancestries Reported - Ukrainian (%)
Ancestries Reported - United States (%)
Ancestries Reported - Welsh (%)
Ancestries Reported - West Indian (%)
Ancestries Reported - Other (%)
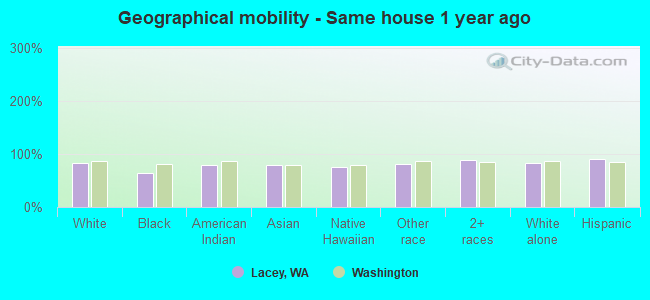
Geographical mobility - Same house 1 year ago (%)
Geographical mobility - Same house 1 year ago (%) - White
Geographical mobility - Same house 1 year ago (%) - Black or African American
Geographical mobility - Same house 1 year ago (%) - Asian
Geographical mobility - Same house 1 year ago (%) - Hispanic or Latino
Geographical mobility - Same house 1 year ago (%) - American Indian and Alaska Native
Geographical mobility - Same house 1 year ago (%) - Multirace
Geographical mobility - Same house 1 year ago (%) - Other Race
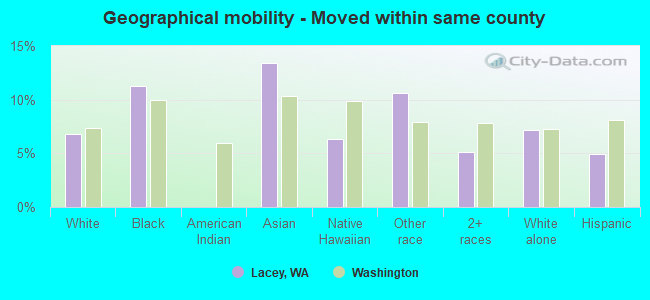
Geographical mobility - Moved within same county (%)
Geographical mobility - Moved within same county (%) - White
Geographical mobility - Moved within same county (%) - Black or African American
Geographical mobility - Moved within same county (%) - Asian
Geographical mobility - Moved within same county (%) - Hispanic or Latino
Geographical mobility - Moved within same county (%) - American Indian and Alaska Native
Geographical mobility - Moved within same county (%) - Multirace
Geographical mobility - Moved within same county (%) - Other Race
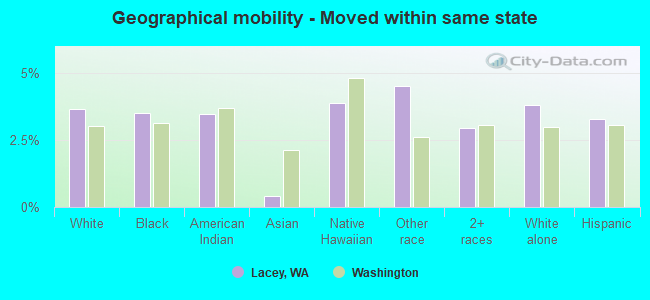
Geographical mobility - Moved from different county within same state (%)
Geographical mobility - Moved from different county within same state (%) - White
Geographical mobility - Moved from different county within same state (%) - Black or African American
Geographical mobility - Moved from different county within same state (%) - Asian
Geographical mobility - Moved from different county within same state (%) - Hispanic or Latino
Geographical mobility - Moved from different county within same state (%) - American Indian and Alaska Native
Geographical mobility - Moved from different county within same state (%) - Multirace
Geographical mobility - Moved from different county within same state (%) - Other Race
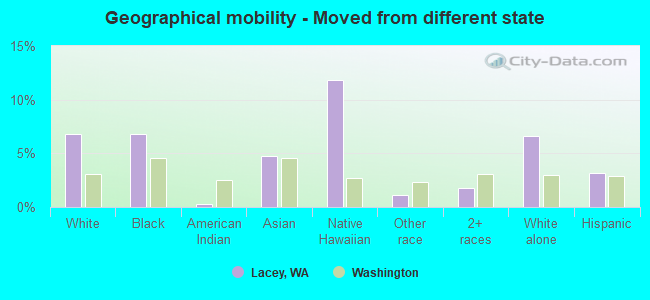
Geographical mobility - Moved from different state (%)
Geographical mobility - Moved from different state (%) - White
Geographical mobility - Moved from different state (%) - Black or African American
Geographical mobility - Moved from different state (%) - Asian
Geographical mobility - Moved from different state (%) - Hispanic or Latino
Geographical mobility - Moved from different state (%) - American Indian and Alaska Native
Geographical mobility - Moved from different state (%) - Multirace
Geographical mobility - Moved from different state (%) - Other Race
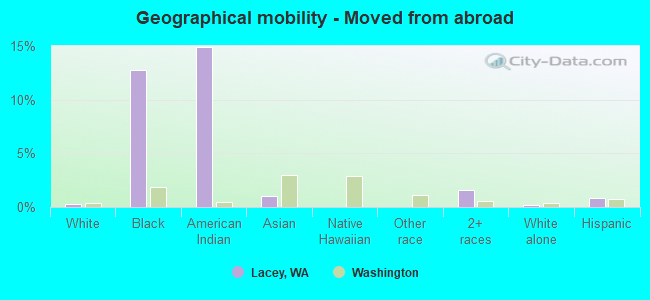
Geographical mobility - Moved from abroad (%)
Geographical mobility - Moved from abroad (%) - White
Geographical mobility - Moved from abroad (%) - Black or African American
Geographical mobility - Moved from abroad (%) - Asian
Geographical mobility - Moved from abroad (%) - Hispanic or Latino
Geographical mobility - Moved from abroad (%) - American Indian and Alaska Native
Geographical mobility - Moved from abroad (%) - Multirace
Geographical mobility - Moved from abroad (%) - Other Race
Place of birth for the foreign-born population - Ireland (%)
Place of birth for the foreign-born population - Denmark (%)
Place of birth for the foreign-born population - Norway (%)
Place of birth for the foreign-born population - Sweden (%)
Place of birth for the foreign-born population - United Kingdom (%)
Place of birth for the foreign-born population - England (%)
Place of birth for the foreign-born population - Scotland (%)
Place of birth for the foreign-born population - Other Northern Europe (%)
Place of birth for the foreign-born population - Austria (%)
Place of birth for the foreign-born population - Belgium (%)
Place of birth for the foreign-born population - France (%)
Place of birth for the foreign-born population - Germany (%)
Place of birth for the foreign-born population - Netherlands (%)
Place of birth for the foreign-born population - Switzerland (%)
Place of birth for the foreign-born population - Other Western Europe (%)
Place of birth for the foreign-born population - Greece (%)
Place of birth for the foreign-born population - Italy (%)
Place of birth for the foreign-born population - Portugal (%)
Place of birth for the foreign-born population - Spain (%)
Place of birth for the foreign-born population - Other Southern Europe (%)
Place of birth for the foreign-born population - Albania (%)
Place of birth for the foreign-born population - Belarus (%)
Place of birth for the foreign-born population - Bosnia and Herzegovina (%)
Place of birth for the foreign-born population - Bulgaria (%)
Place of birth for the foreign-born population - Croatia (%)
Place of birth for the foreign-born population - Czechoslovakia (%)
Place of birth for the foreign-born population - Hungary (%)
Place of birth for the foreign-born population - Latvia (%)
Place of birth for the foreign-born population - Lithuania (%)
Place of birth for the foreign-born population - North Macedonia (Macedonia) (%)
Place of birth for the foreign-born population - Moldova (%)
Place of birth for the foreign-born population - Poland (%)
Place of birth for the foreign-born population - Romania (%)
Place of birth for the foreign-born population - Russia (%)
Place of birth for the foreign-born population - Serbia (%)
Place of birth for the foreign-born population - Ukraine (%)
Place of birth for the foreign-born population - Other Eastern Europe (%)
Place of birth for the foreign-born population - China (%)
Place of birth for the foreign-born population - Hong Kong (%)
Place of birth for the foreign-born population - Taiwan (%)
Place of birth for the foreign-born population - Japan (%)
Place of birth for the foreign-born population - Korea (%)
Place of birth for the foreign-born population - Other Eastern Asia (%)
Place of birth for the foreign-born population - Afghanistan (%)
Place of birth for the foreign-born population - Bangladesh (%)
Place of birth for the foreign-born population - India (%)
Place of birth for the foreign-born population - Iran (%)
Place of birth for the foreign-born population - Kazakhstan (%)
Place of birth for the foreign-born population - Nepal (%)
Place of birth for the foreign-born population - Pakistan (%)
Place of birth for the foreign-born population - Sri Lanka (%)
Place of birth for the foreign-born population - Uzbekistan (%)
Place of birth for the foreign-born population - Other South Central Asia (%)
Place of birth for the foreign-born population - Burma (%)
Place of birth for the foreign-born population - Cambodia (%)
Place of birth for the foreign-born population - Indonesia (%)
Place of birth for the foreign-born population - Laos (%)
Place of birth for the foreign-born population - Malaysia (%)
Place of birth for the foreign-born population - Philippines (%)
Place of birth for the foreign-born population - Singapore (%)
Place of birth for the foreign-born population - Thailand (%)
Place of birth for the foreign-born population - Vietnam (%)
Place of birth for the foreign-born population - Other South Eastern Asia (%)
Place of birth for the foreign-born population - Armenia (%)
Place of birth for the foreign-born population - Iraq (%)
Place of birth for the foreign-born population - Israel (%)
Place of birth for the foreign-born population - Jordan (%)
Place of birth for the foreign-born population - Kuwait (%)
Place of birth for the foreign-born population - Lebanon (%)
Place of birth for the foreign-born population - Saudi Arabia (%)
Place of birth for the foreign-born population - Syria (%)
Place of birth for the foreign-born population - Turkey (%)
Place of birth for the foreign-born population - Yemen (%)
Place of birth for the foreign-born population - Other Western Asia (%)
Place of birth for the foreign-born population - Eritrea (%)
Place of birth for the foreign-born population - Ethiopia (%)
Place of birth for the foreign-born population - Kenya (%)
Place of birth for the foreign-born population - Somalia (%)
Place of birth for the foreign-born population - Uganda (%)
Place of birth for the foreign-born population - Zimbabwe (%)
Place of birth for the foreign-born population - Other Eastern Africa (%)
Place of birth for the foreign-born population - Cameroon (%)
Place of birth for the foreign-born population - Congo (%)
Place of birth for the foreign-born population - Democratic Republic of Congo (Zaire) (%)
Place of birth for the foreign-born population - Other Middle Africa (%)
Place of birth for the foreign-born population - Egypt (%)
Place of birth for the foreign-born population - Morocco (%)
Place of birth for the foreign-born population - Sudan (%)
Place of birth for the foreign-born population - Other Northern Africa (%)
Place of birth for the foreign-born population - South Africa (%)
Place of birth for the foreign-born population - Other Southern Africa (%)
Place of birth for the foreign-born population - Cabo Verde (%)
Place of birth for the foreign-born population - Ghana (%)
Place of birth for the foreign-born population - Liberia (%)
Place of birth for the foreign-born population - Nigeria (%)
Place of birth for the foreign-born population - Senegal (%)
Place of birth for the foreign-born population - Sierra Leone (%)
Place of birth for the foreign-born population - Other Western Africa (%)
Place of birth for the foreign-born population - Australia (%)
Place of birth for the foreign-born population - New Zealand (%)
Place of birth for the foreign-born population - Fiji (%)
Place of birth for the foreign-born population - Micronesia (%)
Place of birth for the foreign-born population - Bahamas (%)
Place of birth for the foreign-born population - Barbados (%)
Place of birth for the foreign-born population - Cuba (%)
Place of birth for the foreign-born population - Dominica (%)
Place of birth for the foreign-born population - Dominican Republic (%)
Place of birth for the foreign-born population - Grenada (%)
Place of birth for the foreign-born population - Haiti (%)
Place of birth for the foreign-born population - Jamaica (%)
Place of birth for the foreign-born population - St. Vincent and the Grenadines (%)
Place of birth for the foreign-born population - Trinidad and Tobago (%)
Place of birth for the foreign-born population - West Indies (%)
Place of birth for the foreign-born population - Other Caribbean (%)
Place of birth for the foreign-born population - Belize (%)
Place of birth for the foreign-born population - Costa Rica (%)
Place of birth for the foreign-born population - El Salvador (%)
Place of birth for the foreign-born population - Guatemala (%)
Place of birth for the foreign-born population - Honduras (%)
Place of birth for the foreign-born population - Mexico (%)
Place of birth for the foreign-born population - Nicaragua (%)
Place of birth for the foreign-born population - Panama (%)
Place of birth for the foreign-born population - Other Central America (%)
Place of birth for the foreign-born population - Argentina (%)
Place of birth for the foreign-born population - Bolivia (%)
Place of birth for the foreign-born population - Brazil (%)
Place of birth for the foreign-born population - Chile (%)
Place of birth for the foreign-born population - Colombia (%)
Place of birth for the foreign-born population - Ecuador (%)
Place of birth for the foreign-born population - Guyana (%)
Place of birth for the foreign-born population - Peru (%)
Place of birth for the foreign-born population - Uruguay (%)
Place of birth for the foreign-born population - Venezuela (%)
Place of birth for the foreign-born population - Other South America (%)
Place of birth for the foreign-born population - Canada (%)
Place of birth for the foreign-born population - Other Northern America (%)
Place of birth for the foreign-born population - Other (%)
Latest news about races in Lacey, WA collected exclusively by city-data.com from local newspapers, TV, and radio stations
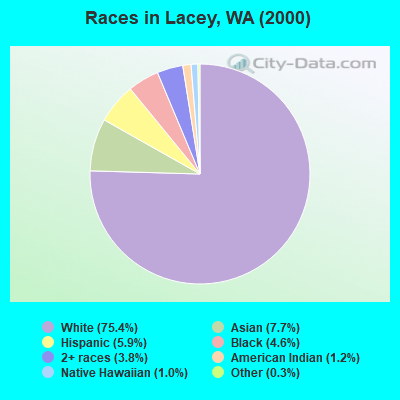
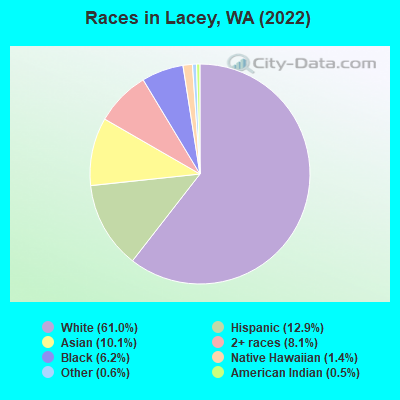
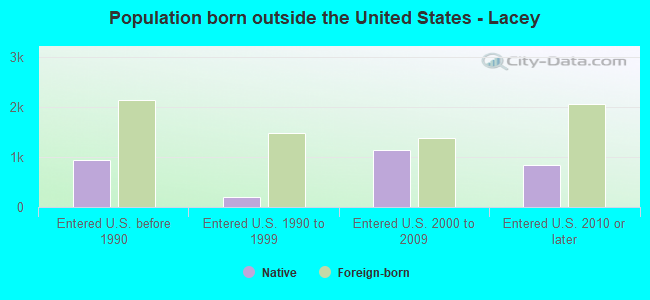
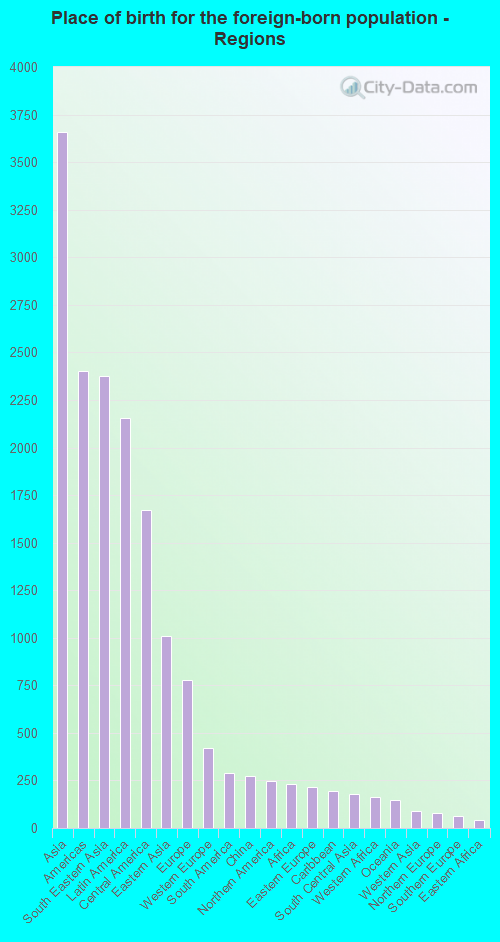
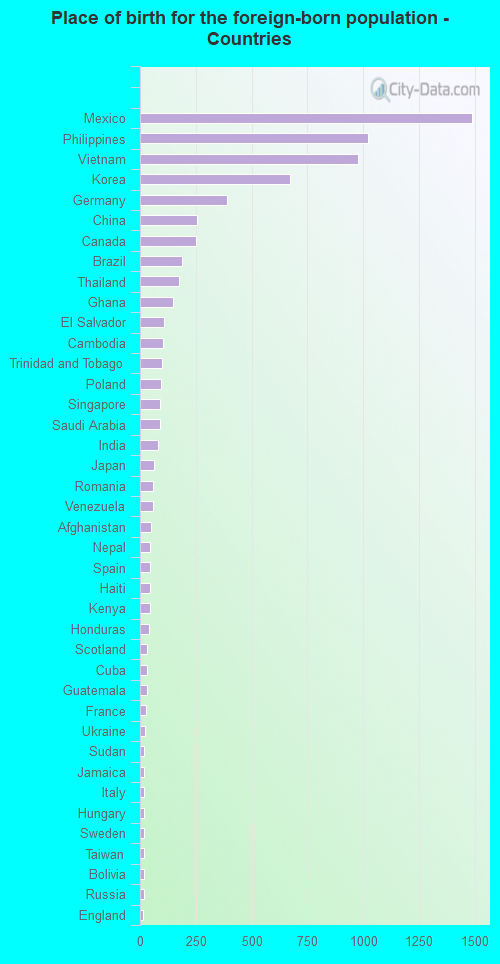
According to 2022 data, the most numerous races in Lacey, WA are White alone (34,819 residents), Hispanic (7,372 residents), and Asian alone (5,748 residents). 82.0% of Lacey residents speak English at home. 12.6% of Lacey, WA residents are foreign-born (6.3% born in Asia, 3.7% born in Latin America, 1.3% born in Europe), which is 18.7% less than the foreign-born rate of 15.0% across the entire state of Washington.
Race distribution in Lacey
2000 2022
23,560 75.4% White alone 2,392 7.7% Asian alone 1,843 5.9% Hispanic 1,449 4.6% Black alone 1,179 3.8% Two or more races 382 1.2% American Indian alone 326 1.0% Native Hawaiian and Other 95 0.3% Other race alone
34,819 61.0% White alone 7,372 12.9% Hispanic 5,748 10.1% Asian alone 4,655 8.1% Two or more races 3,543 6.2% Black alone 820 1.4% Native Hawaiian and Other 316 0.6% Other race alone 271 0.5% American Indian alone
2000 2022
4,652,490 78.9% White alone 441,509 7.5% Hispanic 319,401 5.4% Asian alone 184,631 3.1% Black alone 175,926 3.0% Two or more races 85,396 1.4% American Indian alone 22,779 0.4% Native Hawaiian and Other 11,989 0.2% Other race alone
4,941,456 63.5% White alone 1,093,313 14.0% Hispanic 755,832 9.7% Asian alone 523,448 6.7% Two or more races 299,537 3.8% Black alone 69,024 0.9% American Indian alone 52,231 0.7% Native Hawaiian and Other 50,945 0.7% Other race alone
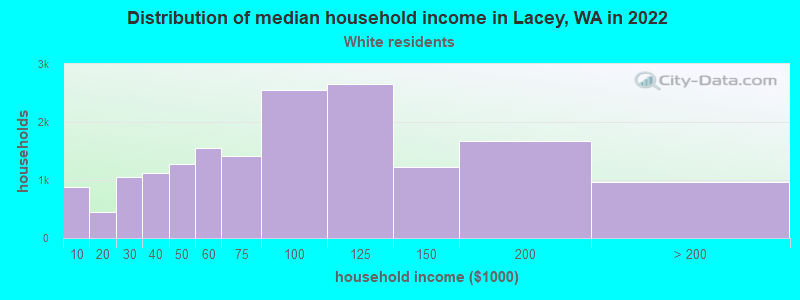
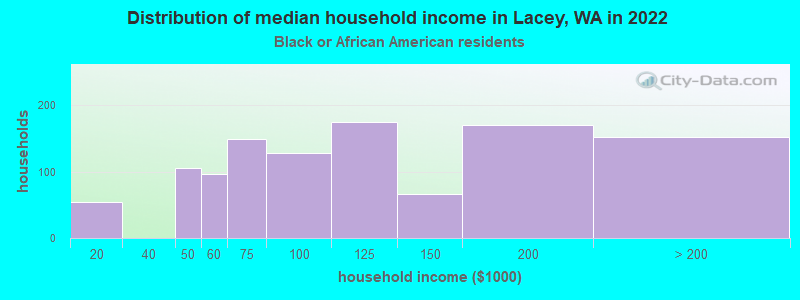
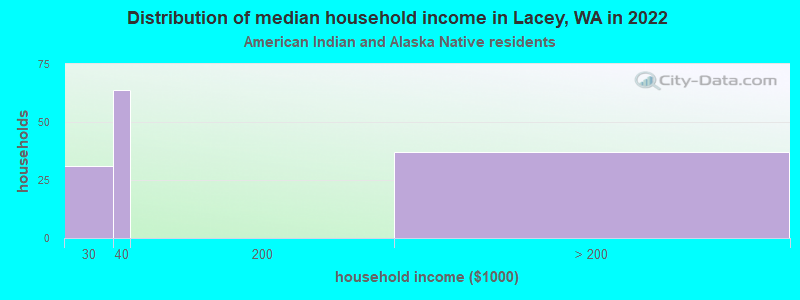
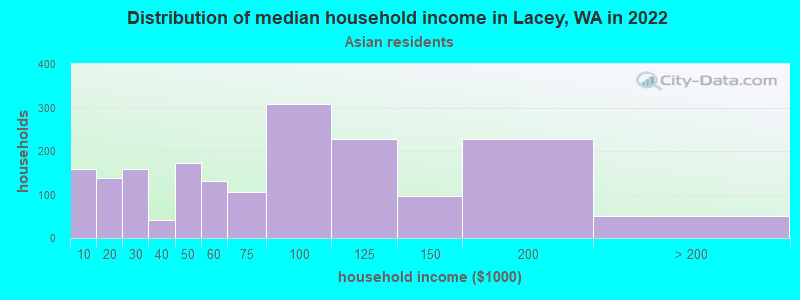
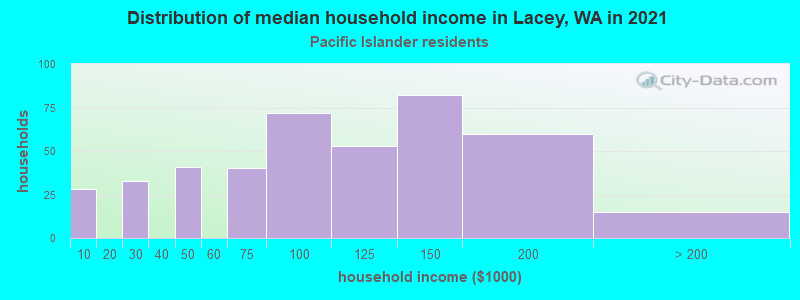
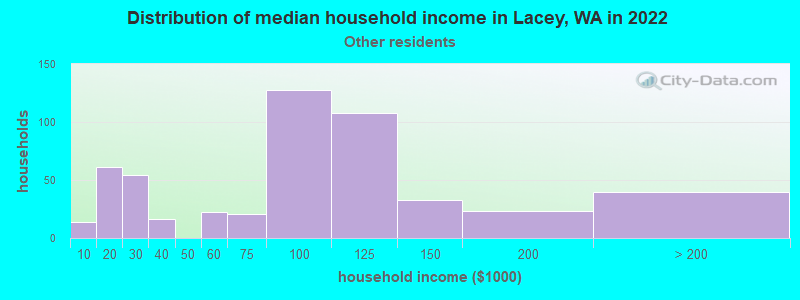
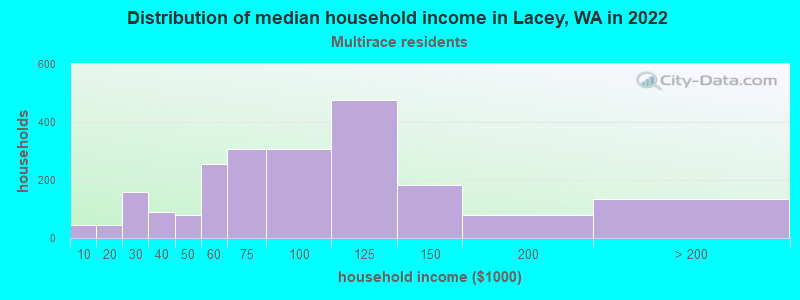
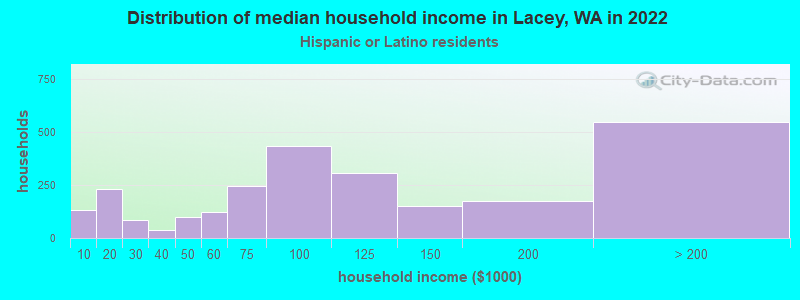
Income and house value in Lacey Median household income in 2022 $78,607 White non-Hispanic householders$86,275 Black householders$75,767 Asian householders$105,127 Native Hawaiian and other Pacific Islander householders$57,780 Some other race householders$80,350 Two or more races householders$91,374 Hispanic or Latino race householdersMedian 2022 house value $464,445 White Non-Hispanic householders$511,206 Black or African American householders$446,515 American Indian or Alaska Native householders $488,002 Asian householders$579,063 Native Hawaiian and other Pacific Islander householders$412,059 Some other race householders$417,684 Two or more races householders$460,930 Hispanic or Latino householders
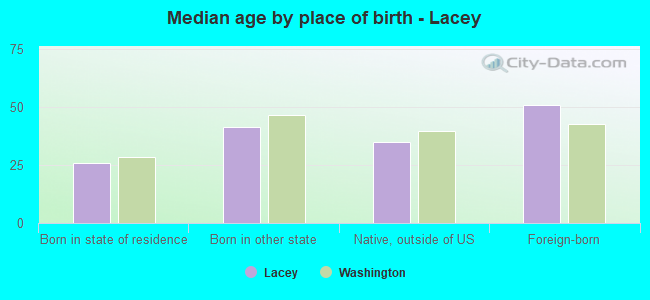
Median age by race in Lacey
38.8 Median age for White residents37.5 41.3 32.2 Median age for Black or African American residents32.3 35.1 30.6 Median age for American Indian / Alaska Native residents12.1 33.7 40.6 Median age for Asian residents36.9 42.6 44.7 Median age for Native Hawaiian / Pacific Islander residents46.8 43.9 41.9 Median age for Other race residents45.4 44.7 23.7 Median age for Two or more races residents23.9 23.8 39.4 Median age for White alone residents38.2 42.2 28.8 Median age for Hispanic or Latino residents28.3 29.9
Owner/renter occupied households by race in Lacey
House owners and renters - White residents 9,340 55.9% Owner occupied7,368 44.1% Renter occupiedHouse owners and renters - Black or African American residents 676 56.3% Owner occupied525 43.7% Renter occupiedHouse owners and renters - American Indian / Alaska Native residents 82 46.4% Owner occupied95 53.6% Renter occupiedHouse owners and renters - Asian residents 1,308 73.1% Owner occupied481 26.9% Renter occupiedHouse owners and renters - Native Hawaiian / Pacific Islander residents 399 64.9% Owner occupied216 35.1% Renter occupiedHouse owners and renters - Other race residents 247 50.0% Owner occupied247 50.0% Renter occupiedHouse owners and renters - Two or more races residents 1,204 59.3% Owner occupied825 40.7% Renter occupiedHouse owners and renters - White alone residents 8,828 55.6% Owner occupied7,048 44.4% Renter occupiedHouse owners and renters - Hispanic or Latino residents 1,529 64.0% Owner occupied859 36.0% Renter occupied
Language usage in Lacey
English speakers - Total 82.0% of residents of Lacey speak English at home.
5.8% of residents speak Spanish at home 1,690 54.4% Speak English very well1,419 45.6% Speak English less than very well12.1% of residents speak other language at home 4,001 61.5% Speak English very well2,506 38.5% Speak English less than very well
English speakers - Born in the United States 93.3% of residents of Lacey speak English at home.
3.6% of residents speak Spanish at home 489 56.4% Speak English very well378 43.6% Speak English less than very well2.9% of residents speak other language at home 646 93.1% Speak English very well48 6.9% Speak English less than very well
English speakers - Native, born elsewhere 61.7% of residents of Lacey speak English at home.
7.6% of residents speak Spanish at home 110 52.6% Speak English very well99 47.4% Speak English less than very well32.6% of residents speak other language at home 762 84.7% Speak English very well138 15.3% Speak English less than very well
English speakers - Foreign-born 21.4% of residents of Lacey speak English at home.
18.6% of residents speak Spanish at home 532 40.4% Speak English very well785 59.6% Speak English less than very well60.2% of residents speak other language at home 1,965 46.1% Speak English very well2,297 53.9% Speak English less than very well
White (Caucasian) - Speak only English Native:
95.6% (32,639)Foreign-born:
36.4% (466)
White (Caucasian) - Speak another language Native:
3.5% (1,199)Foreign-born:
62.3% (799)
Black or African American - Speak only English Native:
100.0% (2,427)Foreign-born:
47.5% (197)
Black or African American - Speak another language Native:
1.1% (27)Foreign-born:
55.8% (232)
American Indian / Alaska Native - Speak only English Native:
53.6% (183)Foreign-born:
30.3% (34)
American Indian / Alaska Native - Speak another language Native:
52.1% (178)Foreign-born:
58.0% (66)
Asian - Speak only English Native:
57.2% (1,138)Foreign-born:
15.5% (542)
Asian - Speak another language Native:
34.3% (683)Foreign-born:
84.5% (2,957)
Native Hawaiian / Pacific Islander - Speak only English Native:
66.2% (493)Foreign-born:
29.2% (37)
Native Hawaiian / Pacific Islander - Speak another language Native:
33.1% (246)Foreign-born:
71.6% (91)
Other race - Speak only English Native:
87.1% (683)Foreign-born:
28.8% (205)
Other race - Speak another language Native:
18.3% (144)Foreign-born:
56.9% (405)
Two or more races - Speak only English Native:
78.8% (4,986)Foreign-born:
13.4% (118)
Two or more races - Speak another language Native:
23.6% (1,494)Foreign-born:
87.2% (767)
White alone - Speak only English Native:
97.2% (31,488)Foreign-born:
53.4% (459)
White alone - Speak another language Native:
2.4% (763)Foreign-born:
46.4% (398)
Hispanic or Latino - Speak only English Native:
64.7% (3,200)Foreign-born:
21.5% (376)
Hispanic or Latino - Speak another language Native:
33.8% (1,670)Foreign-born:
78.9% (1,385)
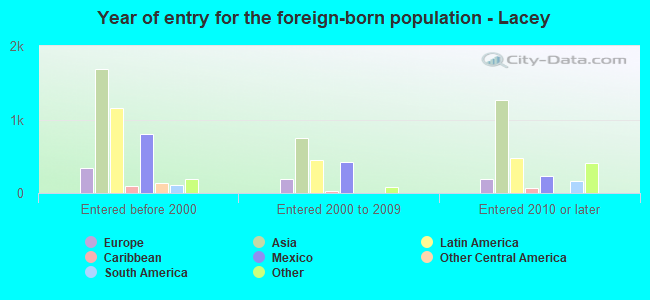
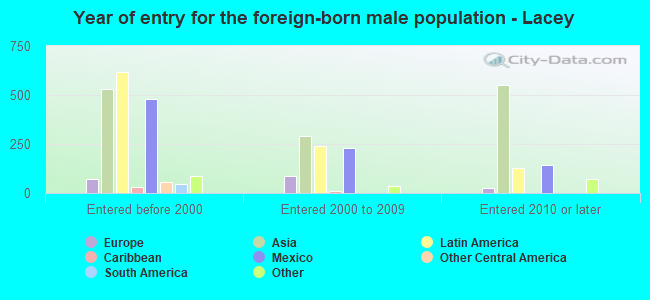
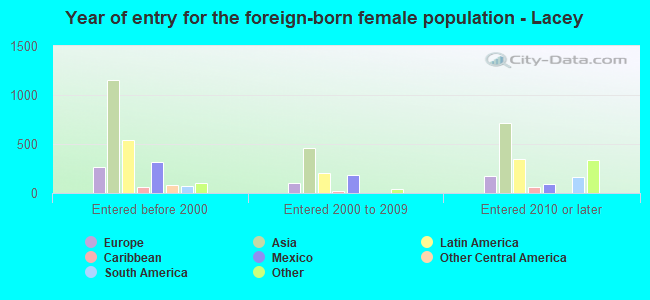
Foreign-born residents in Lacey 7,219 residents are foreign born (6.3% Asia , 3.7% Latin America , 1.3% Europe ).
This city:
12.6%Washington:
14.9%
Marital status for residents in Lacey Marital status - White (Caucasian) population 15 years and over
Males 33.8% Never married52.3% Now married1.5% Separated2.6% Widowed9.7% DivorcedFemales 24.0% Never married46.0% Now married1.1% Separated11.8% Widowed17.0% DivorcedWomen who gave birth in the past 12 months Now married:
51.3% (153)Unmarried:
48.7% (145)
Women who did not give birth in the past 12 months Now married:
45.9% (3,932)Unmarried:
54.1% (4,636)
Marital status - Black or African American population 15 years and over
Males 37.2% Never married46.8% Now married0.0% Separated0.0% Widowed16.0% DivorcedFemales 47.3% Never married32.5% Now married3.2% Separated4.2% Widowed12.8% DivorcedWomen who gave birth in the past 12 months Now married:
90.9% (12)Unmarried:
9.1% (1)
Women who did not give birth in the past 12 months Now married:
36.1% (284)Unmarried:
63.9% (501)
Marital status - American Indian / Alaska Native population 15 years and over
Males 20.9% Never married79.1% Now married0.0% Separated0.0% Widowed0.0% DivorcedFemales 29.2% Never married62.3% Now married0.0% Separated0.0% Widowed8.5% DivorcedWomen who gave birth in the past 12 months Now married:
0.0% (0)Unmarried:
100.0% (13)
Women who did not give birth in the past 12 months Now married:
44.6% (53)Unmarried:
55.4% (66)
Marital status - Asian population 15 years and over
Males 25.9% Never married64.5% Now married1.9% Separated3.3% Widowed4.4% DivorcedFemales 25.8% Never married53.7% Now married0.8% Separated8.2% Widowed11.5% DivorcedWomen who did not give birth in the past 12 months Now married:
56.1% (1,072)Unmarried:
43.9% (838)
Marital status - Native Hawaiian / Pacific Islander population 15 years and over
Males 17.7% Never married74.4% Now married0.0% Separated0.0% Widowed7.9% DivorcedFemales 34.6% Never married50.3% Now married0.0% Separated6.3% Widowed8.7% DivorcedWomen who did not give birth in the past 12 months Now married:
43.9% (97)Unmarried:
56.1% (123)
Marital status - Other race population 15 years and over
Males 30.7% Never married60.5% Now married0.0% Separated0.0% Widowed8.8% DivorcedFemales 30.9% Never married55.9% Now married6.6% Separated0.0% Widowed6.6% DivorcedWomen who did not give birth in the past 12 months Now married:
61.7% (219)Unmarried:
38.3% (136)
Marital status - Two or more races population 15 years and over
Males 43.9% Never married48.2% Now married1.9% Separated0.0% Widowed6.0% DivorcedFemales 39.9% Never married45.5% Now married1.2% Separated4.3% Widowed9.1% DivorcedWomen who gave birth in the past 12 months Now married:
71.3% (87)Unmarried:
28.7% (35)
Women who did not give birth in the past 12 months Now married:
43.0% (890)Unmarried:
57.0% (1,182)
Marital status - White alone, not Hispanic / Latino population 15 years and over
Males 33.6% Never married52.2% Now married1.5% Separated2.8% Widowed9.9% DivorcedFemales 22.7% Never married46.0% Now married0.9% Separated12.7% Widowed17.7% DivorcedWomen who gave birth in the past 12 months Now married:
57.7% (155)Unmarried:
42.3% (114)
Women who did not give birth in the past 12 months Now married:
46.1% (3,575)Unmarried:
53.9% (4,178)
Marital status - Hispanic or Latino population 15 years and over
Males 39.8% Never married54.4% Now married0.9% Separated0.0% Widowed4.9% DivorcedFemales 39.1% Never married48.7% Now married4.3% Separated1.3% Widowed6.7% DivorcedWomen who gave birth in the past 12 months Now married:
42.0% (33)Unmarried:
58.0% (46)
Women who did not give birth in the past 12 months Now married:
48.0% (886)Unmarried:
52.0% (961)
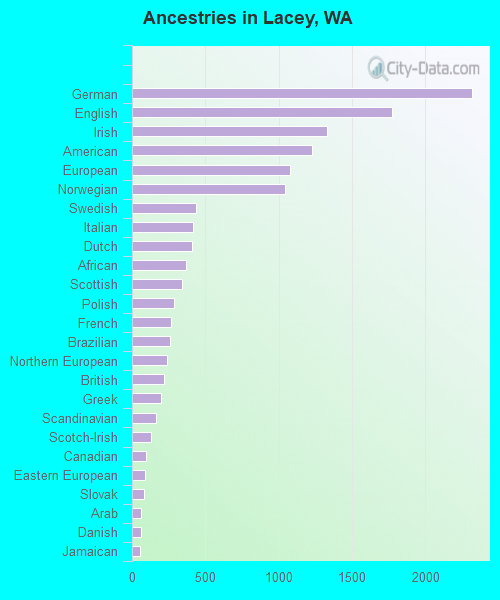
Ancestries in Lacey
2,320 8.7% German1,775 6.6% English1,329 5.0% Irish1,227 4.6% American1,078 4.0% European1,041 3.9% Norwegian439 1.6% Swedish417 1.6% Italian411 1.5% Dutch366 1.4% African343 1.3% Scottish288 1.1% Polish269 1.0% French260 1.0% Brazilian236 0.9% Northern European215 0.8% British196 0.7% Greek167 0.6% Scandinavian128 0.5% Scotch-Irish93 0.3% Canadian87 0.3% Eastern European79 0.3% Slovak63 0.2% Arab63 0.2% Danish54 0.2% Jamaican52 0.2% French Canadian47 0.2% Finnish46 0.2% Hungarian38 0.1% Afghan38 0.1% Ukrainian35 0.1% Welsh32 0.1% Lithuanian28 0.1% Russian27 0.1% Austrian22 0.08% West Indian21 0.08% Romanian19 0.07% Kenyan18 0.07% Pennsylvania German17 0.06% German Russian17 0.06% Portuguese16 0.06% Lebanese12 0.04% Icelander11 0.04% Czechoslovakian10 0.04% Swiss8 0.03% Basque8 0.03% Celtic3 0.01% Assyrian
Geographical mobility in Lacey Same house 1 year ago 30,638 82.9% White (Caucasian)2,381 63.6% Black or African American365 79.7% American Indian / Alaska Native4,508 79.0% Asian675 75.2% Native Hawaiian / Pacific Islander1,368 82.0% Other race7,165 89.3% Two or more races28,509 82.5% White alone, not Hispanic / Latino6,634 90.0% Hispanic or LatinoMoved within same county 2,511 6.8% White / Caucasian422 11.3% Black or African American768 13.4% Asian57 6.4% Native Hawaiian / Pacific Islander178 10.7% Other race413 5.1% Two or more races2,465 7.1% White alone, not Hispanic / Latino363 4.9% Hispanic or LatinoMoved within same state 1,346 3.6% White / Caucasian131 3.5% Black or African American16 3.5% American Indian / Alaska Native22 0.4% Asian35 3.9% Native Hawaiian / Pacific Islander75 4.5% Other race236 2.9% Two or more races1,309 3.8% White alone, not Hispanic / Latino240 3.3% Hispanic or LatinoMoved from different state 2,521 6.8% White / Caucasian255 6.8% Black or African American1 0.3% American Indian / Alaska Native270 4.7% Asian106 11.8% Native Hawaiian / Pacific Islander19 1.2% Other race144 1.8% Two or more races2,289 6.6% White alone, not Hispanic / Latino233 3.2% Hispanic or LatinoMoved from abroad 118 0.3% White477 12.7% Black or African American68 14.9% American Indian / Alaska Native57 1.0% Asian124 1.5% Two or more races55 0.2% White alone, not Hispanic / Latino58 0.8% Hispanic or Latino
Children Nativity (place of birth) in Lacey
Children under 6 years - Living with two parents Both parents native 1,967 100.0% NativeBoth parents foreign-born 144 100.0% NativeOne native, one foreign-born parent 429 100.0% NativeChildren under 6 years - Living with one parent Native parent 856 100.0% NativeForeign-born parent 385 100.0% NativeChildren 6 to 17 years - Living with two parents Both parents native 3,155 100.0% NativeBoth parents foreign-born 393 53.0% Native348 47.0% Foreign-bornOne native, one foreign-born parent 616 93.6% Native42 6.4% Foreign-bornChildren 6 to 17 years - Living with one parent Native parent 2,437 100.0% NativeForeign-born parent 314 60.8% Native202 39.2% Foreign-born
Grandparents responsible for own grandchildren in Lacey
Grandparents (30 to 59 years) White / Caucasian 124 50.1% Responsible for grandchildren124 49.9% Not responsible for grandchildrenAsian 8 7.4% Responsible for grandchildren94 92.6% Not responsible for grandchildrenWhite alone, not Hispanic / Latino 124 63.0% Responsible for grandchildren73 37.0% Not responsible for grandchildrenHispanic or Latino 53 100.0% Not responsible for grandchildrenGrandparents (60 years and over) White / Caucasian 41 22.0% Responsible for grandchildren144 78.0% Not responsible for grandchildrenAsian 26 19.5% Responsible for grandchildren108 80.5% Not responsible for grandchildrenWhite alone, not Hispanic / Latino 41 20.6% Responsible for grandchildren157 79.4% Not responsible for grandchildren