Races in Kiryas Joel, New York (NY) Detailed Stats
Data:
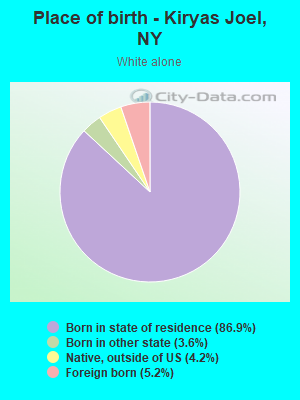
Races - White alone (%)
Races - White alone (% change since 2000)
Races - Black alone (%)
Races - Black alone (% change since 2000)
Races - American Indian alone (%)
Races - American Indian alone (% change since 2000)
Races - Asian alone (%)
Races - Asian alone (% change since 2000)
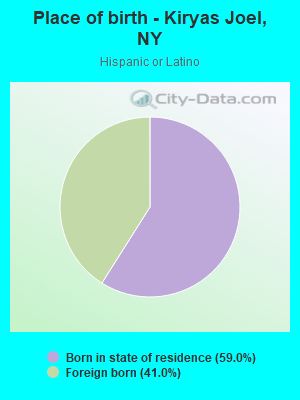
Races - Hispanic (%)
Races - Hispanic (% change since 2000)
Races - Native Hawaiian and Other Pacific Islander alone (%)
Races - Native Hawaiian and Other Pacific Islander alone (% change since 2000)
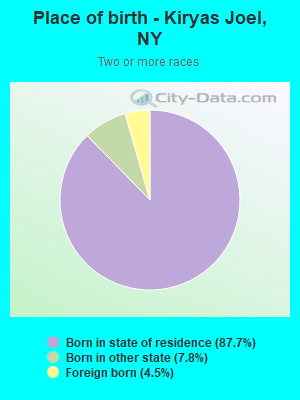
Races - Two or more races(%)
Races - Two or more races(% change since 2000)
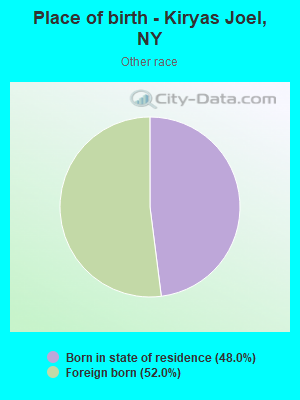
Races - Other race alone (%)
Races - Other race alone (% change since 2000)
Racial diversity
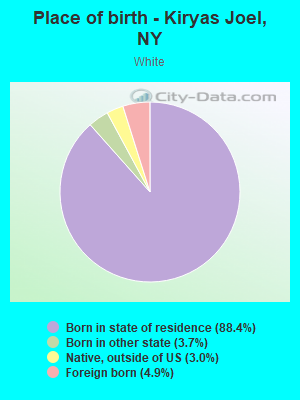
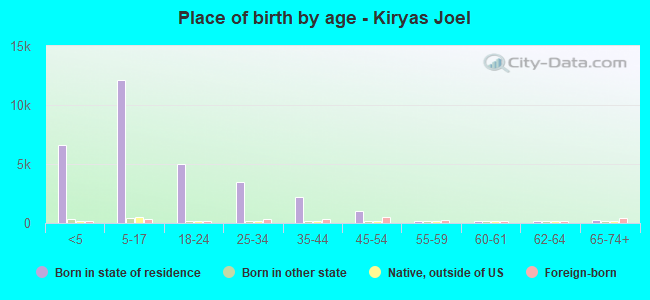
Place of birth - Born in state of residence (%)
Place of birth - Born in state of residence (%) - White
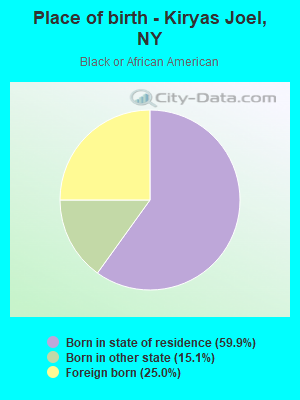
Place of birth - Born in state of residence (%) - Black or African American
Place of birth - Born in state of residence (%) - Asian
Place of birth - Born in state of residence (%) - Hispanic or Latino
Place of birth - Born in state of residence (%) - American Indian and Alaska Native
Place of birth - Born in state of residence (%) - Multirace
Place of birth - Born in state of residence (%) - Other Race
Place of birth - Born in other state (%)
Place of birth - Born in other state (%) - White
Place of birth - Born in other state (%) - Black or African American
Place of birth - Born in other state (%) - Asian
Place of birth - Born in other state (%) - Hispanic or Latino
Place of birth - Born in other state (%) - American Indian and Alaska Native
Place of birth - Born in other state (%) - Multirace
Place of birth - Born in other state (%) - Other Race
Place of birth - Native, outside of US (%)
Place of birth - Native, outside of US (%) - White
Place of birth - Native, outside of US (%) - Black or African American
Place of birth - Native, outside of US (%) - Asian
Place of birth - Native, outside of US (%) - Hispanic or Latino
Place of birth - Native, outside of US (%) - American Indian and Alaska Native
Place of birth - Native, outside of US (%) - Multirace
Place of birth - Native, outside of US (%) - Other Race
Place of birth - Foreign born (%)
Place of birth - Foreign born (%) - White
Place of birth - Foreign born (%) - Black or African American
Place of birth - Foreign born (%) - Asian
Place of birth - Foreign born (%) - Hispanic or Latino
Place of birth - Foreign born (%) - American Indian and Alaska Native
Place of birth - Foreign born (%) - Multirace
Place of birth - Foreign born (%) - Other Race
Residents speaking English at home (%)
Residents speaking English at home - Born in the United States (%)
Residents speaking English at home - Native, born elsewhere (%)
Residents speaking English at home - Foreign born (%)
Residents speaking Spanish at home (%)
Residents speaking Spanish at home - Born in the United States (%)
Residents speaking Spanish at home - Native, born elsewhere (%)
Residents speaking Spanish at home - Foreign born (%)
Residents speaking other language at home (%)
Residents speaking other language at home - Born in the United States (%)
Residents speaking other language at home - Native, born elsewhere (%)
Residents speaking other language at home - Foreign born (%)
Marital status - Never married (%)
Marital status - Now married (%)
Marital status - Separated (%)
Marital status - Widowed (%)
Marital status - Divorced (%)
Ancestries Reported - Arab (%)
Ancestries Reported - Czech (%)
Ancestries Reported - Danish (%)
Ancestries Reported - Dutch (%)
Ancestries Reported - English (%)
Ancestries Reported - French (%)
Ancestries Reported - French Canadian (%)
Ancestries Reported - German (%)
Ancestries Reported - Greek (%)
Ancestries Reported - Hungarian (%)
Ancestries Reported - Irish (%)
Ancestries Reported - Italian (%)
Ancestries Reported - Lithuanian (%)
Ancestries Reported - Norwegian (%)
Ancestries Reported - Polish (%)
Ancestries Reported - Portuguese (%)
Ancestries Reported - Russian (%)
Ancestries Reported - Scotch-Irish (%)
Ancestries Reported - Scottish (%)
Ancestries Reported - Slovak (%)
Ancestries Reported - Subsaharan African (%)
Ancestries Reported - Swedish (%)
Ancestries Reported - Swiss (%)
Ancestries Reported - Ukrainian (%)
Ancestries Reported - United States (%)
Ancestries Reported - Welsh (%)
Ancestries Reported - West Indian (%)
Ancestries Reported - Other (%)
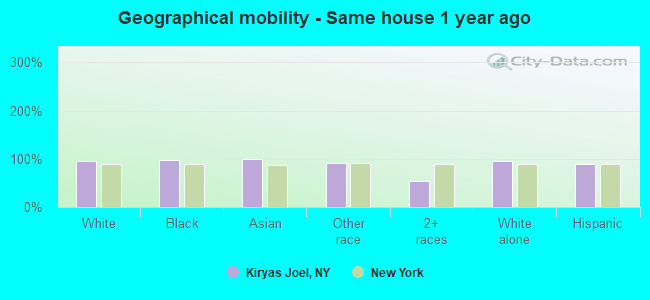
Geographical mobility - Same house 1 year ago (%)
Geographical mobility - Same house 1 year ago (%) - White
Geographical mobility - Same house 1 year ago (%) - Black or African American
Geographical mobility - Same house 1 year ago (%) - Asian
Geographical mobility - Same house 1 year ago (%) - Hispanic or Latino
Geographical mobility - Same house 1 year ago (%) - American Indian and Alaska Native
Geographical mobility - Same house 1 year ago (%) - Multirace
Geographical mobility - Same house 1 year ago (%) - Other Race
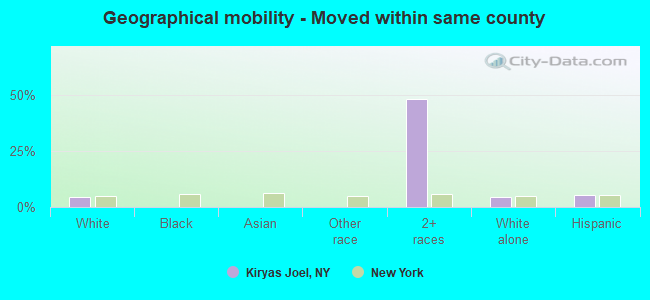
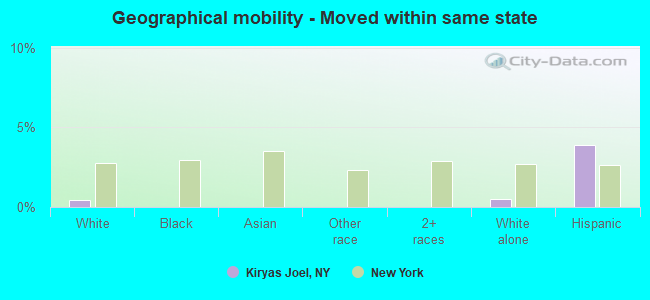
Geographical mobility - Moved within same county (%)
Geographical mobility - Moved within same county (%) - White
Geographical mobility - Moved within same county (%) - Black or African American
Geographical mobility - Moved within same county (%) - Asian
Geographical mobility - Moved within same county (%) - Hispanic or Latino
Geographical mobility - Moved within same county (%) - American Indian and Alaska Native
Geographical mobility - Moved within same county (%) - Multirace
Geographical mobility - Moved within same county (%) - Other Race
Geographical mobility - Moved from different county within same state (%)
Geographical mobility - Moved from different county within same state (%) - White
Geographical mobility - Moved from different county within same state (%) - Black or African American
Geographical mobility - Moved from different county within same state (%) - Asian
Geographical mobility - Moved from different county within same state (%) - Hispanic or Latino
Geographical mobility - Moved from different county within same state (%) - American Indian and Alaska Native
Geographical mobility - Moved from different county within same state (%) - Multirace
Geographical mobility - Moved from different county within same state (%) - Other Race
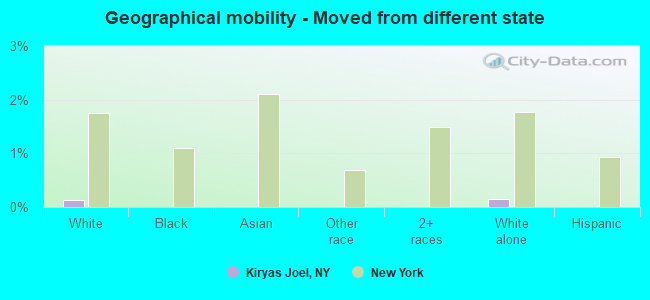
Geographical mobility - Moved from different state (%)
Geographical mobility - Moved from different state (%) - White
Geographical mobility - Moved from different state (%) - Black or African American
Geographical mobility - Moved from different state (%) - Asian
Geographical mobility - Moved from different state (%) - Hispanic or Latino
Geographical mobility - Moved from different state (%) - American Indian and Alaska Native
Geographical mobility - Moved from different state (%) - Multirace
Geographical mobility - Moved from different state (%) - Other Race
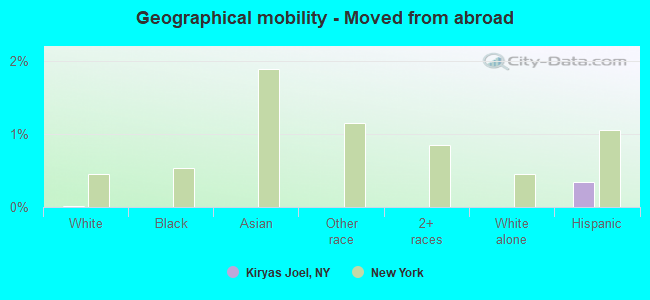
Geographical mobility - Moved from abroad (%)
Geographical mobility - Moved from abroad (%) - White
Geographical mobility - Moved from abroad (%) - Black or African American
Geographical mobility - Moved from abroad (%) - Asian
Geographical mobility - Moved from abroad (%) - Hispanic or Latino
Geographical mobility - Moved from abroad (%) - American Indian and Alaska Native
Geographical mobility - Moved from abroad (%) - Multirace
Geographical mobility - Moved from abroad (%) - Other Race
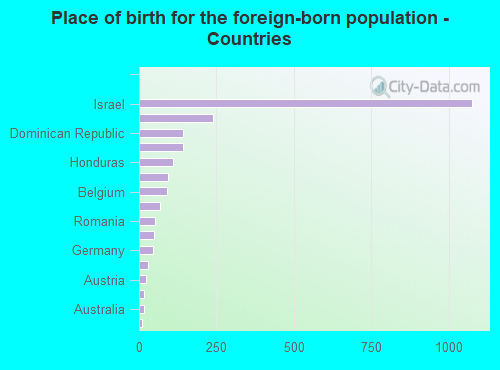
Place of birth for the foreign-born population - Ireland (%)
Place of birth for the foreign-born population - Denmark (%)
Place of birth for the foreign-born population - Norway (%)
Place of birth for the foreign-born population - Sweden (%)
Place of birth for the foreign-born population - United Kingdom (%)
Place of birth for the foreign-born population - England (%)
Place of birth for the foreign-born population - Scotland (%)
Place of birth for the foreign-born population - Other Northern Europe (%)
Place of birth for the foreign-born population - Austria (%)
Place of birth for the foreign-born population - Belgium (%)
Place of birth for the foreign-born population - France (%)
Place of birth for the foreign-born population - Germany (%)
Place of birth for the foreign-born population - Netherlands (%)
Place of birth for the foreign-born population - Switzerland (%)
Place of birth for the foreign-born population - Other Western Europe (%)
Place of birth for the foreign-born population - Greece (%)
Place of birth for the foreign-born population - Italy (%)
Place of birth for the foreign-born population - Portugal (%)
Place of birth for the foreign-born population - Spain (%)
Place of birth for the foreign-born population - Other Southern Europe (%)
Place of birth for the foreign-born population - Albania (%)
Place of birth for the foreign-born population - Belarus (%)
Place of birth for the foreign-born population - Bosnia and Herzegovina (%)
Place of birth for the foreign-born population - Bulgaria (%)
Place of birth for the foreign-born population - Croatia (%)
Place of birth for the foreign-born population - Czechoslovakia (%)
Place of birth for the foreign-born population - Hungary (%)
Place of birth for the foreign-born population - Latvia (%)
Place of birth for the foreign-born population - Lithuania (%)
Place of birth for the foreign-born population - North Macedonia (Macedonia) (%)
Place of birth for the foreign-born population - Moldova (%)
Place of birth for the foreign-born population - Poland (%)
Place of birth for the foreign-born population - Romania (%)
Place of birth for the foreign-born population - Russia (%)
Place of birth for the foreign-born population - Serbia (%)
Place of birth for the foreign-born population - Ukraine (%)
Place of birth for the foreign-born population - Other Eastern Europe (%)
Place of birth for the foreign-born population - China (%)
Place of birth for the foreign-born population - Hong Kong (%)
Place of birth for the foreign-born population - Taiwan (%)
Place of birth for the foreign-born population - Japan (%)
Place of birth for the foreign-born population - Korea (%)
Place of birth for the foreign-born population - Other Eastern Asia (%)
Place of birth for the foreign-born population - Afghanistan (%)
Place of birth for the foreign-born population - Bangladesh (%)
Place of birth for the foreign-born population - India (%)
Place of birth for the foreign-born population - Iran (%)
Place of birth for the foreign-born population - Kazakhstan (%)
Place of birth for the foreign-born population - Nepal (%)
Place of birth for the foreign-born population - Pakistan (%)
Place of birth for the foreign-born population - Sri Lanka (%)
Place of birth for the foreign-born population - Uzbekistan (%)
Place of birth for the foreign-born population - Other South Central Asia (%)
Place of birth for the foreign-born population - Burma (%)
Place of birth for the foreign-born population - Cambodia (%)
Place of birth for the foreign-born population - Indonesia (%)
Place of birth for the foreign-born population - Laos (%)
Place of birth for the foreign-born population - Malaysia (%)
Place of birth for the foreign-born population - Philippines (%)
Place of birth for the foreign-born population - Singapore (%)
Place of birth for the foreign-born population - Thailand (%)
Place of birth for the foreign-born population - Vietnam (%)
Place of birth for the foreign-born population - Other South Eastern Asia (%)
Place of birth for the foreign-born population - Armenia (%)
Place of birth for the foreign-born population - Iraq (%)
Place of birth for the foreign-born population - Israel (%)
Place of birth for the foreign-born population - Jordan (%)
Place of birth for the foreign-born population - Kuwait (%)
Place of birth for the foreign-born population - Lebanon (%)
Place of birth for the foreign-born population - Saudi Arabia (%)
Place of birth for the foreign-born population - Syria (%)
Place of birth for the foreign-born population - Turkey (%)
Place of birth for the foreign-born population - Yemen (%)
Place of birth for the foreign-born population - Other Western Asia (%)
Place of birth for the foreign-born population - Eritrea (%)
Place of birth for the foreign-born population - Ethiopia (%)
Place of birth for the foreign-born population - Kenya (%)
Place of birth for the foreign-born population - Somalia (%)
Place of birth for the foreign-born population - Uganda (%)
Place of birth for the foreign-born population - Zimbabwe (%)
Place of birth for the foreign-born population - Other Eastern Africa (%)
Place of birth for the foreign-born population - Cameroon (%)
Place of birth for the foreign-born population - Congo (%)
Place of birth for the foreign-born population - Democratic Republic of Congo (Zaire) (%)
Place of birth for the foreign-born population - Other Middle Africa (%)
Place of birth for the foreign-born population - Egypt (%)
Place of birth for the foreign-born population - Morocco (%)
Place of birth for the foreign-born population - Sudan (%)
Place of birth for the foreign-born population - Other Northern Africa (%)
Place of birth for the foreign-born population - South Africa (%)
Place of birth for the foreign-born population - Other Southern Africa (%)
Place of birth for the foreign-born population - Cabo Verde (%)
Place of birth for the foreign-born population - Ghana (%)
Place of birth for the foreign-born population - Liberia (%)
Place of birth for the foreign-born population - Nigeria (%)
Place of birth for the foreign-born population - Senegal (%)
Place of birth for the foreign-born population - Sierra Leone (%)
Place of birth for the foreign-born population - Other Western Africa (%)
Place of birth for the foreign-born population - Australia (%)
Place of birth for the foreign-born population - New Zealand (%)
Place of birth for the foreign-born population - Fiji (%)
Place of birth for the foreign-born population - Micronesia (%)
Place of birth for the foreign-born population - Bahamas (%)
Place of birth for the foreign-born population - Barbados (%)
Place of birth for the foreign-born population - Cuba (%)
Place of birth for the foreign-born population - Dominica (%)
Place of birth for the foreign-born population - Dominican Republic (%)
Place of birth for the foreign-born population - Grenada (%)
Place of birth for the foreign-born population - Haiti (%)
Place of birth for the foreign-born population - Jamaica (%)
Place of birth for the foreign-born population - St. Vincent and the Grenadines (%)
Place of birth for the foreign-born population - Trinidad and Tobago (%)
Place of birth for the foreign-born population - West Indies (%)
Place of birth for the foreign-born population - Other Caribbean (%)
Place of birth for the foreign-born population - Belize (%)
Place of birth for the foreign-born population - Costa Rica (%)
Place of birth for the foreign-born population - El Salvador (%)
Place of birth for the foreign-born population - Guatemala (%)
Place of birth for the foreign-born population - Honduras (%)
Place of birth for the foreign-born population - Mexico (%)
Place of birth for the foreign-born population - Nicaragua (%)
Place of birth for the foreign-born population - Panama (%)
Place of birth for the foreign-born population - Other Central America (%)
Place of birth for the foreign-born population - Argentina (%)
Place of birth for the foreign-born population - Bolivia (%)
Place of birth for the foreign-born population - Brazil (%)
Place of birth for the foreign-born population - Chile (%)
Place of birth for the foreign-born population - Colombia (%)
Place of birth for the foreign-born population - Ecuador (%)
Place of birth for the foreign-born population - Guyana (%)
Place of birth for the foreign-born population - Peru (%)
Place of birth for the foreign-born population - Uruguay (%)
Place of birth for the foreign-born population - Venezuela (%)
Place of birth for the foreign-born population - Other South America (%)
Place of birth for the foreign-born population - Canada (%)
Place of birth for the foreign-born population - Other Northern America (%)
Place of birth for the foreign-born population - Other (%)
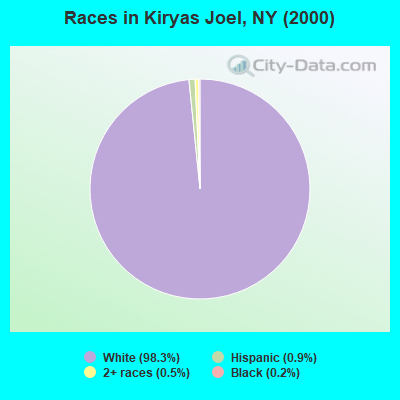
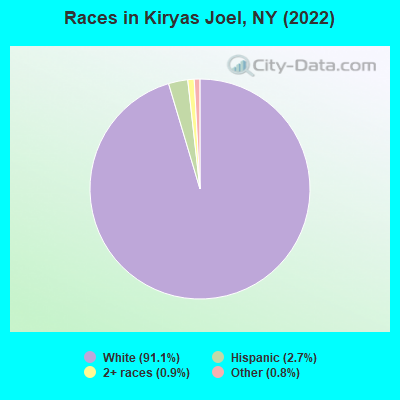
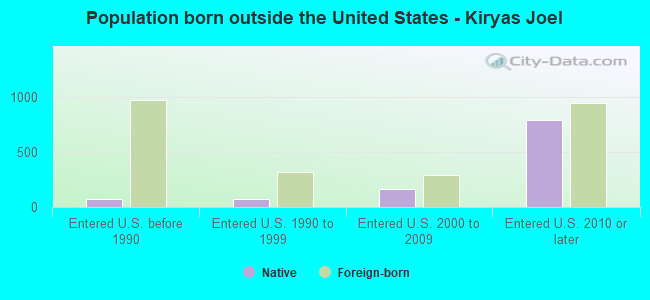
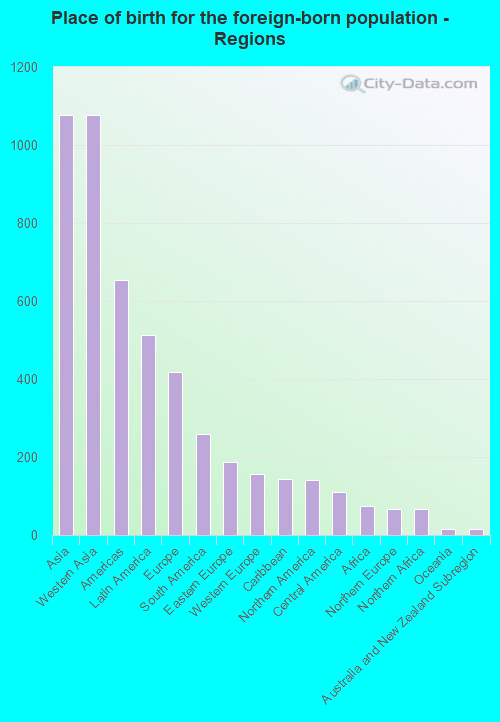
According to 2022 data, the most numerous races in Kiryas Joel, NY are White alone (31,686 residents), Hispanic (948 residents), and Black alone (31 residents). 7.5% of Kiryas Joel residents speak English at home. 6.4% of Kiryas Joel, NY residents are foreign-born (3.2% born in Asia, 1.5% born in Latin America, 1.2% born in Europe), which is 241.7% less than the foreign-born rate of 22.0% across the entire state of New York.
Race distribution in Kiryas Joel
2000 2022
11,760,981 62.0% White alone 2,867,583 15.1% Hispanic 2,812,623 14.8% Black alone 1,035,926 5.5% Asian alone 366,116 1.9% Two or more races 75,499 0.4% Other race alone 52,499 0.3% American Indian alone 5,230 0.03% Native Hawaiian and Other
10,408,933 52.9% White alone 3,867,299 19.7% Hispanic 2,633,840 13.4% Black alone 1,776,286 9.0% Asian alone 732,670 3.7% Two or more races 216,110 1.1% Other race alone 35,082 0.2% American Indian alone 6,931 0.04% Native Hawaiian and Other
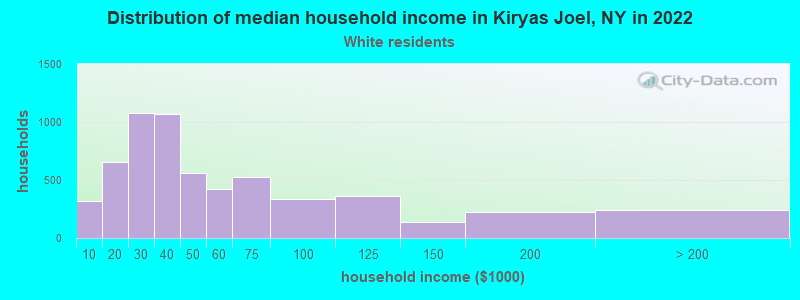
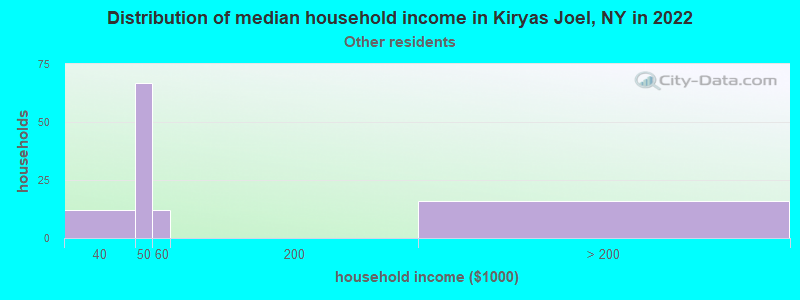
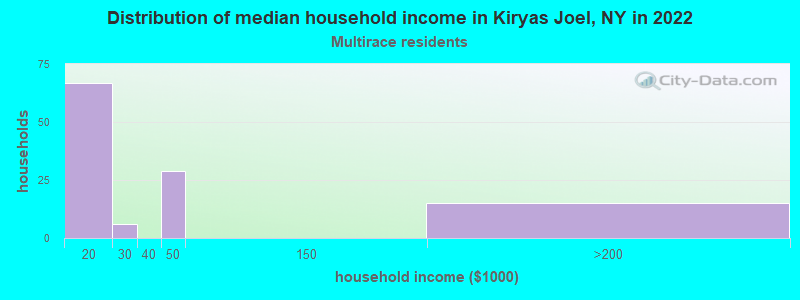
Income and house value in Kiryas Joel Median household income in 2022 $38,155 White non-Hispanic householders$50,178 Some other race householders$43,468 Hispanic or Latino race householdersMedian 2022 house value $792,835 White Non-Hispanic householders
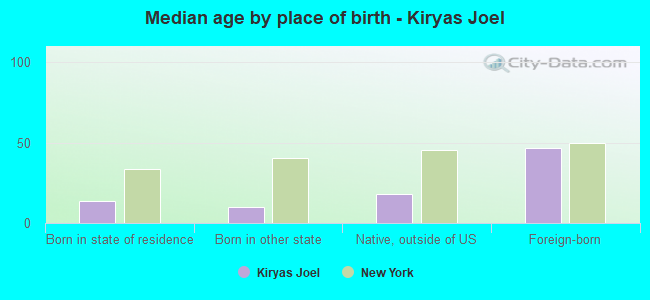
Median age by race in Kiryas Joel
15.0 Median age for White residents14.8 15.2 21.8 Median age for Black or African American residents-690,127,076.5 -661,347,517.1 -671,929,823.9 Median age for American Indian / Alaska Native residents-677,083,332.7 -603,603,603.0 -683,848,796.6 Median age for Asian residents-752,567,693.0 -645,528,454.6 -487,992,314.6 Median age for Native Hawaiian / Pacific Islander residents-477,502,295.2 -497,387,669.3 24.7 Median age for Other race residents27.1 14.5 17.0 Median age for Two or more races residents18.4 13.7 14.6 Median age for White alone residents14.4 14.9 19.3 Median age for Hispanic or Latino residents22.3 14.6
Owner/renter occupied households by race in Kiryas Joel
House owners and renters - White residents 1,855 31.4% Owner occupied4,055 68.6% Renter occupiedHouse owners and renters - Asian residents 10 100.0% Renter occupiedHouse owners and renters - Other race residents 17 16.3% Owner occupied85 83.7% Renter occupiedHouse owners and renters - Two or more races residents 16 16.2% Owner occupied85 83.8% Renter occupiedHouse owners and renters - White alone residents 1,877 31.0% Owner occupied4,170 69.0% Renter occupiedHouse owners and renters - Hispanic or Latino residents 45 19.9% Owner occupied181 80.1% Renter occupied
Language usage in Kiryas Joel
English speakers - Total 7.5% of residents of Kiryas Joel speak English at home.
2.3% of residents speak Spanish at home 157 24.4% Speak English very well486 75.6% Speak English less than very well107.3% of residents speak other language at home 8,183 27.4% Speak English very well21,698 72.6% Speak English less than very well
English speakers - Born in the United States 20.6% of residents of Kiryas Joel speak English at home.
88.7% of residents speak other language at home 228 30.0% Speak English very well533 70.0% Speak English less than very well
English speakers - Native, born elsewhere 4.2% of residents of Kiryas Joel speak English at home.
104.3% of residents speak other language at home 372 33.0% Speak English very well756 67.0% Speak English less than very well
English speakers - Foreign-born 3.8% of residents of Kiryas Joel speak English at home.
19.2% of residents speak Spanish at home 72 15.5% Speak English very well394 84.5% Speak English less than very well76.3% of residents speak other language at home 537 29.0% Speak English very well1,314 71.0% Speak English less than very well
White (Caucasian) - Speak only English Native:
7.8% (1,782)Foreign-born:
6.2% (90)
White (Caucasian) - Speak another language Native:
100.0% (22,915)Foreign-born:
80.8% (1,181)
Black or African American - Speak only English Native:
96.8% (24)Foreign-born:
71.2% (6)
Other race - Speak another language Native:
90.1% (101)Foreign-born:
97.2% (326)
Two or more races - Speak another language Native:
100.0% (309)Foreign-born:
100.0% (18)
White alone - Speak only English Native:
7.5% (1,786)Foreign-born:
5.4% (89)
White alone - Speak another language Native:
100.0% (23,794)Foreign-born:
87.2% (1,445)
Hispanic or Latino - Speak another language Native:
84.6% (291)Foreign-born:
100.0% (402)
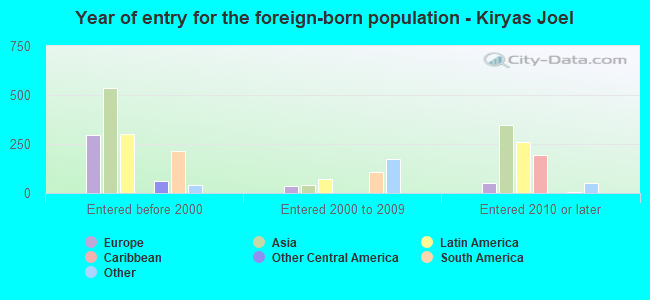
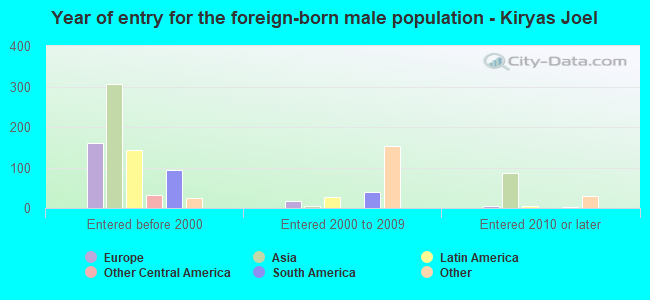
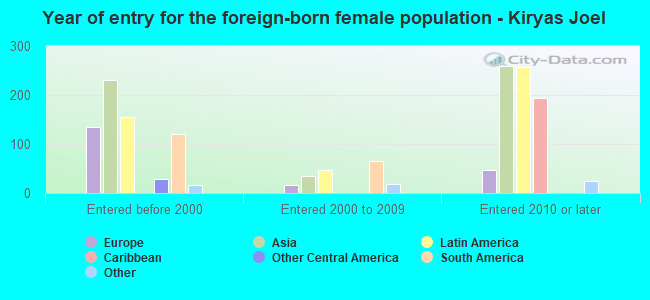
Foreign-born residents in Kiryas Joel 2,239 residents are foreign born (3.2% Asia , 1.5% Latin America , 1.2% Europe ).
This city:
6.4%New York:
22.6%
Marital status for residents in Kiryas Joel Marital status - White (Caucasian) population 15 years and over
Males 27.6% Never married71.3% Now married0.1% Separated0.1% Widowed0.9% DivorcedFemales 26.8% Never married70.7% Now married0.1% Separated0.7% Widowed1.7% DivorcedWomen who gave birth in the past 12 months Now married:
100.0% (1,442)Unmarried:
0.0% (0)
Women who did not give birth in the past 12 months Now married:
59.9% (3,045)Unmarried:
40.1% (2,040)
Marital status - Black or African American population 15 years and over
Males 16.7% Never married83.3% Now married0.0% Separated0.0% Widowed0.0% DivorcedFemales 100.0% Never married0.0% Now married0.0% Separated0.0% Widowed0.0% DivorcedWomen who did not give birth in the past 12 months Now married:
0.0% (0)Unmarried:
100.0% (25)
Marital status - Other race population 15 years and over
Males 0.0% Never married100.0% Now married0.0% Separated0.0% Widowed0.0% DivorcedFemales 33.0% Never married36.9% Now married30.1% Separated0.0% Widowed0.0% DivorcedWomen who gave birth in the past 12 months Now married:
100.0% (57)Unmarried:
0.0% (0)
Women who did not give birth in the past 12 months Now married:
100.0% (100)Unmarried:
0.0% (0)
Marital status - Two or more races population 15 years and over
Males 35.3% Never married64.7% Now married0.0% Separated0.0% Widowed0.0% DivorcedFemales 42.9% Never married53.2% Now married0.0% Separated3.9% Widowed0.0% DivorcedWomen who did not give birth in the past 12 months Now married:
55.4% (57)Unmarried:
44.6% (46)
Marital status - White alone, not Hispanic / Latino population 15 years and over
Males 27.2% Never married71.6% Now married0.1% Separated0.1% Widowed1.0% DivorcedFemales 26.6% Never married70.9% Now married0.1% Separated0.7% Widowed1.8% DivorcedWomen who gave birth in the past 12 months Now married:
100.0% (1,541)Unmarried:
0.0% (0)
Women who did not give birth in the past 12 months Now married:
60.0% (3,229)Unmarried:
40.0% (2,155)
Marital status - Hispanic or Latino population 15 years and over
Males 29.7% Never married70.3% Now married0.0% Separated0.0% Widowed0.0% DivorcedFemales 38.7% Never married34.6% Now married26.7% Separated0.0% Widowed0.0% DivorcedWomen who gave birth in the past 12 months Now married:
100.0% (35)Unmarried:
0.0% (0)
Women who did not give birth in the past 12 months Now married:
77.8% (96)Unmarried:
22.2% (28)
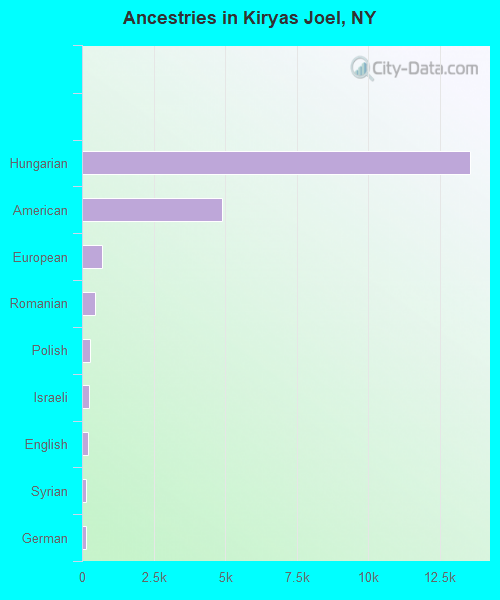
Ancestries in Kiryas Joel
13,551 57.6% Hungarian4,899 20.8% American699 3.0% European467 2.0% Romanian282 1.2% Polish242 1.0% Israeli195 0.8% English153 0.7% Syrian134 0.6% German82 0.3% Egyptian57 0.2% Austrian57 0.2% Italian50 0.2% Eastern European12 0.05% Yugoslavian9 0.04% Canadian7 0.03% Nigerian5 0.02% Ukrainian
Children Nativity (place of birth) in Kiryas Joel
Children under 6 years - Living with two parents Both parents native 6,657 100.0% NativeBoth parents foreign-born 110 100.0% NativeOne native, one foreign-born parent 953 92.7% Native75 7.3% Foreign-bornChildren under 6 years - Living with one parent Native parent 17 100.0% NativeChildren 6 to 17 years - Living with two parents Both parents native 8,141 100.0% NativeBoth parents foreign-born 253 63.6% Native145 36.4% Foreign-bornOne native, one foreign-born parent 1,693 93.9% Native110 6.1% Foreign-bornChildren 6 to 17 years - Living with one parent Native parent 217 100.0% Native
Grandparents responsible for own grandchildren in Kiryas Joel
Grandparents (30 to 59 years) White / Caucasian 63 100.0% Not responsible for grandchildrenWhite alone, not Hispanic / Latino 78 100.0% Not responsible for grandchildren
Grandparents (60 years and over)