Races in Kapolei, Hawaii (HI) Detailed Stats
Data:
Races - White alone (%)
Races - White alone (% change since 2000)
Races - Black alone (%)
Races - Black alone (% change since 2000)
Races - American Indian alone (%)
Races - American Indian alone (% change since 2000)
Races - Asian alone (%)
Races - Asian alone (% change since 2000)
Races - Hispanic (%)
Races - Hispanic (% change since 2000)
Races - Native Hawaiian and Other Pacific Islander alone (%)
Races - Native Hawaiian and Other Pacific Islander alone (% change since 2000)
Races - Two or more races(%)
Races - Two or more races(% change since 2000)
Races - Other race alone (%)
Races - Other race alone (% change since 2000)
Racial diversity
Place of birth - Born in state of residence (%)
Place of birth - Born in state of residence (%) - White
Place of birth - Born in state of residence (%) - Black or African American
Place of birth - Born in state of residence (%) - Asian
Place of birth - Born in state of residence (%) - Hispanic or Latino
Place of birth - Born in state of residence (%) - American Indian and Alaska Native
Place of birth - Born in state of residence (%) - Multirace
Place of birth - Born in state of residence (%) - Other Race
Place of birth - Born in other state (%)
Place of birth - Born in other state (%) - White
Place of birth - Born in other state (%) - Black or African American
Place of birth - Born in other state (%) - Asian
Place of birth - Born in other state (%) - Hispanic or Latino
Place of birth - Born in other state (%) - American Indian and Alaska Native
Place of birth - Born in other state (%) - Multirace
Place of birth - Born in other state (%) - Other Race
Place of birth - Native, outside of US (%)
Place of birth - Native, outside of US (%) - White
Place of birth - Native, outside of US (%) - Black or African American
Place of birth - Native, outside of US (%) - Asian
Place of birth - Native, outside of US (%) - Hispanic or Latino
Place of birth - Native, outside of US (%) - American Indian and Alaska Native
Place of birth - Native, outside of US (%) - Multirace
Place of birth - Native, outside of US (%) - Other Race
Place of birth - Foreign born (%)
Place of birth - Foreign born (%) - White
Place of birth - Foreign born (%) - Black or African American
Place of birth - Foreign born (%) - Asian
Place of birth - Foreign born (%) - Hispanic or Latino
Place of birth - Foreign born (%) - American Indian and Alaska Native
Place of birth - Foreign born (%) - Multirace
Place of birth - Foreign born (%) - Other Race
Residents speaking English at home (%)
Residents speaking English at home - Born in the United States (%)
Residents speaking English at home - Native, born elsewhere (%)
Residents speaking English at home - Foreign born (%)
Residents speaking Spanish at home (%)
Residents speaking Spanish at home - Born in the United States (%)
Residents speaking Spanish at home - Native, born elsewhere (%)
Residents speaking Spanish at home - Foreign born (%)
Residents speaking other language at home (%)
Residents speaking other language at home - Born in the United States (%)
Residents speaking other language at home - Native, born elsewhere (%)
Residents speaking other language at home - Foreign born (%)
Marital status - Never married (%)
Marital status - Now married (%)
Marital status - Separated (%)
Marital status - Widowed (%)
Marital status - Divorced (%)
Ancestries Reported - Arab (%)
Ancestries Reported - Czech (%)
Ancestries Reported - Danish (%)
Ancestries Reported - Dutch (%)
Ancestries Reported - English (%)
Ancestries Reported - French (%)
Ancestries Reported - French Canadian (%)
Ancestries Reported - German (%)
Ancestries Reported - Greek (%)
Ancestries Reported - Hungarian (%)
Ancestries Reported - Irish (%)
Ancestries Reported - Italian (%)
Ancestries Reported - Lithuanian (%)
Ancestries Reported - Norwegian (%)
Ancestries Reported - Polish (%)
Ancestries Reported - Portuguese (%)
Ancestries Reported - Russian (%)
Ancestries Reported - Scotch-Irish (%)
Ancestries Reported - Scottish (%)
Ancestries Reported - Slovak (%)
Ancestries Reported - Subsaharan African (%)
Ancestries Reported - Swedish (%)
Ancestries Reported - Swiss (%)
Ancestries Reported - Ukrainian (%)
Ancestries Reported - United States (%)
Ancestries Reported - Welsh (%)
Ancestries Reported - West Indian (%)
Ancestries Reported - Other (%)
Geographical mobility - Same house 1 year ago (%)
Geographical mobility - Same house 1 year ago (%) - White
Geographical mobility - Same house 1 year ago (%) - Black or African American
Geographical mobility - Same house 1 year ago (%) - Asian
Geographical mobility - Same house 1 year ago (%) - Hispanic or Latino
Geographical mobility - Same house 1 year ago (%) - American Indian and Alaska Native
Geographical mobility - Same house 1 year ago (%) - Multirace
Geographical mobility - Same house 1 year ago (%) - Other Race
Geographical mobility - Moved within same county (%)
Geographical mobility - Moved within same county (%) - White
Geographical mobility - Moved within same county (%) - Black or African American
Geographical mobility - Moved within same county (%) - Asian
Geographical mobility - Moved within same county (%) - Hispanic or Latino
Geographical mobility - Moved within same county (%) - American Indian and Alaska Native
Geographical mobility - Moved within same county (%) - Multirace
Geographical mobility - Moved within same county (%) - Other Race
Geographical mobility - Moved from different county within same state (%)
Geographical mobility - Moved from different county within same state (%) - White
Geographical mobility - Moved from different county within same state (%) - Black or African American
Geographical mobility - Moved from different county within same state (%) - Asian
Geographical mobility - Moved from different county within same state (%) - Hispanic or Latino
Geographical mobility - Moved from different county within same state (%) - American Indian and Alaska Native
Geographical mobility - Moved from different county within same state (%) - Multirace
Geographical mobility - Moved from different county within same state (%) - Other Race
Geographical mobility - Moved from different state (%)
Geographical mobility - Moved from different state (%) - White
Geographical mobility - Moved from different state (%) - Black or African American
Geographical mobility - Moved from different state (%) - Asian
Geographical mobility - Moved from different state (%) - Hispanic or Latino
Geographical mobility - Moved from different state (%) - American Indian and Alaska Native
Geographical mobility - Moved from different state (%) - Multirace
Geographical mobility - Moved from different state (%) - Other Race
Geographical mobility - Moved from abroad (%)
Geographical mobility - Moved from abroad (%) - White
Geographical mobility - Moved from abroad (%) - Black or African American
Geographical mobility - Moved from abroad (%) - Asian
Geographical mobility - Moved from abroad (%) - Hispanic or Latino
Geographical mobility - Moved from abroad (%) - American Indian and Alaska Native
Geographical mobility - Moved from abroad (%) - Multirace
Geographical mobility - Moved from abroad (%) - Other Race
Place of birth for the foreign-born population - Ireland (%)
Place of birth for the foreign-born population - Denmark (%)
Place of birth for the foreign-born population - Norway (%)
Place of birth for the foreign-born population - Sweden (%)
Place of birth for the foreign-born population - United Kingdom (%)
Place of birth for the foreign-born population - England (%)
Place of birth for the foreign-born population - Scotland (%)
Place of birth for the foreign-born population - Other Northern Europe (%)
Place of birth for the foreign-born population - Austria (%)
Place of birth for the foreign-born population - Belgium (%)
Place of birth for the foreign-born population - France (%)
Place of birth for the foreign-born population - Germany (%)
Place of birth for the foreign-born population - Netherlands (%)
Place of birth for the foreign-born population - Switzerland (%)
Place of birth for the foreign-born population - Other Western Europe (%)
Place of birth for the foreign-born population - Greece (%)
Place of birth for the foreign-born population - Italy (%)
Place of birth for the foreign-born population - Portugal (%)
Place of birth for the foreign-born population - Spain (%)
Place of birth for the foreign-born population - Other Southern Europe (%)
Place of birth for the foreign-born population - Albania (%)
Place of birth for the foreign-born population - Belarus (%)
Place of birth for the foreign-born population - Bosnia and Herzegovina (%)
Place of birth for the foreign-born population - Bulgaria (%)
Place of birth for the foreign-born population - Croatia (%)
Place of birth for the foreign-born population - Czechoslovakia (%)
Place of birth for the foreign-born population - Hungary (%)
Place of birth for the foreign-born population - Latvia (%)
Place of birth for the foreign-born population - Lithuania (%)
Place of birth for the foreign-born population - North Macedonia (Macedonia) (%)
Place of birth for the foreign-born population - Moldova (%)
Place of birth for the foreign-born population - Poland (%)
Place of birth for the foreign-born population - Romania (%)
Place of birth for the foreign-born population - Russia (%)
Place of birth for the foreign-born population - Serbia (%)
Place of birth for the foreign-born population - Ukraine (%)
Place of birth for the foreign-born population - Other Eastern Europe (%)
Place of birth for the foreign-born population - China (%)
Place of birth for the foreign-born population - Hong Kong (%)
Place of birth for the foreign-born population - Taiwan (%)
Place of birth for the foreign-born population - Japan (%)
Place of birth for the foreign-born population - Korea (%)
Place of birth for the foreign-born population - Other Eastern Asia (%)
Place of birth for the foreign-born population - Afghanistan (%)
Place of birth for the foreign-born population - Bangladesh (%)
Place of birth for the foreign-born population - India (%)
Place of birth for the foreign-born population - Iran (%)
Place of birth for the foreign-born population - Kazakhstan (%)
Place of birth for the foreign-born population - Nepal (%)
Place of birth for the foreign-born population - Pakistan (%)
Place of birth for the foreign-born population - Sri Lanka (%)
Place of birth for the foreign-born population - Uzbekistan (%)
Place of birth for the foreign-born population - Other South Central Asia (%)
Place of birth for the foreign-born population - Burma (%)
Place of birth for the foreign-born population - Cambodia (%)
Place of birth for the foreign-born population - Indonesia (%)
Place of birth for the foreign-born population - Laos (%)
Place of birth for the foreign-born population - Malaysia (%)
Place of birth for the foreign-born population - Philippines (%)
Place of birth for the foreign-born population - Singapore (%)
Place of birth for the foreign-born population - Thailand (%)
Place of birth for the foreign-born population - Vietnam (%)
Place of birth for the foreign-born population - Other South Eastern Asia (%)
Place of birth for the foreign-born population - Armenia (%)
Place of birth for the foreign-born population - Iraq (%)
Place of birth for the foreign-born population - Israel (%)
Place of birth for the foreign-born population - Jordan (%)
Place of birth for the foreign-born population - Kuwait (%)
Place of birth for the foreign-born population - Lebanon (%)
Place of birth for the foreign-born population - Saudi Arabia (%)
Place of birth for the foreign-born population - Syria (%)
Place of birth for the foreign-born population - Turkey (%)
Place of birth for the foreign-born population - Yemen (%)
Place of birth for the foreign-born population - Other Western Asia (%)
Place of birth for the foreign-born population - Eritrea (%)
Place of birth for the foreign-born population - Ethiopia (%)
Place of birth for the foreign-born population - Kenya (%)
Place of birth for the foreign-born population - Somalia (%)
Place of birth for the foreign-born population - Uganda (%)
Place of birth for the foreign-born population - Zimbabwe (%)
Place of birth for the foreign-born population - Other Eastern Africa (%)
Place of birth for the foreign-born population - Cameroon (%)
Place of birth for the foreign-born population - Congo (%)
Place of birth for the foreign-born population - Democratic Republic of Congo (Zaire) (%)
Place of birth for the foreign-born population - Other Middle Africa (%)
Place of birth for the foreign-born population - Egypt (%)
Place of birth for the foreign-born population - Morocco (%)
Place of birth for the foreign-born population - Sudan (%)
Place of birth for the foreign-born population - Other Northern Africa (%)
Place of birth for the foreign-born population - South Africa (%)
Place of birth for the foreign-born population - Other Southern Africa (%)
Place of birth for the foreign-born population - Cabo Verde (%)
Place of birth for the foreign-born population - Ghana (%)
Place of birth for the foreign-born population - Liberia (%)
Place of birth for the foreign-born population - Nigeria (%)
Place of birth for the foreign-born population - Senegal (%)
Place of birth for the foreign-born population - Sierra Leone (%)
Place of birth for the foreign-born population - Other Western Africa (%)
Place of birth for the foreign-born population - Australia (%)
Place of birth for the foreign-born population - New Zealand (%)
Place of birth for the foreign-born population - Fiji (%)
Place of birth for the foreign-born population - Micronesia (%)
Place of birth for the foreign-born population - Bahamas (%)
Place of birth for the foreign-born population - Barbados (%)
Place of birth for the foreign-born population - Cuba (%)
Place of birth for the foreign-born population - Dominica (%)
Place of birth for the foreign-born population - Dominican Republic (%)
Place of birth for the foreign-born population - Grenada (%)
Place of birth for the foreign-born population - Haiti (%)
Place of birth for the foreign-born population - Jamaica (%)
Place of birth for the foreign-born population - St. Vincent and the Grenadines (%)
Place of birth for the foreign-born population - Trinidad and Tobago (%)
Place of birth for the foreign-born population - West Indies (%)
Place of birth for the foreign-born population - Other Caribbean (%)
Place of birth for the foreign-born population - Belize (%)
Place of birth for the foreign-born population - Costa Rica (%)
Place of birth for the foreign-born population - El Salvador (%)
Place of birth for the foreign-born population - Guatemala (%)
Place of birth for the foreign-born population - Honduras (%)
Place of birth for the foreign-born population - Mexico (%)
Place of birth for the foreign-born population - Nicaragua (%)
Place of birth for the foreign-born population - Panama (%)
Place of birth for the foreign-born population - Other Central America (%)
Place of birth for the foreign-born population - Argentina (%)
Place of birth for the foreign-born population - Bolivia (%)
Place of birth for the foreign-born population - Brazil (%)
Place of birth for the foreign-born population - Chile (%)
Place of birth for the foreign-born population - Colombia (%)
Place of birth for the foreign-born population - Ecuador (%)
Place of birth for the foreign-born population - Guyana (%)
Place of birth for the foreign-born population - Peru (%)
Place of birth for the foreign-born population - Uruguay (%)
Place of birth for the foreign-born population - Venezuela (%)
Place of birth for the foreign-born population - Other South America (%)
Place of birth for the foreign-born population - Canada (%)
Place of birth for the foreign-born population - Other Northern America (%)
Place of birth for the foreign-born population - Other (%)
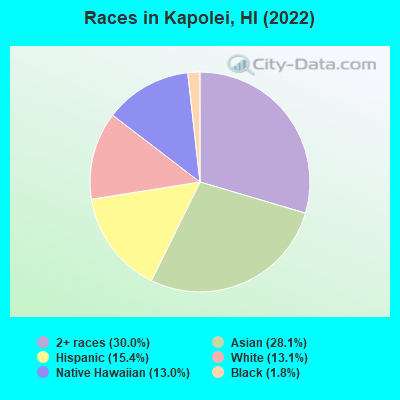
According to 2022 data, the most numerous races in Kapolei, HI are Asian alone (6,293 residents), Two or more races (6,702 residents), and White alone (2,920 residents). 82.8% of Kapolei residents speak English at home.
Race distribution in Kapolei 6,702 30.0% Two or more races 6,293 28.1% Asian alone 3,439 15.4% Hispanic 2,920 13.1% White alone 2,914 13.0% Native Hawaiian and Other 405 1.8% Black alone 7 0.03% Other race alone
2000 2022
494,149 40.8% Asian alone 277,091 22.9% White alone 218,700 18.1% Two or more races 108,441 9.0% Native Hawaiian and Other 87,699 7.2% Hispanic 20,829 1.7% Black alone 2,089 0.2% Other race alone 2,539 0.2% American Indian alone
498,125 34.6% Asian alone 318,574 22.1% Two or more races 297,937 20.7% White alone 160,103 11.1% Hispanic 134,567 9.3% Native Hawaiian and Other 23,682 1.6% Black alone 5,378 0.4% Other race alone 1,830 0.1% American Indian alone
Income and house value in Kapolei Median household income in 2022 $116,115 White non-Hispanic householders$91,739 Black householders$119,790 Asian householders$104,342 Native Hawaiian and other Pacific Islander householders$123,872 Two or more races householders$91,243 Hispanic or Latino race householders
Median age by race in Kapolei
36.0 Median age for White residents35.7 36.6 33.2 Median age for Black or African American residents38.0 32.8 -693,430,656.2 Median age for American Indian / Alaska Native residents-715,953,306.7 -629,508,196.1 43.9 Median age for Asian residents39.1 46.7 39.2 Median age for Native Hawaiian / Pacific Islander residents38.7 43.1 15.9 Median age for Other race residents10.9 16.8 22.9 Median age for Two or more races residents21.3 24.9 35.9 Median age for White alone residents36.2 35.1 18.6 Median age for Hispanic or Latino residents15.7 27.7
Owner/renter occupied households by race in Kapolei
House owners and renters - White residents 849 66.2% Owner occupied434 33.8% Renter occupiedHouse owners and renters - Black or African American residents 132 56.3% Owner occupied102 43.7% Renter occupiedHouse owners and renters - Asian residents 2,089 83.0% Owner occupied427 17.0% Renter occupiedHouse owners and renters - Native Hawaiian / Pacific Islander residents 723 83.3% Owner occupied145 16.7% Renter occupiedHouse owners and renters - Other race residents 116 100.0% Owner occupiedHouse owners and renters - Two or more races residents 1,727 79.0% Owner occupied459 21.0% Renter occupiedHouse owners and renters - White alone residents 808 65.6% Owner occupied423 34.4% Renter occupiedHouse owners and renters - Hispanic or Latino residents 586 61.9% Owner occupied360 38.1% Renter occupied
Language usage in Kapolei
English speakers - Total 82.8% of residents of Kapolei speak English at home.
1.3% of residents speak Spanish at home 227 82.2% Speak English very well49 17.8% Speak English less than very well16.4% of residents speak other language at home 2,562 74.8% Speak English very well864 25.2% Speak English less than very well
English speakers - Born in the United States 92.9% of residents of Kapolei speak English at home.
2.3% of residents speak Spanish at home 116 100.0% Speak English very well5.0% of residents speak other language at home 257 99.6% Speak English very well1 0.4% Speak English less than very well
English speakers - Native, born elsewhere 95.5% of residents of Kapolei speak English at home.
9.2% of residents speak other language at home 66 97.1% Speak English very well2 2.9% Speak English less than very well
English speakers - Foreign-born 15.7% of residents of Kapolei speak English at home.
0.4% of residents speak Spanish at home 12 100.0% Speak English very well83.2% of residents speak other language at home 1,617 69.1% Speak English very well723 30.9% Speak English less than very well
White (Caucasian) - Speak only English Native:
97.4% (2,638)Foreign-born:
44.2% (45)
White (Caucasian) - Speak another language Native:
3.2% (86)Foreign-born:
54.4% (55)
Asian - Speak only English Native:
90.5% (3,548)Foreign-born:
14.8% (352)
Asian - Speak another language Native:
9.8% (383)Foreign-born:
85.1% (2,016)
Native Hawaiian / Pacific Islander - Speak only English Native:
91.9% (2,603)Foreign-born:
2.8% (6)
Native Hawaiian / Pacific Islander - Speak another language Native:
9.4% (267)Foreign-born:
97.7% (202)
Other race - Speak another language Native:
22.1% (118)Foreign-born:
98.0% (17)
Two or more races - Speak only English Native:
93.3% (7,478)Foreign-born:
29.1% (35)
Two or more races - Speak another language Native:
6.6% (527)Foreign-born:
70.8% (84)
White alone - Speak only English Native:
96.3% (2,448)Foreign-born:
41.2% (45)
White alone - Speak another language Native:
3.8% (95)Foreign-born:
58.6% (65)
Hispanic or Latino - Speak only English Native:
90.0% (2,692)Foreign-born:
77.3% (73)
Hispanic or Latino - Speak another language Native:
10.3% (309)Foreign-born:
34.8% (33)
Foreign-born residents in Kapolei
Marital status for residents in Kapolei Marital status - White (Caucasian) population 15 years and over
Males 23.0% Never married64.8% Now married0.1% Separated3.7% Widowed8.4% DivorcedFemales 24.2% Never married61.5% Now married0.0% Separated6.1% Widowed8.2% DivorcedWomen who gave birth in the past 12 months Now married:
100.0% (16)Unmarried:
0.0% (0)
Women who did not give birth in the past 12 months Now married:
66.6% (404)Unmarried:
33.4% (203)
Marital status - Black or African American population 15 years and over
Males 34.8% Never married54.3% Now married0.0% Separated0.0% Widowed10.9% DivorcedFemales 0.0% Never married100.0% Now married0.0% Separated0.0% Widowed0.0% DivorcedWomen who did not give birth in the past 12 months Now married:
100.0% (155)Unmarried:
0.0% (0)
Marital status - Asian population 15 years and over
Males 27.5% Never married69.8% Now married0.0% Separated0.3% Widowed2.3% DivorcedFemales 20.3% Never married64.1% Now married0.6% Separated7.1% Widowed7.9% DivorcedWomen who gave birth in the past 12 months Now married:
82.5% (139)Unmarried:
17.5% (29)
Women who did not give birth in the past 12 months Now married:
57.5% (968)Unmarried:
42.5% (716)
Marital status - Native Hawaiian / Pacific Islander population 15 years and over
Males 43.8% Never married51.9% Now married0.4% Separated1.6% Widowed2.3% DivorcedFemales 38.9% Never married46.8% Now married0.8% Separated5.4% Widowed8.1% DivorcedWomen who gave birth in the past 12 months Now married:
67.6% (20)Unmarried:
32.4% (10)
Women who did not give birth in the past 12 months Now married:
43.5% (304)Unmarried:
56.5% (395)
Marital status - Other race population 15 years and over
Males 57.6% Never married42.4% Now married0.0% Separated0.0% Widowed0.0% DivorcedFemales 30.8% Never married52.6% Now married0.0% Separated0.0% Widowed16.7% DivorcedWomen who did not give birth in the past 12 months Now married:
47.5% (84)Unmarried:
52.5% (92)
Marital status - Two or more races population 15 years and over
Males 50.8% Never married43.8% Now married2.2% Separated0.4% Widowed2.7% DivorcedFemales 39.6% Never married44.9% Now married4.0% Separated3.6% Widowed7.8% DivorcedWomen who gave birth in the past 12 months Now married:
80.2% (99)Unmarried:
19.8% (24)
Women who did not give birth in the past 12 months Now married:
41.6% (803)Unmarried:
58.4% (1,125)
Marital status - White alone, not Hispanic / Latino population 15 years and over
Males 21.2% Never married67.2% Now married0.1% Separated2.5% Widowed8.9% DivorcedFemales 20.6% Never married63.5% Now married0.0% Separated6.8% Widowed9.1% DivorcedWomen who gave birth in the past 12 months Now married:
100.0% (16)Unmarried:
0.0% (0)
Women who did not give birth in the past 12 months Now married:
69.8% (389)Unmarried:
30.2% (169)
Marital status - Hispanic or Latino population 15 years and over
Males 62.4% Never married31.2% Now married0.0% Separated2.3% Widowed4.1% DivorcedFemales 28.4% Never married48.3% Now married1.8% Separated2.8% Widowed18.7% DivorcedWomen who gave birth in the past 12 months Now married:
68.3% (71)Unmarried:
31.7% (33)
Women who did not give birth in the past 12 months Now married:
41.9% (338)Unmarried:
58.1% (468)
Ancestries in Kapolei
179 2.0% English166 1.8% Irish157 1.7% German156 1.7% American136 1.5% Ghanaian109 1.2% Dutch101 1.1% Jamaican63 0.7% Portuguese55 0.6% European44 0.5% Italian38 0.4% Scottish22 0.2% Norwegian12 0.1% Russian7 0.08% Finnish2 0.02% African
Geographical mobility in Kapolei Same house 1 year ago 2,350 77.0% White (Caucasian)335 76.3% Black or African American5,815 88.6% Asian2,910 93.7% Native Hawaiian / Pacific Islander605 100.0% Other race8,018 89.9% Two or more races2,190 75.5% White alone, not Hispanic / Latino3,020 90.2% Hispanic or LatinoMoved within same county 181 5.9% White / Caucasian10 2.3% Black or African American588 9.0% Asian189 6.1% Native Hawaiian / Pacific Islander527 5.9% Two or more races182 6.3% White alone, not Hispanic / Latino241 7.2% Hispanic or LatinoMoved within same state 67 2.2% White / Caucasian23 0.4% Asian67 2.3% White alone, not Hispanic / LatinoMoved from different state 330 10.8% White / Caucasian43 9.9% Black or African American70 1.1% Asian4 0.1% Native Hawaiian / Pacific Islander284 3.2% Two or more races330 11.4% White alone, not Hispanic / Latino68 2.0% Hispanic or LatinoMoved from abroad 127 4.2% White47 10.7% Black or African American60 0.9% Asian122 1.4% Two or more races135 4.7% White alone, not Hispanic / Latino32 1.0% Hispanic or Latino
Children Nativity (place of birth) in Kapolei
Children under 6 years - Living with two parents Both parents native 660 100.0% NativeBoth parents foreign-born 206 100.0% NativeOne native, one foreign-born parent 187 100.0% NativeChildren under 6 years - Living with one parent Native parent 608 100.0% NativeForeign-born parent 9 100.0% NativeChildren 6 to 17 years - Living with two parents Both parents native 1,884 100.0% NativeBoth parents foreign-born 327 76.8% Native99 23.2% Foreign-bornOne native, one foreign-born parent 644 100.0% NativeChildren 6 to 17 years - Living with one parent Native parent 1,143 100.0% NativeForeign-born parent 20 45.6% Native24 54.4% Foreign-born
Grandparents responsible for own grandchildren in Kapolei
Grandparents (30 to 59 years) White / Caucasian 1 3.7% Responsible for grandchildren32 96.3% Not responsible for grandchildrenAsian 11 12.2% Responsible for grandchildren79 87.8% Not responsible for grandchildrenNative Hawaiian / Pacific Islander 18 27.5% Responsible for grandchildren47 72.5% Not responsible for grandchildrenTwo or more races 15 16.8% Responsible for grandchildren73 83.2% Not responsible for grandchildrenWhite alone, not Hispanic / Latino 1 2.4% Responsible for grandchildren36 97.6% Not responsible for grandchildrenHispanic or Latino 28 82.6% Responsible for grandchildren6 17.4% Not responsible for grandchildrenGrandparents (60 years and over) White / Caucasian 2 4.7% Responsible for grandchildren41 95.3% Not responsible for grandchildrenAsian 37 22.8% Responsible for grandchildren124 77.2% Not responsible for grandchildrenNative Hawaiian / Pacific Islander 64 52.6% Responsible for grandchildren58 47.4% Not responsible for grandchildrenTwo or more races 125 68.4% Responsible for grandchildren58 31.6% Not responsible for grandchildrenWhite alone, not Hispanic / Latino 2 5.7% Responsible for grandchildren40 94.3% Not responsible for grandchildrenHispanic or Latino 3 100.0% Not responsible for grandchildren