Races in Kapaa, Hawaii (HI) Detailed Stats
Data:
Races - White alone (%)
Races - White alone (% change since 2000)
Races - Black alone (%)
Races - Black alone (% change since 2000)
Races - American Indian alone (%)
Races - American Indian alone (% change since 2000)
Races - Asian alone (%)
Races - Asian alone (% change since 2000)
Races - Hispanic (%)
Races - Hispanic (% change since 2000)
Races - Native Hawaiian and Other Pacific Islander alone (%)
Races - Native Hawaiian and Other Pacific Islander alone (% change since 2000)
Races - Two or more races(%)
Races - Two or more races(% change since 2000)
Races - Other race alone (%)
Races - Other race alone (% change since 2000)
Racial diversity
Place of birth - Born in state of residence (%)
Place of birth - Born in state of residence (%) - White
Place of birth - Born in state of residence (%) - Black or African American
Place of birth - Born in state of residence (%) - Asian
Place of birth - Born in state of residence (%) - Hispanic or Latino
Place of birth - Born in state of residence (%) - American Indian and Alaska Native
Place of birth - Born in state of residence (%) - Multirace
Place of birth - Born in state of residence (%) - Other Race
Place of birth - Born in other state (%)
Place of birth - Born in other state (%) - White
Place of birth - Born in other state (%) - Black or African American
Place of birth - Born in other state (%) - Asian
Place of birth - Born in other state (%) - Hispanic or Latino
Place of birth - Born in other state (%) - American Indian and Alaska Native
Place of birth - Born in other state (%) - Multirace
Place of birth - Born in other state (%) - Other Race
Place of birth - Native, outside of US (%)
Place of birth - Native, outside of US (%) - White
Place of birth - Native, outside of US (%) - Black or African American
Place of birth - Native, outside of US (%) - Asian
Place of birth - Native, outside of US (%) - Hispanic or Latino
Place of birth - Native, outside of US (%) - American Indian and Alaska Native
Place of birth - Native, outside of US (%) - Multirace
Place of birth - Native, outside of US (%) - Other Race
Place of birth - Foreign born (%)
Place of birth - Foreign born (%) - White
Place of birth - Foreign born (%) - Black or African American
Place of birth - Foreign born (%) - Asian
Place of birth - Foreign born (%) - Hispanic or Latino
Place of birth - Foreign born (%) - American Indian and Alaska Native
Place of birth - Foreign born (%) - Multirace
Place of birth - Foreign born (%) - Other Race
Residents speaking English at home (%)
Residents speaking English at home - Born in the United States (%)
Residents speaking English at home - Native, born elsewhere (%)
Residents speaking English at home - Foreign born (%)
Residents speaking Spanish at home (%)
Residents speaking Spanish at home - Born in the United States (%)
Residents speaking Spanish at home - Native, born elsewhere (%)
Residents speaking Spanish at home - Foreign born (%)
Residents speaking other language at home (%)
Residents speaking other language at home - Born in the United States (%)
Residents speaking other language at home - Native, born elsewhere (%)
Residents speaking other language at home - Foreign born (%)
Marital status - Never married (%)
Marital status - Now married (%)
Marital status - Separated (%)
Marital status - Widowed (%)
Marital status - Divorced (%)
Ancestries Reported - Arab (%)
Ancestries Reported - Czech (%)
Ancestries Reported - Danish (%)
Ancestries Reported - Dutch (%)
Ancestries Reported - English (%)
Ancestries Reported - French (%)
Ancestries Reported - French Canadian (%)
Ancestries Reported - German (%)
Ancestries Reported - Greek (%)
Ancestries Reported - Hungarian (%)
Ancestries Reported - Irish (%)
Ancestries Reported - Italian (%)
Ancestries Reported - Lithuanian (%)
Ancestries Reported - Norwegian (%)
Ancestries Reported - Polish (%)
Ancestries Reported - Portuguese (%)
Ancestries Reported - Russian (%)
Ancestries Reported - Scotch-Irish (%)
Ancestries Reported - Scottish (%)
Ancestries Reported - Slovak (%)
Ancestries Reported - Subsaharan African (%)
Ancestries Reported - Swedish (%)
Ancestries Reported - Swiss (%)
Ancestries Reported - Ukrainian (%)
Ancestries Reported - United States (%)
Ancestries Reported - Welsh (%)
Ancestries Reported - West Indian (%)
Ancestries Reported - Other (%)
Geographical mobility - Same house 1 year ago (%)
Geographical mobility - Same house 1 year ago (%) - White
Geographical mobility - Same house 1 year ago (%) - Black or African American
Geographical mobility - Same house 1 year ago (%) - Asian
Geographical mobility - Same house 1 year ago (%) - Hispanic or Latino
Geographical mobility - Same house 1 year ago (%) - American Indian and Alaska Native
Geographical mobility - Same house 1 year ago (%) - Multirace
Geographical mobility - Same house 1 year ago (%) - Other Race
Geographical mobility - Moved within same county (%)
Geographical mobility - Moved within same county (%) - White
Geographical mobility - Moved within same county (%) - Black or African American
Geographical mobility - Moved within same county (%) - Asian
Geographical mobility - Moved within same county (%) - Hispanic or Latino
Geographical mobility - Moved within same county (%) - American Indian and Alaska Native
Geographical mobility - Moved within same county (%) - Multirace
Geographical mobility - Moved within same county (%) - Other Race
Geographical mobility - Moved from different county within same state (%)
Geographical mobility - Moved from different county within same state (%) - White
Geographical mobility - Moved from different county within same state (%) - Black or African American
Geographical mobility - Moved from different county within same state (%) - Asian
Geographical mobility - Moved from different county within same state (%) - Hispanic or Latino
Geographical mobility - Moved from different county within same state (%) - American Indian and Alaska Native
Geographical mobility - Moved from different county within same state (%) - Multirace
Geographical mobility - Moved from different county within same state (%) - Other Race
Geographical mobility - Moved from different state (%)
Geographical mobility - Moved from different state (%) - White
Geographical mobility - Moved from different state (%) - Black or African American
Geographical mobility - Moved from different state (%) - Asian
Geographical mobility - Moved from different state (%) - Hispanic or Latino
Geographical mobility - Moved from different state (%) - American Indian and Alaska Native
Geographical mobility - Moved from different state (%) - Multirace
Geographical mobility - Moved from different state (%) - Other Race
Geographical mobility - Moved from abroad (%)
Geographical mobility - Moved from abroad (%) - White
Geographical mobility - Moved from abroad (%) - Black or African American
Geographical mobility - Moved from abroad (%) - Asian
Geographical mobility - Moved from abroad (%) - Hispanic or Latino
Geographical mobility - Moved from abroad (%) - American Indian and Alaska Native
Geographical mobility - Moved from abroad (%) - Multirace
Geographical mobility - Moved from abroad (%) - Other Race
Place of birth for the foreign-born population - Ireland (%)
Place of birth for the foreign-born population - Denmark (%)
Place of birth for the foreign-born population - Norway (%)
Place of birth for the foreign-born population - Sweden (%)
Place of birth for the foreign-born population - United Kingdom (%)
Place of birth for the foreign-born population - England (%)
Place of birth for the foreign-born population - Scotland (%)
Place of birth for the foreign-born population - Other Northern Europe (%)
Place of birth for the foreign-born population - Austria (%)
Place of birth for the foreign-born population - Belgium (%)
Place of birth for the foreign-born population - France (%)
Place of birth for the foreign-born population - Germany (%)
Place of birth for the foreign-born population - Netherlands (%)
Place of birth for the foreign-born population - Switzerland (%)
Place of birth for the foreign-born population - Other Western Europe (%)
Place of birth for the foreign-born population - Greece (%)
Place of birth for the foreign-born population - Italy (%)
Place of birth for the foreign-born population - Portugal (%)
Place of birth for the foreign-born population - Spain (%)
Place of birth for the foreign-born population - Other Southern Europe (%)
Place of birth for the foreign-born population - Albania (%)
Place of birth for the foreign-born population - Belarus (%)
Place of birth for the foreign-born population - Bosnia and Herzegovina (%)
Place of birth for the foreign-born population - Bulgaria (%)
Place of birth for the foreign-born population - Croatia (%)
Place of birth for the foreign-born population - Czechoslovakia (%)
Place of birth for the foreign-born population - Hungary (%)
Place of birth for the foreign-born population - Latvia (%)
Place of birth for the foreign-born population - Lithuania (%)
Place of birth for the foreign-born population - North Macedonia (Macedonia) (%)
Place of birth for the foreign-born population - Moldova (%)
Place of birth for the foreign-born population - Poland (%)
Place of birth for the foreign-born population - Romania (%)
Place of birth for the foreign-born population - Russia (%)
Place of birth for the foreign-born population - Serbia (%)
Place of birth for the foreign-born population - Ukraine (%)
Place of birth for the foreign-born population - Other Eastern Europe (%)
Place of birth for the foreign-born population - China (%)
Place of birth for the foreign-born population - Hong Kong (%)
Place of birth for the foreign-born population - Taiwan (%)
Place of birth for the foreign-born population - Japan (%)
Place of birth for the foreign-born population - Korea (%)
Place of birth for the foreign-born population - Other Eastern Asia (%)
Place of birth for the foreign-born population - Afghanistan (%)
Place of birth for the foreign-born population - Bangladesh (%)
Place of birth for the foreign-born population - India (%)
Place of birth for the foreign-born population - Iran (%)
Place of birth for the foreign-born population - Kazakhstan (%)
Place of birth for the foreign-born population - Nepal (%)
Place of birth for the foreign-born population - Pakistan (%)
Place of birth for the foreign-born population - Sri Lanka (%)
Place of birth for the foreign-born population - Uzbekistan (%)
Place of birth for the foreign-born population - Other South Central Asia (%)
Place of birth for the foreign-born population - Burma (%)
Place of birth for the foreign-born population - Cambodia (%)
Place of birth for the foreign-born population - Indonesia (%)
Place of birth for the foreign-born population - Laos (%)
Place of birth for the foreign-born population - Malaysia (%)
Place of birth for the foreign-born population - Philippines (%)
Place of birth for the foreign-born population - Singapore (%)
Place of birth for the foreign-born population - Thailand (%)
Place of birth for the foreign-born population - Vietnam (%)
Place of birth for the foreign-born population - Other South Eastern Asia (%)
Place of birth for the foreign-born population - Armenia (%)
Place of birth for the foreign-born population - Iraq (%)
Place of birth for the foreign-born population - Israel (%)
Place of birth for the foreign-born population - Jordan (%)
Place of birth for the foreign-born population - Kuwait (%)
Place of birth for the foreign-born population - Lebanon (%)
Place of birth for the foreign-born population - Saudi Arabia (%)
Place of birth for the foreign-born population - Syria (%)
Place of birth for the foreign-born population - Turkey (%)
Place of birth for the foreign-born population - Yemen (%)
Place of birth for the foreign-born population - Other Western Asia (%)
Place of birth for the foreign-born population - Eritrea (%)
Place of birth for the foreign-born population - Ethiopia (%)
Place of birth for the foreign-born population - Kenya (%)
Place of birth for the foreign-born population - Somalia (%)
Place of birth for the foreign-born population - Uganda (%)
Place of birth for the foreign-born population - Zimbabwe (%)
Place of birth for the foreign-born population - Other Eastern Africa (%)
Place of birth for the foreign-born population - Cameroon (%)
Place of birth for the foreign-born population - Congo (%)
Place of birth for the foreign-born population - Democratic Republic of Congo (Zaire) (%)
Place of birth for the foreign-born population - Other Middle Africa (%)
Place of birth for the foreign-born population - Egypt (%)
Place of birth for the foreign-born population - Morocco (%)
Place of birth for the foreign-born population - Sudan (%)
Place of birth for the foreign-born population - Other Northern Africa (%)
Place of birth for the foreign-born population - South Africa (%)
Place of birth for the foreign-born population - Other Southern Africa (%)
Place of birth for the foreign-born population - Cabo Verde (%)
Place of birth for the foreign-born population - Ghana (%)
Place of birth for the foreign-born population - Liberia (%)
Place of birth for the foreign-born population - Nigeria (%)
Place of birth for the foreign-born population - Senegal (%)
Place of birth for the foreign-born population - Sierra Leone (%)
Place of birth for the foreign-born population - Other Western Africa (%)
Place of birth for the foreign-born population - Australia (%)
Place of birth for the foreign-born population - New Zealand (%)
Place of birth for the foreign-born population - Fiji (%)
Place of birth for the foreign-born population - Micronesia (%)
Place of birth for the foreign-born population - Bahamas (%)
Place of birth for the foreign-born population - Barbados (%)
Place of birth for the foreign-born population - Cuba (%)
Place of birth for the foreign-born population - Dominica (%)
Place of birth for the foreign-born population - Dominican Republic (%)
Place of birth for the foreign-born population - Grenada (%)
Place of birth for the foreign-born population - Haiti (%)
Place of birth for the foreign-born population - Jamaica (%)
Place of birth for the foreign-born population - St. Vincent and the Grenadines (%)
Place of birth for the foreign-born population - Trinidad and Tobago (%)
Place of birth for the foreign-born population - West Indies (%)
Place of birth for the foreign-born population - Other Caribbean (%)
Place of birth for the foreign-born population - Belize (%)
Place of birth for the foreign-born population - Costa Rica (%)
Place of birth for the foreign-born population - El Salvador (%)
Place of birth for the foreign-born population - Guatemala (%)
Place of birth for the foreign-born population - Honduras (%)
Place of birth for the foreign-born population - Mexico (%)
Place of birth for the foreign-born population - Nicaragua (%)
Place of birth for the foreign-born population - Panama (%)
Place of birth for the foreign-born population - Other Central America (%)
Place of birth for the foreign-born population - Argentina (%)
Place of birth for the foreign-born population - Bolivia (%)
Place of birth for the foreign-born population - Brazil (%)
Place of birth for the foreign-born population - Chile (%)
Place of birth for the foreign-born population - Colombia (%)
Place of birth for the foreign-born population - Ecuador (%)
Place of birth for the foreign-born population - Guyana (%)
Place of birth for the foreign-born population - Peru (%)
Place of birth for the foreign-born population - Uruguay (%)
Place of birth for the foreign-born population - Venezuela (%)
Place of birth for the foreign-born population - Other South America (%)
Place of birth for the foreign-born population - Canada (%)
Place of birth for the foreign-born population - Other Northern America (%)
Place of birth for the foreign-born population - Other (%)
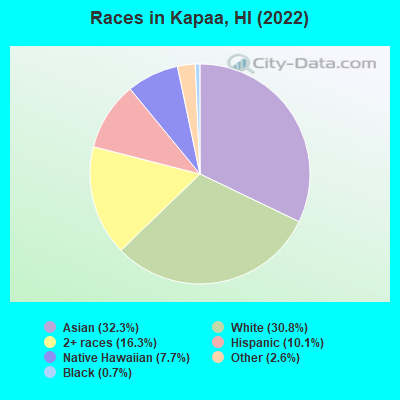
According to 2022 data, the most numerous races in Kapaa, HI are Asian alone (3,522 residents), Two or more races (1,771 residents), and White alone (3,357 residents). 83.7% of Kapaa residents speak English at home. 16.4% of Kapaa, HI residents are foreign-born (13.9% born in Asia), which is 9.5% less than the foreign-born rate of 18.0% across the entire state of Hawaii.
Race distribution in Kapaa
2000 2022
494,149 40.8% Asian alone 277,091 22.9% White alone 218,700 18.1% Two or more races 108,441 9.0% Native Hawaiian and Other 87,699 7.2% Hispanic 20,829 1.7% Black alone 2,089 0.2% Other race alone 2,539 0.2% American Indian alone
498,125 34.6% Asian alone 318,574 22.1% Two or more races 297,937 20.7% White alone 160,103 11.1% Hispanic 134,567 9.3% Native Hawaiian and Other 23,682 1.6% Black alone 5,378 0.4% Other race alone 1,830 0.1% American Indian alone
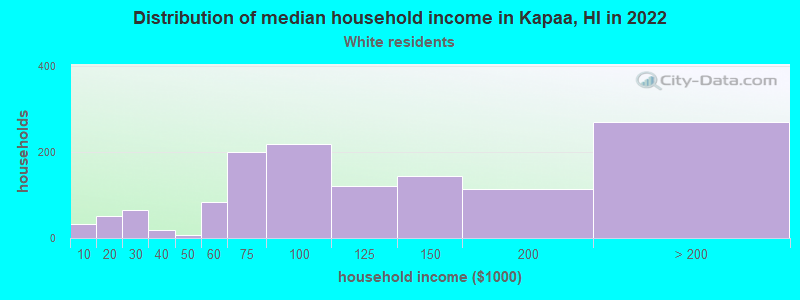
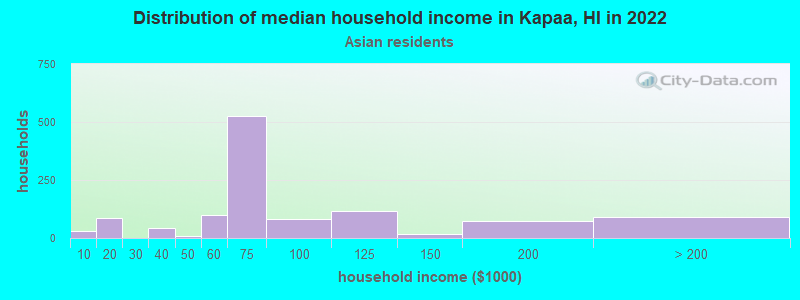
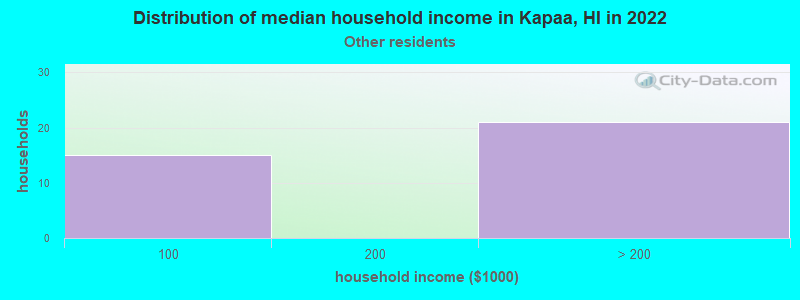
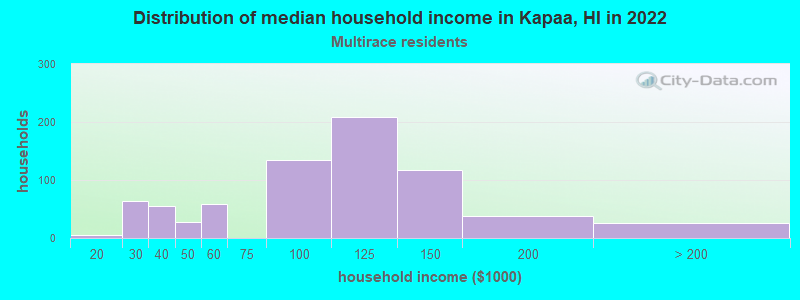
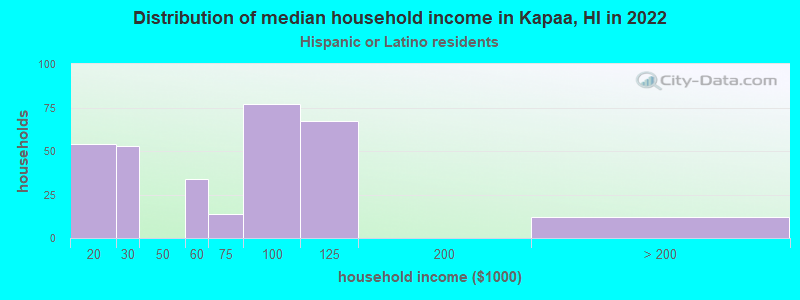
Income and house value in Kapaa Median household income in 2022 $111,189 White non-Hispanic householders$60,364 Asian householders$75,315 Native Hawaiian and other Pacific Islander householders$103,959 Two or more races householders$52,864 Hispanic or Latino race householdersMedian 2022 house value $799,381 White Non-Hispanic householders$754,703 American Indian or Alaska Native householders $746,250 Asian householders$844,060 Native Hawaiian and other Pacific Islander householdersover $1,000,000 Some other race householders$863,380 Two or more races householders$816,287 Hispanic or Latino householders
Median age by race in Kapaa
51.7 Median age for White residents48.9 51.8 -664,879,355.9 Median age for Black or African American residents-681,440,442.5 -717,439,292.9 -711,949,684.8 Median age for American Indian / Alaska Native residents-709,178,743.3 -1,409,683,425.0 52.6 Median age for Asian residents53.9 50.5 47.1 Median age for Native Hawaiian / Pacific Islander residents45.5 46.8 31.6 Median age for Other race residents31.5 30.8 30.1 Median age for Two or more races residents24.5 34.8 50.9 Median age for White alone residents48.3 51.7 9.4 Median age for Hispanic or Latino residents6.8 10.9
Owner/renter occupied households by race in Kapaa
House owners and renters - White residents 779 62.2% Owner occupied473 37.8% Renter occupiedHouse owners and renters - Black or African American residents 53 100.0% Renter occupiedHouse owners and renters - American Indian / Alaska Native residents 13 100.0% Owner occupiedHouse owners and renters - Asian residents 677 64.2% Owner occupied378 35.8% Renter occupiedHouse owners and renters - Native Hawaiian / Pacific Islander residents 320 68.9% Owner occupied145 31.1% Renter occupiedHouse owners and renters - Other race residents 27 40.3% Owner occupied40 59.7% Renter occupiedHouse owners and renters - Two or more races residents 409 64.4% Owner occupied226 35.6% Renter occupiedHouse owners and renters - White alone residents 771 63.1% Owner occupied452 36.9% Renter occupiedHouse owners and renters - Hispanic or Latino residents 142 64.1% Owner occupied79 35.9% Renter occupied
Language usage in Kapaa
English speakers - Total 83.7% of residents of Kapaa speak English at home.
1.0% of residents speak Spanish at home 37 35.9% Speak English very well66 64.1% Speak English less than very well15.9% of residents speak other language at home 627 38.0% Speak English very well1,023 62.0% Speak English less than very well
English speakers - Born in the United States 99.2% of residents of Kapaa speak English at home.
0.8% of residents speak Spanish at home 30 100.0% Speak English very well0.3% of residents speak other language at home 10 100.0% Speak English very well
All residents speak only English at home
English speakers - Foreign-born 16.8% of residents of Kapaa speak English at home.
83.4% of residents speak other language at home 381 27.5% Speak English very well1,003 72.5% Speak English less than very well
White (Caucasian) - Speak only English Native:
100.0% (3,246)Foreign-born:
73.8% (82)
White (Caucasian) - Speak another language Native:
0.8% (25)Foreign-born:
18.0% (20)
Asian - Speak only English Native:
91.0% (1,857)Foreign-born:
7.6% (105)
Asian - Speak another language Native:
6.0% (122)Foreign-born:
93.2% (1,295)
Native Hawaiian / Pacific Islander - Speak only English Native:
82.9% (780)Foreign-born:
42.2% (11)
Native Hawaiian / Pacific Islander - Speak another language Native:
17.2% (162)Foreign-born:
51.3% (14)
Other race - Speak another language Native:
31.2% (41)Foreign-born:
85.1% (15)
Two or more races - Speak another language Native:
3.7% (82)Foreign-born:
98.8% (204)
White alone - Speak only English Native:
100.0% (3,173)Foreign-born:
85.6% (87)
White alone - Speak another language Native:
0.6% (18)Foreign-born:
15.4% (16)
Foreign-born residents in Kapaa 1,790 residents are foreign born (13.9% Asia ).
This city:
16.4%Hawaii:
18.0%
Marital status for residents in Kapaa Marital status - White (Caucasian) population 15 years and over
Males 38.4% Never married48.8% Now married0.0% Separated1.3% Widowed11.4% DivorcedFemales 29.7% Never married48.9% Now married0.0% Separated9.6% Widowed11.8% DivorcedWomen who gave birth in the past 12 months Now married:
0.0% (0)Unmarried:
100.0% (23)
Women who did not give birth in the past 12 months Now married:
49.2% (324)Unmarried:
50.8% (334)
Marital status - Asian population 15 years and over
Males 36.9% Never married56.9% Now married0.0% Separated1.7% Widowed4.5% DivorcedFemales 40.1% Never married43.3% Now married0.0% Separated10.9% Widowed5.7% DivorcedWomen who did not give birth in the past 12 months Now married:
26.4% (234)Unmarried:
73.6% (652)
Marital status - Native Hawaiian / Pacific Islander population 15 years and over
Males 40.5% Never married58.6% Now married0.0% Separated1.0% Widowed0.0% DivorcedFemales 13.6% Never married40.6% Now married0.0% Separated39.6% Widowed6.2% DivorcedWomen who did not give birth in the past 12 months Now married:
48.5% (46)Unmarried:
51.5% (49)
Marital status - Other race population 15 years and over
Males 25.5% Never married40.4% Now married0.0% Separated0.0% Widowed34.0% DivorcedFemales 55.9% Never married44.1% Now married0.0% Separated0.0% Widowed0.0% DivorcedWomen who did not give birth in the past 12 months Now married:
0.0% (0)Unmarried:
100.0% (23)
Marital status - Two or more races population 15 years and over
Males 43.5% Never married37.1% Now married0.6% Separated0.0% Widowed18.8% DivorcedFemales 32.6% Never married49.9% Now married0.0% Separated0.0% Widowed17.5% DivorcedWomen who did not give birth in the past 12 months Now married:
41.5% (197)Unmarried:
58.5% (278)
Marital status - White alone, not Hispanic / Latino population 15 years and over
Males 38.1% Never married49.6% Now married0.0% Separated0.7% Widowed11.6% DivorcedFemales 30.3% Never married48.2% Now married0.0% Separated9.7% Widowed11.7% DivorcedWomen who gave birth in the past 12 months Now married:
0.0% (0)Unmarried:
100.0% (24)
Women who did not give birth in the past 12 months Now married:
47.8% (318)Unmarried:
52.2% (348)
Marital status - Hispanic or Latino population 15 years and over
Males 39.0% Never married32.7% Now married2.0% Separated4.8% Widowed21.5% DivorcedFemales 15.5% Never married59.4% Now married0.0% Separated0.0% Widowed25.1% DivorcedWomen who did not give birth in the past 12 months Now married:
47.9% (70)Unmarried:
52.1% (76)
Ancestries in Kapaa
236 4.8% German206 4.2% English147 3.0% Portuguese140 2.8% European122 2.5% Scandinavian109 2.2% French107 2.2% Irish52 1.1% Dutch42 0.9% Italian34 0.7% Welsh33 0.7% Palestinian32 0.7% American28 0.6% Scottish24 0.5% British18 0.4% Eastern European15 0.3% Swiss14 0.3% Norwegian8 0.2% Polish5 0.1% Swedish
Geographical mobility in Kapaa Same house 1 year ago 3,130 92.3% White (Caucasian)42 96.5% Black or African American8 93.1% American Indian / Alaska Native3,201 92.7% Asian965 90.7% Native Hawaiian / Pacific Islander168 94.9% Other race2,254 93.5% Two or more races3,046 92.1% White alone, not Hispanic / Latino1,082 100.0% Hispanic or LatinoMoved within same county 283 8.4% White / Caucasian214 6.2% Asian117 4.9% Two or more races288 8.7% White alone, not Hispanic / Latino4 0.4% Hispanic or LatinoMoved within same state 66 2.0% White / Caucasian36 1.1% Asian60 5.6% Native Hawaiian / Pacific Islander58 2.4% Two or more races66 2.0% White alone, not Hispanic / LatinoMoved from different state 8 0.2% White / Caucasian8 0.2% Asian16 8.8% Other race13 0.5% Two or more races8 0.2% White alone, not Hispanic / LatinoMoved from abroad 31 0.9% White31 0.9% White alone, not Hispanic / Latino
Children Nativity (place of birth) in Kapaa
Children under 6 years - Living with two parents Both parents native 342 100.0% NativeChildren under 6 years - Living with one parent Native parent 114 100.0% Native
Children 6 to 17 years - Living with two parents Both parents native 621 100.0% NativeBoth parents foreign-born 8 100.0% NativeOne native, one foreign-born parent 38 100.0% NativeChildren 6 to 17 years - Living with one parent Native parent 548 100.0% Native
Grandparents responsible for own grandchildren in Kapaa
Grandparents (30 to 59 years) Asian 44 100.0% Not responsible for grandchildrenNative Hawaiian / Pacific Islander 43 100.0% Responsible for grandchildrenTwo or more races 11 100.0% Not responsible for grandchildrenHispanic or Latino 10 100.0% Responsible for grandchildrenGrandparents (60 years and over) Asian 13 23.5% Responsible for grandchildren43 76.5% Not responsible for grandchildren