Races in Kansas City, Missouri (MO) Detailed Stats
Data:
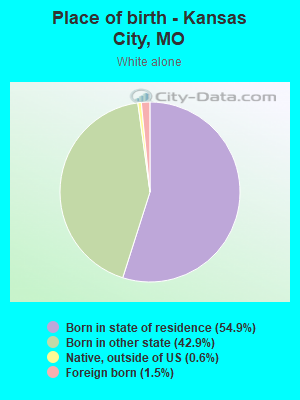
Races - White alone (%)
Races - White alone (% change since 2000)
Races - Black alone (%)
Races - Black alone (% change since 2000)
Races - American Indian alone (%)
Races - American Indian alone (% change since 2000)
Races - Asian alone (%)
Races - Asian alone (% change since 2000)
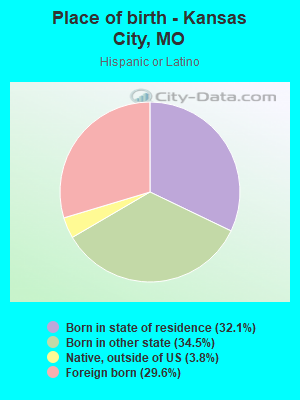
Races - Hispanic (%)
Races - Hispanic (% change since 2000)
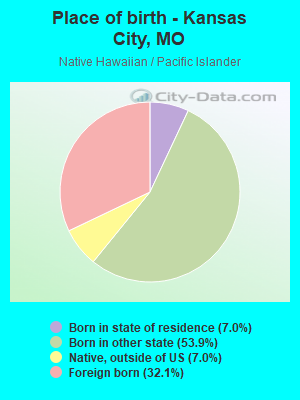
Races - Native Hawaiian and Other Pacific Islander alone (%)
Races - Native Hawaiian and Other Pacific Islander alone (% change since 2000)
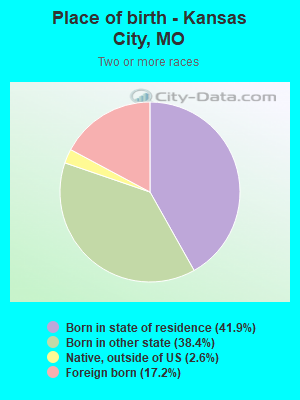
Races - Two or more races(%)
Races - Two or more races(% change since 2000)
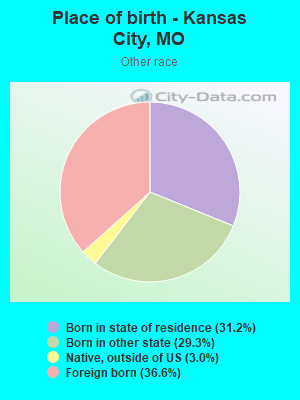
Races - Other race alone (%)
Races - Other race alone (% change since 2000)
Racial diversity
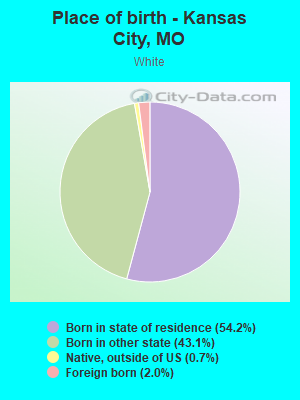
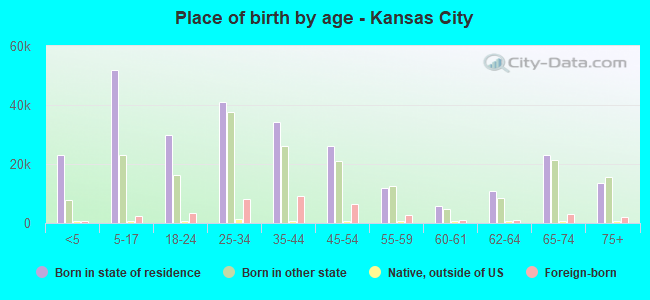
Place of birth - Born in state of residence (%)
Place of birth - Born in state of residence (%) - White
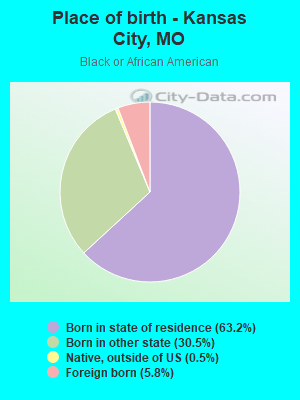
Place of birth - Born in state of residence (%) - Black or African American
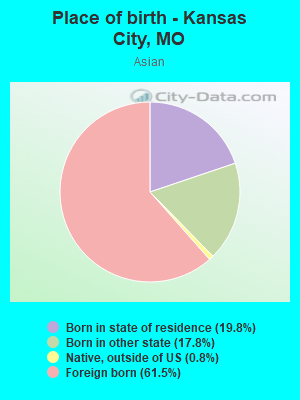
Place of birth - Born in state of residence (%) - Asian
Place of birth - Born in state of residence (%) - Hispanic or Latino
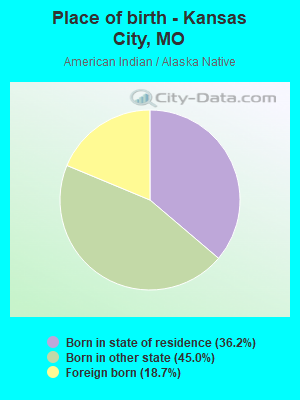
Place of birth - Born in state of residence (%) - American Indian and Alaska Native
Place of birth - Born in state of residence (%) - Multirace
Place of birth - Born in state of residence (%) - Other Race
Place of birth - Born in other state (%)
Place of birth - Born in other state (%) - White
Place of birth - Born in other state (%) - Black or African American
Place of birth - Born in other state (%) - Asian
Place of birth - Born in other state (%) - Hispanic or Latino
Place of birth - Born in other state (%) - American Indian and Alaska Native
Place of birth - Born in other state (%) - Multirace
Place of birth - Born in other state (%) - Other Race
Place of birth - Native, outside of US (%)
Place of birth - Native, outside of US (%) - White
Place of birth - Native, outside of US (%) - Black or African American
Place of birth - Native, outside of US (%) - Asian
Place of birth - Native, outside of US (%) - Hispanic or Latino
Place of birth - Native, outside of US (%) - American Indian and Alaska Native
Place of birth - Native, outside of US (%) - Multirace
Place of birth - Native, outside of US (%) - Other Race
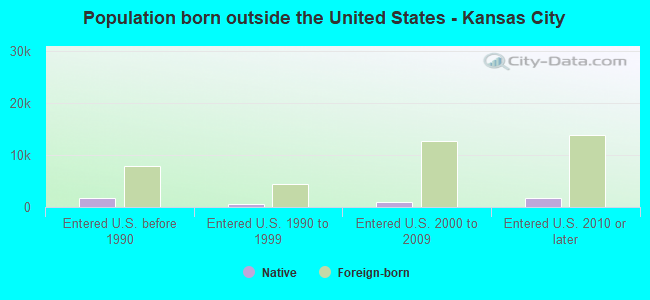
Place of birth - Foreign born (%)
Place of birth - Foreign born (%) - White
Place of birth - Foreign born (%) - Black or African American
Place of birth - Foreign born (%) - Asian
Place of birth - Foreign born (%) - Hispanic or Latino
Place of birth - Foreign born (%) - American Indian and Alaska Native
Place of birth - Foreign born (%) - Multirace
Place of birth - Foreign born (%) - Other Race
Residents speaking English at home (%)
Residents speaking English at home - Born in the United States (%)
Residents speaking English at home - Native, born elsewhere (%)
Residents speaking English at home - Foreign born (%)
Residents speaking Spanish at home (%)
Residents speaking Spanish at home - Born in the United States (%)
Residents speaking Spanish at home - Native, born elsewhere (%)
Residents speaking Spanish at home - Foreign born (%)
Residents speaking other language at home (%)
Residents speaking other language at home - Born in the United States (%)
Residents speaking other language at home - Native, born elsewhere (%)
Residents speaking other language at home - Foreign born (%)
Marital status - Never married (%)
Marital status - Now married (%)
Marital status - Separated (%)
Marital status - Widowed (%)
Marital status - Divorced (%)
Ancestries Reported - Arab (%)
Ancestries Reported - Czech (%)
Ancestries Reported - Danish (%)
Ancestries Reported - Dutch (%)
Ancestries Reported - English (%)
Ancestries Reported - French (%)
Ancestries Reported - French Canadian (%)
Ancestries Reported - German (%)
Ancestries Reported - Greek (%)
Ancestries Reported - Hungarian (%)
Ancestries Reported - Irish (%)
Ancestries Reported - Italian (%)
Ancestries Reported - Lithuanian (%)
Ancestries Reported - Norwegian (%)
Ancestries Reported - Polish (%)
Ancestries Reported - Portuguese (%)
Ancestries Reported - Russian (%)
Ancestries Reported - Scotch-Irish (%)
Ancestries Reported - Scottish (%)
Ancestries Reported - Slovak (%)
Ancestries Reported - Subsaharan African (%)
Ancestries Reported - Swedish (%)
Ancestries Reported - Swiss (%)
Ancestries Reported - Ukrainian (%)
Ancestries Reported - United States (%)
Ancestries Reported - Welsh (%)
Ancestries Reported - West Indian (%)
Ancestries Reported - Other (%)
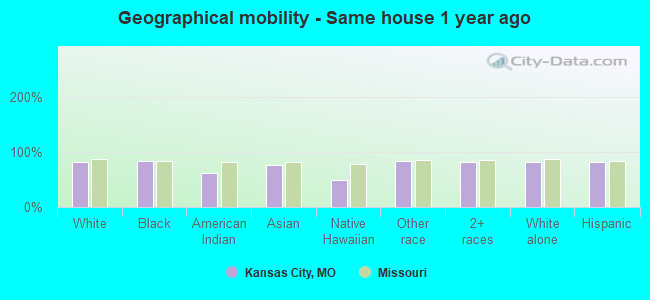
Geographical mobility - Same house 1 year ago (%)
Geographical mobility - Same house 1 year ago (%) - White
Geographical mobility - Same house 1 year ago (%) - Black or African American
Geographical mobility - Same house 1 year ago (%) - Asian
Geographical mobility - Same house 1 year ago (%) - Hispanic or Latino
Geographical mobility - Same house 1 year ago (%) - American Indian and Alaska Native
Geographical mobility - Same house 1 year ago (%) - Multirace
Geographical mobility - Same house 1 year ago (%) - Other Race
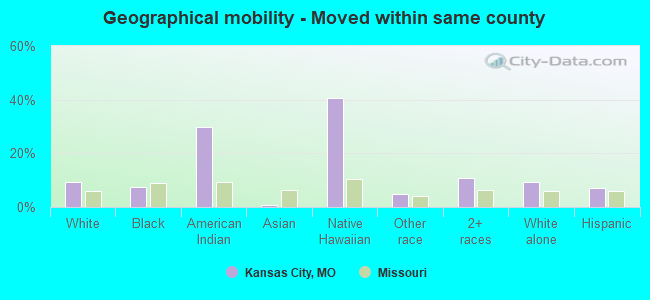
Geographical mobility - Moved within same county (%)
Geographical mobility - Moved within same county (%) - White
Geographical mobility - Moved within same county (%) - Black or African American
Geographical mobility - Moved within same county (%) - Asian
Geographical mobility - Moved within same county (%) - Hispanic or Latino
Geographical mobility - Moved within same county (%) - American Indian and Alaska Native
Geographical mobility - Moved within same county (%) - Multirace
Geographical mobility - Moved within same county (%) - Other Race
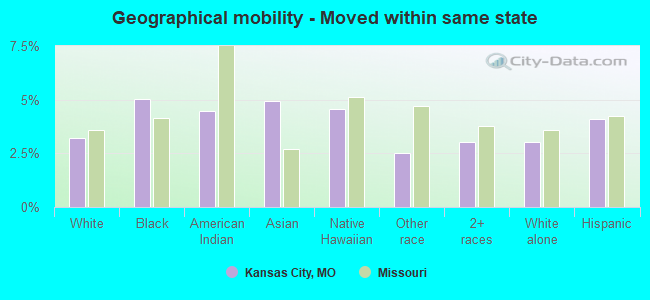
Geographical mobility - Moved from different county within same state (%)
Geographical mobility - Moved from different county within same state (%) - White
Geographical mobility - Moved from different county within same state (%) - Black or African American
Geographical mobility - Moved from different county within same state (%) - Asian
Geographical mobility - Moved from different county within same state (%) - Hispanic or Latino
Geographical mobility - Moved from different county within same state (%) - American Indian and Alaska Native
Geographical mobility - Moved from different county within same state (%) - Multirace
Geographical mobility - Moved from different county within same state (%) - Other Race
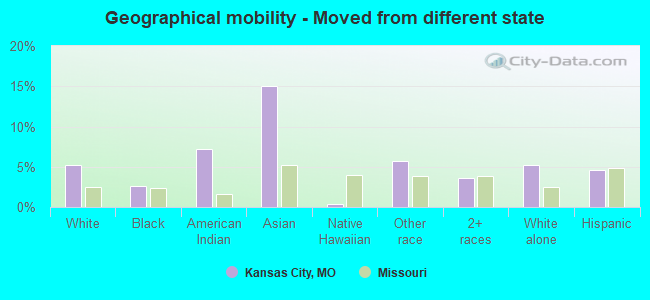
Geographical mobility - Moved from different state (%)
Geographical mobility - Moved from different state (%) - White
Geographical mobility - Moved from different state (%) - Black or African American
Geographical mobility - Moved from different state (%) - Asian
Geographical mobility - Moved from different state (%) - Hispanic or Latino
Geographical mobility - Moved from different state (%) - American Indian and Alaska Native
Geographical mobility - Moved from different state (%) - Multirace
Geographical mobility - Moved from different state (%) - Other Race
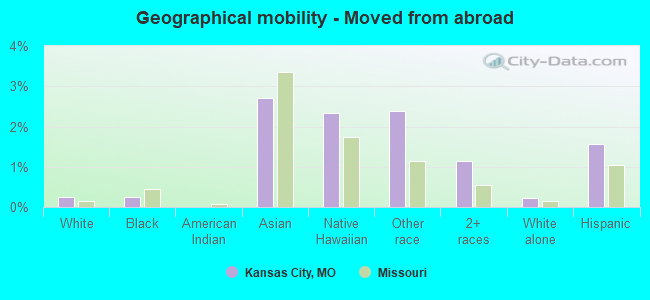
Geographical mobility - Moved from abroad (%)
Geographical mobility - Moved from abroad (%) - White
Geographical mobility - Moved from abroad (%) - Black or African American
Geographical mobility - Moved from abroad (%) - Asian
Geographical mobility - Moved from abroad (%) - Hispanic or Latino
Geographical mobility - Moved from abroad (%) - American Indian and Alaska Native
Geographical mobility - Moved from abroad (%) - Multirace
Geographical mobility - Moved from abroad (%) - Other Race
Place of birth for the foreign-born population - Ireland (%)
Place of birth for the foreign-born population - Denmark (%)
Place of birth for the foreign-born population - Norway (%)
Place of birth for the foreign-born population - Sweden (%)
Place of birth for the foreign-born population - United Kingdom (%)
Place of birth for the foreign-born population - England (%)
Place of birth for the foreign-born population - Scotland (%)
Place of birth for the foreign-born population - Other Northern Europe (%)
Place of birth for the foreign-born population - Austria (%)
Place of birth for the foreign-born population - Belgium (%)
Place of birth for the foreign-born population - France (%)
Place of birth for the foreign-born population - Germany (%)
Place of birth for the foreign-born population - Netherlands (%)
Place of birth for the foreign-born population - Switzerland (%)
Place of birth for the foreign-born population - Other Western Europe (%)
Place of birth for the foreign-born population - Greece (%)
Place of birth for the foreign-born population - Italy (%)
Place of birth for the foreign-born population - Portugal (%)
Place of birth for the foreign-born population - Spain (%)
Place of birth for the foreign-born population - Other Southern Europe (%)
Place of birth for the foreign-born population - Albania (%)
Place of birth for the foreign-born population - Belarus (%)
Place of birth for the foreign-born population - Bosnia and Herzegovina (%)
Place of birth for the foreign-born population - Bulgaria (%)
Place of birth for the foreign-born population - Croatia (%)
Place of birth for the foreign-born population - Czechoslovakia (%)
Place of birth for the foreign-born population - Hungary (%)
Place of birth for the foreign-born population - Latvia (%)
Place of birth for the foreign-born population - Lithuania (%)
Place of birth for the foreign-born population - North Macedonia (Macedonia) (%)
Place of birth for the foreign-born population - Moldova (%)
Place of birth for the foreign-born population - Poland (%)
Place of birth for the foreign-born population - Romania (%)
Place of birth for the foreign-born population - Russia (%)
Place of birth for the foreign-born population - Serbia (%)
Place of birth for the foreign-born population - Ukraine (%)
Place of birth for the foreign-born population - Other Eastern Europe (%)
Place of birth for the foreign-born population - China (%)
Place of birth for the foreign-born population - Hong Kong (%)
Place of birth for the foreign-born population - Taiwan (%)
Place of birth for the foreign-born population - Japan (%)
Place of birth for the foreign-born population - Korea (%)
Place of birth for the foreign-born population - Other Eastern Asia (%)
Place of birth for the foreign-born population - Afghanistan (%)
Place of birth for the foreign-born population - Bangladesh (%)
Place of birth for the foreign-born population - India (%)
Place of birth for the foreign-born population - Iran (%)
Place of birth for the foreign-born population - Kazakhstan (%)
Place of birth for the foreign-born population - Nepal (%)
Place of birth for the foreign-born population - Pakistan (%)
Place of birth for the foreign-born population - Sri Lanka (%)
Place of birth for the foreign-born population - Uzbekistan (%)
Place of birth for the foreign-born population - Other South Central Asia (%)
Place of birth for the foreign-born population - Burma (%)
Place of birth for the foreign-born population - Cambodia (%)
Place of birth for the foreign-born population - Indonesia (%)
Place of birth for the foreign-born population - Laos (%)
Place of birth for the foreign-born population - Malaysia (%)
Place of birth for the foreign-born population - Philippines (%)
Place of birth for the foreign-born population - Singapore (%)
Place of birth for the foreign-born population - Thailand (%)
Place of birth for the foreign-born population - Vietnam (%)
Place of birth for the foreign-born population - Other South Eastern Asia (%)
Place of birth for the foreign-born population - Armenia (%)
Place of birth for the foreign-born population - Iraq (%)
Place of birth for the foreign-born population - Israel (%)
Place of birth for the foreign-born population - Jordan (%)
Place of birth for the foreign-born population - Kuwait (%)
Place of birth for the foreign-born population - Lebanon (%)
Place of birth for the foreign-born population - Saudi Arabia (%)
Place of birth for the foreign-born population - Syria (%)
Place of birth for the foreign-born population - Turkey (%)
Place of birth for the foreign-born population - Yemen (%)
Place of birth for the foreign-born population - Other Western Asia (%)
Place of birth for the foreign-born population - Eritrea (%)
Place of birth for the foreign-born population - Ethiopia (%)
Place of birth for the foreign-born population - Kenya (%)
Place of birth for the foreign-born population - Somalia (%)
Place of birth for the foreign-born population - Uganda (%)
Place of birth for the foreign-born population - Zimbabwe (%)
Place of birth for the foreign-born population - Other Eastern Africa (%)
Place of birth for the foreign-born population - Cameroon (%)
Place of birth for the foreign-born population - Congo (%)
Place of birth for the foreign-born population - Democratic Republic of Congo (Zaire) (%)
Place of birth for the foreign-born population - Other Middle Africa (%)
Place of birth for the foreign-born population - Egypt (%)
Place of birth for the foreign-born population - Morocco (%)
Place of birth for the foreign-born population - Sudan (%)
Place of birth for the foreign-born population - Other Northern Africa (%)
Place of birth for the foreign-born population - South Africa (%)
Place of birth for the foreign-born population - Other Southern Africa (%)
Place of birth for the foreign-born population - Cabo Verde (%)
Place of birth for the foreign-born population - Ghana (%)
Place of birth for the foreign-born population - Liberia (%)
Place of birth for the foreign-born population - Nigeria (%)
Place of birth for the foreign-born population - Senegal (%)
Place of birth for the foreign-born population - Sierra Leone (%)
Place of birth for the foreign-born population - Other Western Africa (%)
Place of birth for the foreign-born population - Australia (%)
Place of birth for the foreign-born population - New Zealand (%)
Place of birth for the foreign-born population - Fiji (%)
Place of birth for the foreign-born population - Micronesia (%)
Place of birth for the foreign-born population - Bahamas (%)
Place of birth for the foreign-born population - Barbados (%)
Place of birth for the foreign-born population - Cuba (%)
Place of birth for the foreign-born population - Dominica (%)
Place of birth for the foreign-born population - Dominican Republic (%)
Place of birth for the foreign-born population - Grenada (%)
Place of birth for the foreign-born population - Haiti (%)
Place of birth for the foreign-born population - Jamaica (%)
Place of birth for the foreign-born population - St. Vincent and the Grenadines (%)
Place of birth for the foreign-born population - Trinidad and Tobago (%)
Place of birth for the foreign-born population - West Indies (%)
Place of birth for the foreign-born population - Other Caribbean (%)
Place of birth for the foreign-born population - Belize (%)
Place of birth for the foreign-born population - Costa Rica (%)
Place of birth for the foreign-born population - El Salvador (%)
Place of birth for the foreign-born population - Guatemala (%)
Place of birth for the foreign-born population - Honduras (%)
Place of birth for the foreign-born population - Mexico (%)
Place of birth for the foreign-born population - Nicaragua (%)
Place of birth for the foreign-born population - Panama (%)
Place of birth for the foreign-born population - Other Central America (%)
Place of birth for the foreign-born population - Argentina (%)
Place of birth for the foreign-born population - Bolivia (%)
Place of birth for the foreign-born population - Brazil (%)
Place of birth for the foreign-born population - Chile (%)
Place of birth for the foreign-born population - Colombia (%)
Place of birth for the foreign-born population - Ecuador (%)
Place of birth for the foreign-born population - Guyana (%)
Place of birth for the foreign-born population - Peru (%)
Place of birth for the foreign-born population - Uruguay (%)
Place of birth for the foreign-born population - Venezuela (%)
Place of birth for the foreign-born population - Other South America (%)
Place of birth for the foreign-born population - Canada (%)
Place of birth for the foreign-born population - Other Northern America (%)
Place of birth for the foreign-born population - Other (%)
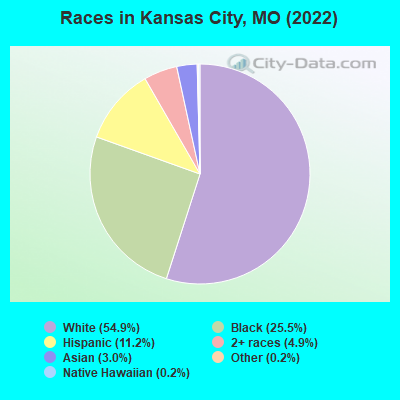
According to 2022 data, the most numerous races in Kansas City, MO are White alone (279,743 residents), Black alone (130,000 residents), and Two or more races (25,137 residents). 88.0% of Kansas City residents speak English at home. 8.0% of Kansas City, MO residents are foreign-born (3.7% born in Latin America, 2.3% born in Asia, 1.4% born in Africa), which is 50.0% greater than the foreign-born rate of 4.0% across the entire state of Missouri.
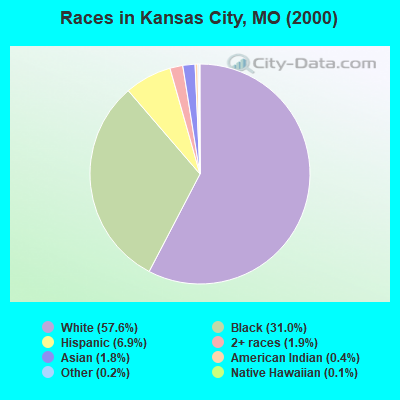
Race distribution in Kansas City
2000 2022
254,471 57.6% White alone 136,921 31.0% Black alone 30,604 6.9% Hispanic 8,466 1.9% Two or more races 8,100 1.8% Asian alone 1,784 0.4% American Indian alone 757 0.2% Other race alone 442 0.1% Native Hawaiian and Other
279,743 54.9% White alone 130,000 25.5% Black alone 57,052 11.2% Hispanic 25,137 4.9% Two or more races 15,271 3.0% Asian alone 808 0.2% Other race alone 770 0.2% Native Hawaiian and Other 466 0.09% American Indian alone
2000 2022
4,686,474 83.8% White alone 625,667 11.2% Black alone 118,592 2.1% Hispanic 71,905 1.3% Two or more races 61,041 1.1% Asian alone 23,302 0.4% American Indian alone 5,291 0.09% Other race alone 2,939 0.05% Native Hawaiian and Other
4,733,411 76.6% White alone 656,739 10.6% Black alone 316,300 5.1% Two or more races 291,763 4.7% Hispanic 132,436 2.1% Asian alone 27,467 0.4% Other race alone 12,313 0.2% American Indian alone 7,528 0.1% Native Hawaiian and Other
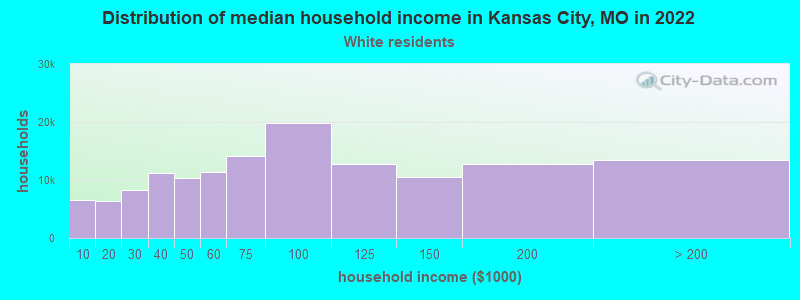
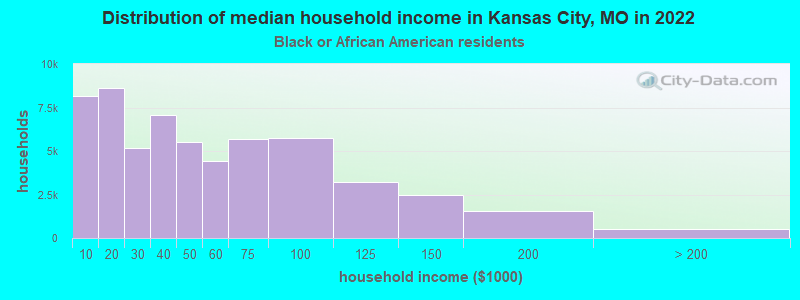
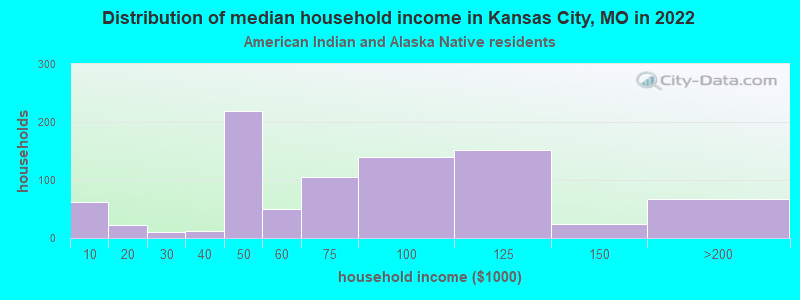
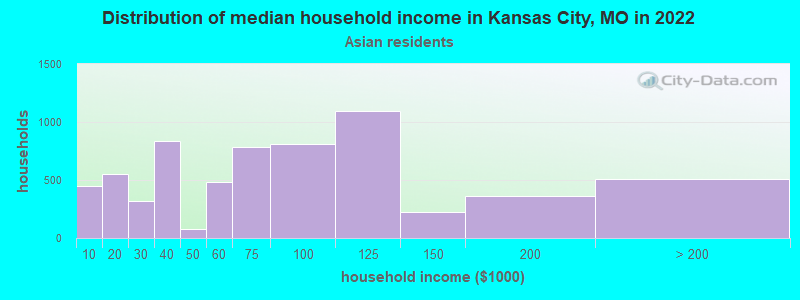
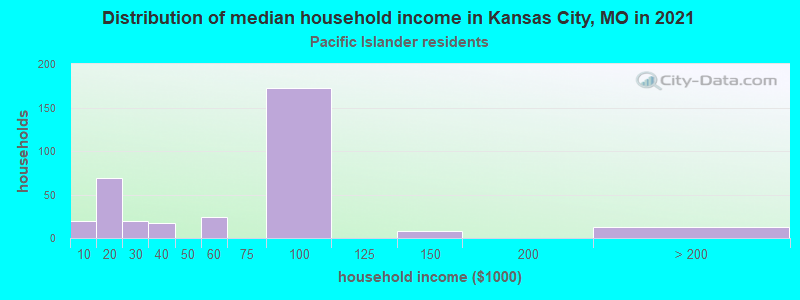
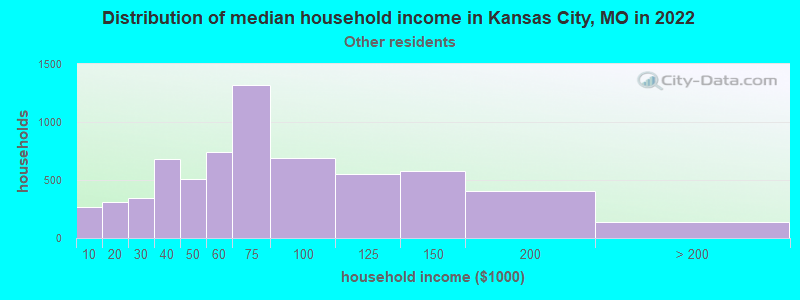
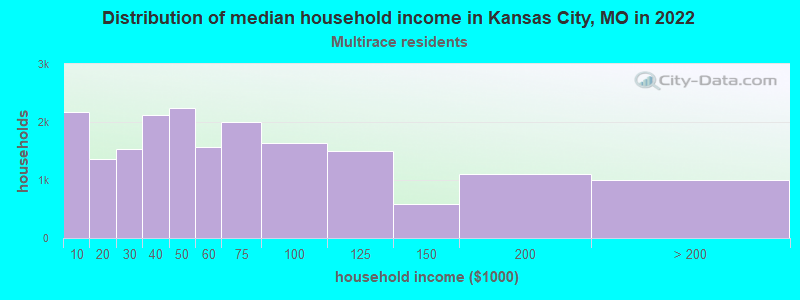
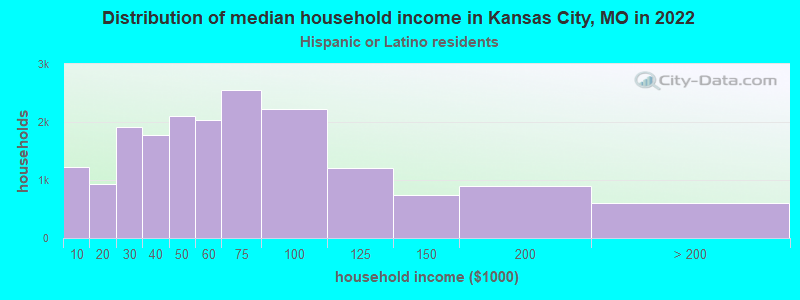
Income and house value in Kansas City Median household income in 2022 $77,081 White non-Hispanic householders$40,109 Black householders$107,938 American Indian and Alaska Native householders$67,161 Asian householders$60,184 Some other race householders$49,815 Two or more races householders$57,078 Hispanic or Latino race householdersMedian 2022 house value $279,347 White Non-Hispanic householders$153,181 Black or African American householders$220,431 American Indian or Alaska Native householders $230,203 Asian householders$172,436 Native Hawaiian and other Pacific Islander householders$145,421 Some other race householders$200,026 Two or more races householders$167,838 Hispanic or Latino householders
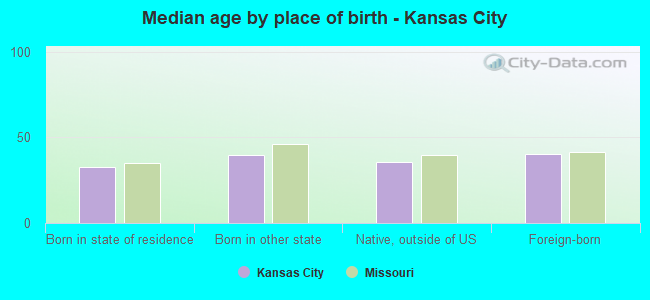
Median age by race in Kansas City
38.9 Median age for White residents38.0 39.9 34.6 Median age for Black or African American residents32.4 36.3 39.0 Median age for American Indian / Alaska Native residents50.3 32.4 34.6 Median age for Asian residents33.9 35.2 39.1 Median age for Native Hawaiian / Pacific Islander residents25.2 36.1 27.5 Median age for Other race residents27.5 27.6 28.9 Median age for Two or more races residents29.9 27.8 39.3 Median age for White alone residents38.4 40.2 28.7 Median age for Hispanic or Latino residents29.6 28.2
Owner/renter occupied households by race in Kansas City
House owners and renters - White residents 84,488 61.5% Owner occupied52,801 38.5% Renter occupiedHouse owners and renters - Black or African American residents 21,984 37.9% Owner occupied36,095 62.1% Renter occupiedHouse owners and renters - American Indian / Alaska Native residents 244 37.1% Owner occupied413 62.9% Renter occupiedHouse owners and renters - Asian residents 3,207 49.4% Owner occupied3,285 50.6% Renter occupiedHouse owners and renters - Native Hawaiian / Pacific Islander residents 45 17.3% Owner occupied214 82.7% Renter occupiedHouse owners and renters - Other race residents 3,401 60.7% Owner occupied2,202 39.3% Renter occupiedHouse owners and renters - Two or more races residents 8,863 47.1% Owner occupied9,942 52.9% Renter occupiedHouse owners and renters - White alone residents 82,114 61.7% Owner occupied51,012 38.3% Renter occupiedHouse owners and renters - Hispanic or Latino residents 10,196 56.0% Owner occupied8,026 44.0% Renter occupied
Language usage in Kansas City
English speakers - Total 88.0% of residents of Kansas City speak English at home.
6.9% of residents speak Spanish at home 19,432 58.6% Speak English very well13,701 41.4% Speak English less than very well5.1% of residents speak other language at home 16,008 66.0% Speak English very well8,230 34.0% Speak English less than very well
English speakers - Born in the United States 94.4% of residents of Kansas City speak English at home.
4.2% of residents speak Spanish at home 6,383 81.4% Speak English very well1,462 18.6% Speak English less than very well1.4% of residents speak other language at home 2,369 90.9% Speak English very well238 9.1% Speak English less than very well
English speakers - Native, born elsewhere 60.4% of residents of Kansas City speak English at home.
36.3% of residents speak Spanish at home 1,227 69.7% Speak English very well534 30.3% Speak English less than very well3.3% of residents speak other language at home 161 100.0% Speak English very well
English speakers - Foreign-born 14.5% of residents of Kansas City speak English at home.
40.6% of residents speak Spanish at home 4,901 31.2% Speak English very well10,791 68.8% Speak English less than very well44.9% of residents speak other language at home 9,766 56.4% Speak English very well7,562 43.6% Speak English less than very well
White (Caucasian) - Speak only English Native:
97.5% (262,956)Foreign-born:
21.4% (1,248)
White (Caucasian) - Speak another language Native:
2.5% (6,621)Foreign-born:
78.6% (4,582)
Black or African American - Speak only English Native:
96.7% (110,991)Foreign-born:
26.4% (1,993)
Black or African American - Speak another language Native:
3.3% (3,825)Foreign-born:
73.6% (5,564)
American Indian / Alaska Native - Speak only English Native:
67.3% (1,012)Foreign-born:
100.0% (326)
American Indian / Alaska Native - Speak another language Native:
42.6% (640)Foreign-born:
50.4% (164)
Asian - Speak only English Native:
68.0% (3,321)Foreign-born:
12.9% (1,216)
Asian - Speak another language Native:
32.0% (1,563)Foreign-born:
87.1% (8,176)
Native Hawaiian / Pacific Islander - Speak only English Native:
78.1% (558)Foreign-born:
56.3% (191)
Native Hawaiian / Pacific Islander - Speak another language Native:
21.8% (155)Foreign-born:
47.9% (162)
Other race - Speak only English Native:
49.6% (5,477)Foreign-born:
11.7% (776)
Other race - Speak another language Native:
50.4% (5,569)Foreign-born:
88.3% (5,852)
Two or more races - Speak only English Native:
83.5% (30,796)Foreign-born:
3.4% (304)
Two or more races - Speak another language Native:
16.5% (6,075)Foreign-born:
96.6% (8,555)
White alone - Speak only English Native:
98.4% (257,729)Foreign-born:
29.1% (1,248)
White alone - Speak another language Native:
1.6% (4,170)Foreign-born:
70.9% (3,040)
Hispanic or Latino - Speak only English Native:
59.6% (21,290)Foreign-born:
6.7% (1,120)
Hispanic or Latino - Speak another language Native:
40.4% (14,461)Foreign-born:
93.3% (15,514)
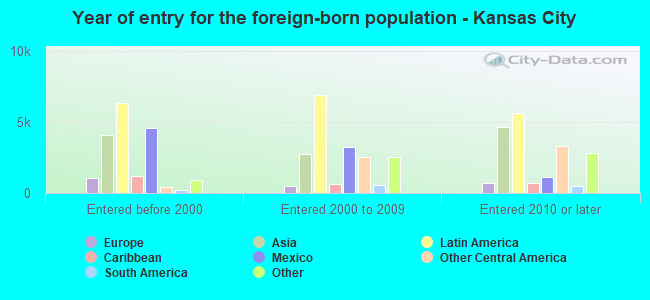
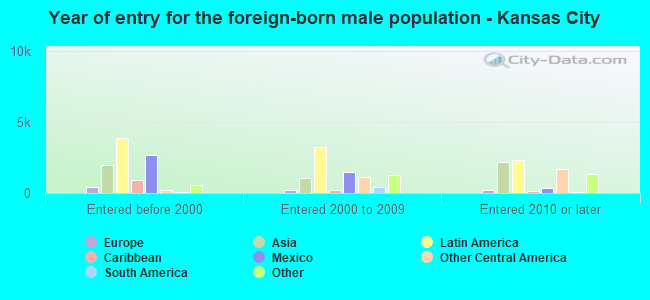
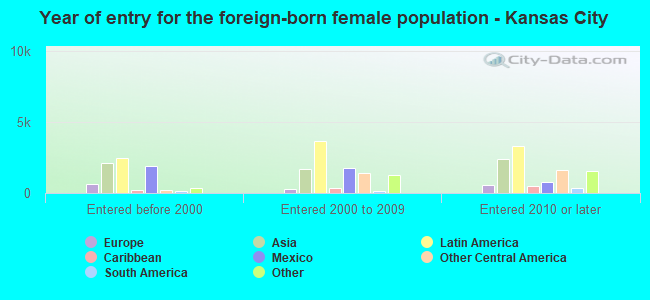
Foreign-born residents in Kansas City 40,496 residents are foreign born (3.7% Latin America , 2.3% Asia , 1.4% Africa ).
This city:
8.0%Missouri:
4.2%
Marital status for residents in Kansas City Marital status - White (Caucasian) population 15 years and over
Males 38.1% Never married47.3% Now married1.1% Separated2.2% Widowed11.4% DivorcedFemales 30.5% Never married44.9% Now married1.5% Separated7.7% Widowed15.4% DivorcedWomen who gave birth in the past 12 months Now married:
71.1% (2,878)Unmarried:
28.9% (1,169)
Women who did not give birth in the past 12 months Now married:
42.7% (30,400)Unmarried:
57.3% (40,748)
Marital status - Black or African American population 15 years and over
Males 52.0% Never married30.6% Now married1.7% Separated3.5% Widowed12.1% DivorcedFemales 55.3% Never married21.7% Now married2.2% Separated7.8% Widowed13.0% DivorcedWomen who gave birth in the past 12 months Now married:
14.1% (185)Unmarried:
85.9% (1,124)
Women who did not give birth in the past 12 months Now married:
16.7% (5,091)Unmarried:
83.3% (25,399)
Marital status - American Indian / Alaska Native population 15 years and over
Males 40.7% Never married30.2% Now married6.9% Separated3.2% Widowed19.0% DivorcedFemales 44.3% Never married36.8% Now married0.9% Separated7.0% Widowed11.0% DivorcedWomen who gave birth in the past 12 months Now married:
83.6% (60)Unmarried:
16.4% (12)
Women who did not give birth in the past 12 months Now married:
19.5% (67)Unmarried:
80.5% (274)
Marital status - Asian population 15 years and over
Males 29.9% Never married55.8% Now married0.5% Separated0.0% Widowed13.7% DivorcedFemales 26.3% Never married54.4% Now married6.8% Separated5.6% Widowed6.9% DivorcedWomen who gave birth in the past 12 months Now married:
100.0% (308)Unmarried:
0.0% (0)
Women who did not give birth in the past 12 months Now married:
56.7% (2,550)Unmarried:
43.3% (1,947)
Marital status - Native Hawaiian / Pacific Islander population 15 years and over
Males 39.8% Never married48.5% Now married0.0% Separated0.0% Widowed11.7% DivorcedFemales 41.4% Never married44.6% Now married0.0% Separated6.4% Widowed7.6% DivorcedWomen who gave birth in the past 12 months Now married:
27.5% (9)Unmarried:
72.5% (23)
Women who did not give birth in the past 12 months Now married:
52.6% (164)Unmarried:
47.4% (148)
Marital status - Other race population 15 years and over
Males 43.6% Never married40.7% Now married4.2% Separated0.7% Widowed10.8% DivorcedFemales 41.0% Never married40.9% Now married0.0% Separated5.6% Widowed12.6% DivorcedWomen who gave birth in the past 12 months Now married:
26.9% (89)Unmarried:
73.1% (242)
Women who did not give birth in the past 12 months Now married:
36.5% (1,837)Unmarried:
63.5% (3,199)
Marital status - Two or more races population 15 years and over
Males 44.1% Never married39.8% Now married0.9% Separated1.5% Widowed13.7% DivorcedFemales 43.7% Never married31.7% Now married3.9% Separated3.3% Widowed17.4% DivorcedWomen who gave birth in the past 12 months Now married:
21.6% (123)Unmarried:
78.4% (447)
Women who did not give birth in the past 12 months Now married:
35.8% (4,602)Unmarried:
64.2% (8,261)
Marital status - White alone, not Hispanic / Latino population 15 years and over
Males 37.9% Never married47.5% Now married1.0% Separated2.2% Widowed11.3% DivorcedFemales 30.2% Never married44.9% Now married1.6% Separated7.9% Widowed15.4% DivorcedWomen who gave birth in the past 12 months Now married:
71.7% (2,831)Unmarried:
28.3% (1,117)
Women who did not give birth in the past 12 months Now married:
42.7% (29,244)Unmarried:
57.3% (39,212)
Marital status - Hispanic or Latino population 15 years and over
Males 44.7% Never married41.2% Now married2.8% Separated0.6% Widowed10.8% DivorcedFemales 43.8% Never married36.8% Now married2.3% Separated3.8% Widowed13.3% DivorcedWomen who gave birth in the past 12 months Now married:
41.2% (206)Unmarried:
58.8% (294)
Women who did not give birth in the past 12 months Now married:
36.9% (5,702)Unmarried:
63.1% (9,746)
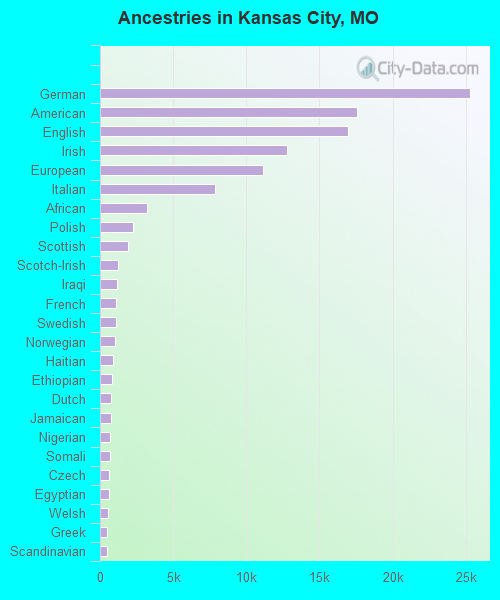
Ancestries in Kansas City
25,318 9.5% German17,555 6.6% American16,958 6.4% English12,798 4.8% Irish11,155 4.2% European7,875 3.0% Italian3,242 1.2% African2,260 0.8% Polish1,887 0.7% Scottish1,236 0.5% Scotch-Irish1,144 0.4% Iraqi1,111 0.4% French1,076 0.4% Swedish1,039 0.4% Norwegian912 0.3% Haitian805 0.3% Ethiopian783 0.3% Dutch749 0.3% Jamaican699 0.3% Nigerian690 0.3% Somali632 0.2% Czech588 0.2% Egyptian514 0.2% Welsh499 0.2% Greek482 0.2% Scandinavian455 0.2% Arab419 0.2% Eastern European408 0.2% Danish392 0.1% Iranian390 0.1% Ukrainian381 0.1% Northern European371 0.1% Croatian358 0.1% Canadian358 0.1% British352 0.1% Belgian324 0.1% Lebanese306 0.1% Palestinian303 0.1% Moroccan288 0.1% French Canadian288 0.1% Yugoslavian281 0.1% Russian272 0.1% Syrian242 0.09% Kenyan236 0.09% Afghan229 0.09% Turkish189 0.07% Ghanaian175 0.07% Ugandan163 0.06% Sierra Leonean139 0.05% Swiss122 0.05% Jordanian112 0.04% Australian110 0.04% Lithuanian98 0.04% Austrian93 0.03% Icelander91 0.03% Czechoslovakian89 0.03% Trinidadian and Tobagonian85 0.03% Pennsylvania German85 0.03% German Russian78 0.03% Slovak78 0.03% Sudanese76 0.03% South African75 0.03% Romanian72 0.03% Brazilian70 0.03% Liberian57 0.02% Bahamian54 0.02% Luxembourger53 0.02% Slavic46 0.02% Finnish43 0.02% Hungarian37 0.01% Armenian32 0.01% Portuguese32 0.01% Slovene31 0.01% New Zealander28 0.01% Guyanese21 0.01% British West Indian21 0.01% West Indian20 0.01% Albanian
Geographical mobility in Kansas City Same house 1 year ago 235,051 81.9% White (Caucasian)108,945 84.8% Black or African American1,197 61.5% American Indian / Alaska Native11,470 76.5% Asian640 49.7% Native Hawaiian / Pacific Islander15,489 84.6% Other race41,196 81.4% Two or more races227,889 82.3% White alone, not Hispanic / Latino46,361 82.6% Hispanic or LatinoMoved within same county 26,897 9.4% White / Caucasian9,459 7.4% Black or African American578 29.7% American Indian / Alaska Native116 0.8% Asian522 40.5% Native Hawaiian / Pacific Islander883 4.8% Other race5,432 10.7% Two or more races25,549 9.2% White alone, not Hispanic / Latino3,980 7.1% Hispanic or LatinoMoved within same state 9,193 3.2% White / Caucasian6,451 5.0% Black or African American87 4.5% American Indian / Alaska Native740 4.9% Asian59 4.6% Native Hawaiian / Pacific Islander461 2.5% Other race1,525 3.0% Two or more races8,356 3.0% White alone, not Hispanic / Latino2,293 4.1% Hispanic or LatinoMoved from different state 15,001 5.2% White / Caucasian3,344 2.6% Black or African American141 7.2% American Indian / Alaska Native2,256 15.1% Asian4 0.3% Native Hawaiian / Pacific Islander1,045 5.7% Other race1,852 3.7% Two or more races14,439 5.2% White alone, not Hispanic / Latino2,593 4.6% Hispanic or LatinoMoved from abroad 717 0.2% White323 0.3% Black or African American405 2.7% Asian30 2.3% Native Hawaiian / Pacific Islander435 2.4% Other race582 1.2% Two or more races647 0.2% White alone, not Hispanic / Latino876 1.6% Hispanic or Latino
Children Nativity (place of birth) in Kansas City
Children under 6 years - Living with two parents Both parents native 16,332 100.0% NativeBoth parents foreign-born 2,159 100.0% NativeOne native, one foreign-born parent 1,873 100.0% NativeChildren under 6 years - Living with one parent Native parent 13,101 100.0% NativeForeign-born parent 1,190 75.7% Native383 24.3% Foreign-bornChildren 6 to 17 years - Living with two parents Both parents native 30,108 98.7% Native385 1.3% Foreign-bornBoth parents foreign-born 6,334 88.4% Native828 11.6% Foreign-bornOne native, one foreign-born parent 1,533 96.9% Native49 3.1% Foreign-bornChildren 6 to 17 years - Living with one parent Native parent 24,674 100.0% NativeForeign-born parent 2,367 63.3% Native1,370 36.7% Foreign-born
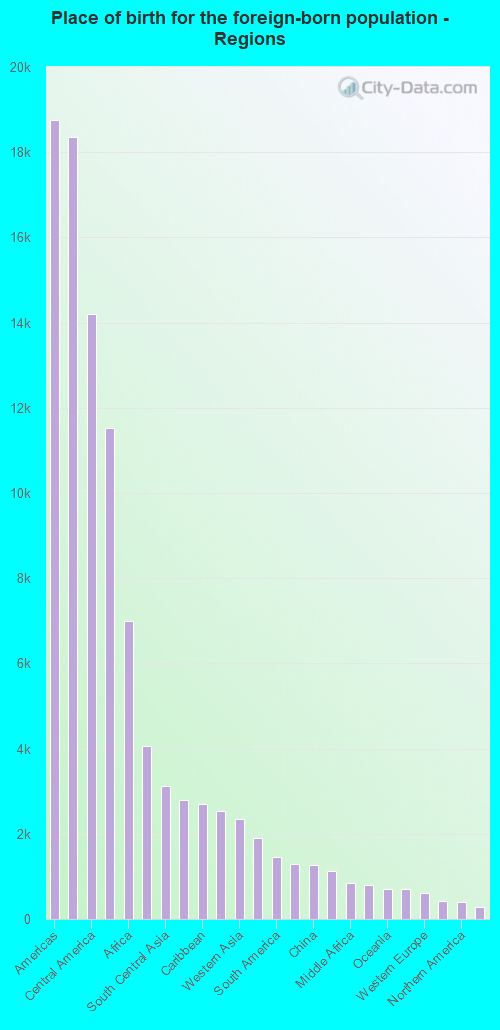
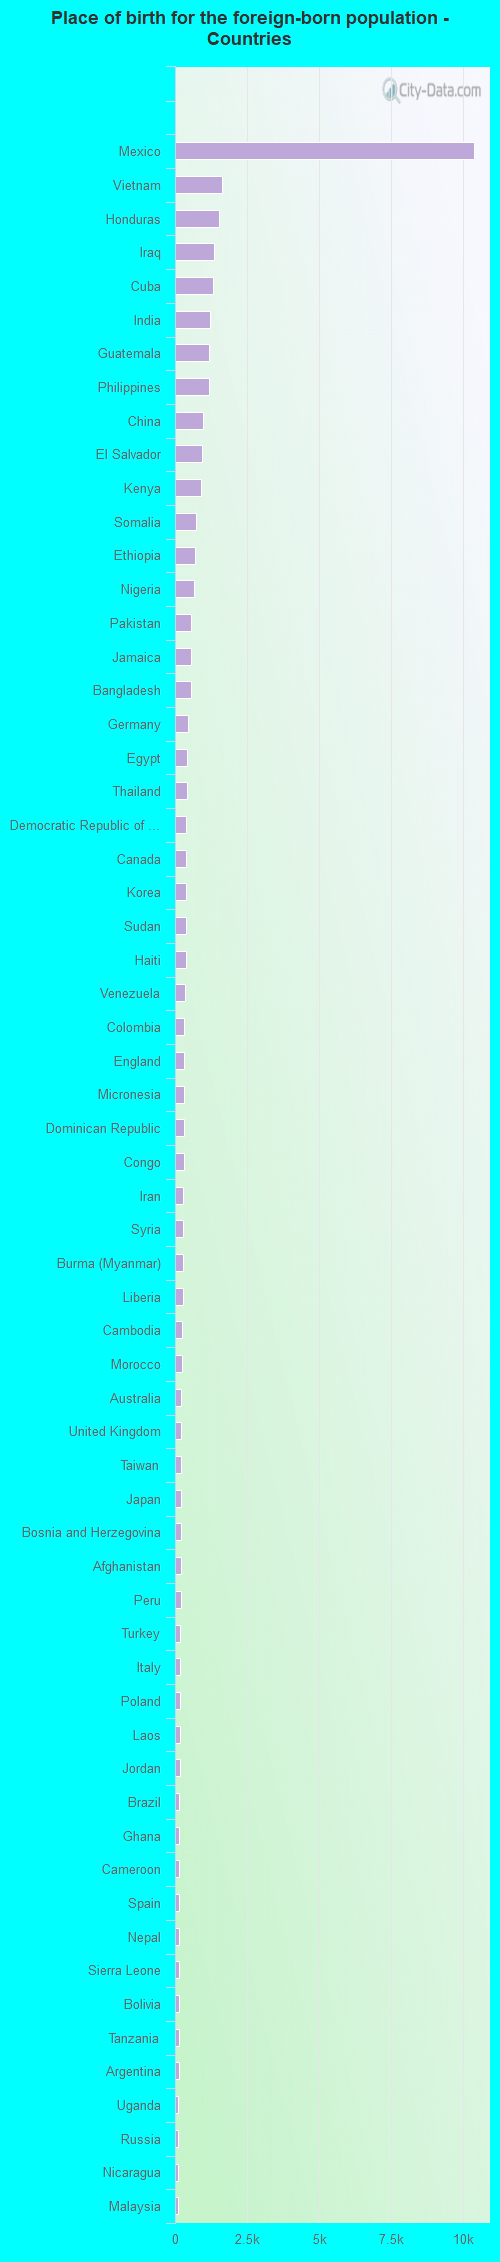
Place of birth for residents in Kansas City 18,762 Americas18,366 Latin America14,201 Central America11,515 Asia6,984 Africa4,066 South Eastern Asia3,125 South Central Asia2,805 Eastern Africa2,703 Caribbean2,535 Europe2,348 Western Asia1,892 Eastern Asia1,461 South America1,283 Western Africa1,265 China1,129 Northern Africa841 Middle Africa801 Eastern Europe698 Oceania695 Northern Europe604 Western Europe434 Southern Europe396 Northern America273 Australia and New Zealand Subregion87 Southern Africa10,377 Mexico1,632 Vietnam1,543 Honduras1,361 Iraq1,316 Cuba1,226 India1,188 Guatemala1,167 Philippines985 China943 El Salvador908 Kenya720 Somalia684 Ethiopia671 Nigeria568 Pakistan551 Jamaica540 Bangladesh464 Germany432 Egypt413 Thailand397 Democratic Republic of Congo (Zaire)381 Canada378 Korea377 Sudan376 Haiti347 Venezuela328 Colombia318 England308 Micronesia298 Dominican Republic298 Congo277 Iran274 Syria274 Burma (Myanmar)267 Liberia254 Cambodia230 Morocco224 Australia220 United Kingdom220 Taiwan219 Japan208 Bosnia and Herzegovina208 Afghanistan195 Peru186 Turkey181 Italy160 Poland160 Laos158 Jordan151 Brazil147 Ghana145 Cameroon141 Spain136 Nepal134 Sierra Leone132 Bolivia130 Tanzania126 Argentina113 Uganda111 Russia105 Nicaragua100 Malaysia87 South Africa86 Trinidad and Tobago84 Kuwait80 Bulgaria74 Zimbabwe74 Greece74 France69 Yemen67 Sri Lanka65 Israel62 Indonesia61 Saudi Arabia60 Hong Kong60 Chile59 Ireland56 Scotland51 Uruguay49 New Zealand48 Ukraine40 Ecuador39 Lebanon39 Kazakhstan38 Eritrea38 Bahamas36 Portugal35 Fiji34 Netherlands32 Serbia29 Senegal27 Belarus27 Guyana27 Costa Rica26 Marshall Islands25 Algeria25 Togo24 Romania22 Switzerland21 Hungary18 Denmark17 Czechoslovakia14 Belize12 Bhutan8 Belgium5 Sweden
Grandparents responsible for own grandchildren in Kansas City
Grandparents (30 to 59 years) White / Caucasian 50 5.2% Responsible for grandchildren910 94.8% Not responsible for grandchildrenBlack or African American 892 47.4% Responsible for grandchildren988 52.6% Not responsible for grandchildrenAmerican Indian / Alaska Native 9 100.0% Not responsible for grandchildrenAsian 70 100.0% Not responsible for grandchildrenNative Hawaiian / Pacific Islander 35 100.0% Responsible for grandchildrenOther race 170 48.1% Responsible for grandchildren183 51.9% Not responsible for grandchildrenTwo or more races 140 73.5% Responsible for grandchildren50 26.5% Not responsible for grandchildrenWhite alone, not Hispanic / Latino 50 5.8% Responsible for grandchildren817 94.2% Not responsible for grandchildrenHispanic or Latino 288 50.6% Responsible for grandchildren282 49.4% Not responsible for grandchildrenGrandparents (60 years and over) White / Caucasian 496 30.4% Responsible for grandchildren1,135 69.6% Not responsible for grandchildrenBlack or African American 636 43.7% Responsible for grandchildren820 56.3% Not responsible for grandchildrenAmerican Indian / Alaska Native 56 100.0% Responsible for grandchildrenAsian 11 5.8% Responsible for grandchildren179 94.2% Not responsible for grandchildrenOther race 42 11.0% Responsible for grandchildren340 89.0% Not responsible for grandchildrenTwo or more races 46 21.4% Responsible for grandchildren167 78.6% Not responsible for grandchildrenWhite alone, not Hispanic / Latino 496 30.4% Responsible for grandchildren1,135 69.6% Not responsible for grandchildrenHispanic or Latino 191 20.7% Responsible for grandchildren732 79.3% Not responsible for grandchildren
Zip codes: 64081 , 64082 , 64101 , 64102, 64105 , 64106 , 64108 , 64109 , 64110 , 64111 , 64112 , 64113 , 64114 , 64123 , 64124 , 64125 , 64126 , 64127 , 64128 , 64129 , 64130 , 64131 , 64132 , 64134 , 64138 , 64139 , 64145 , 64146 , 64147 , 64149 , 64150 , 64152 , 64153 , 64154 , 64155 , 64156 , 64157 , 64158 , 64164 , 64165 , 64166 , 64167 , 64192.