Races in Kaneohe, Hawaii (HI) Detailed Stats
Data:
Races - White alone (%)
Races - White alone (% change since 2000)
Races - Black alone (%)
Races - Black alone (% change since 2000)
Races - American Indian alone (%)
Races - American Indian alone (% change since 2000)
Races - Asian alone (%)
Races - Asian alone (% change since 2000)
Races - Hispanic (%)
Races - Hispanic (% change since 2000)
Races - Native Hawaiian and Other Pacific Islander alone (%)
Races - Native Hawaiian and Other Pacific Islander alone (% change since 2000)
Races - Two or more races(%)
Races - Two or more races(% change since 2000)
Races - Other race alone (%)
Races - Other race alone (% change since 2000)
Racial diversity
Place of birth - Born in state of residence (%)
Place of birth - Born in state of residence (%) - White
Place of birth - Born in state of residence (%) - Black or African American
Place of birth - Born in state of residence (%) - Asian
Place of birth - Born in state of residence (%) - Hispanic or Latino
Place of birth - Born in state of residence (%) - American Indian and Alaska Native
Place of birth - Born in state of residence (%) - Multirace
Place of birth - Born in state of residence (%) - Other Race
Place of birth - Born in other state (%)
Place of birth - Born in other state (%) - White
Place of birth - Born in other state (%) - Black or African American
Place of birth - Born in other state (%) - Asian
Place of birth - Born in other state (%) - Hispanic or Latino
Place of birth - Born in other state (%) - American Indian and Alaska Native
Place of birth - Born in other state (%) - Multirace
Place of birth - Born in other state (%) - Other Race
Place of birth - Native, outside of US (%)
Place of birth - Native, outside of US (%) - White
Place of birth - Native, outside of US (%) - Black or African American
Place of birth - Native, outside of US (%) - Asian
Place of birth - Native, outside of US (%) - Hispanic or Latino
Place of birth - Native, outside of US (%) - American Indian and Alaska Native
Place of birth - Native, outside of US (%) - Multirace
Place of birth - Native, outside of US (%) - Other Race
Place of birth - Foreign born (%)
Place of birth - Foreign born (%) - White
Place of birth - Foreign born (%) - Black or African American
Place of birth - Foreign born (%) - Asian
Place of birth - Foreign born (%) - Hispanic or Latino
Place of birth - Foreign born (%) - American Indian and Alaska Native
Place of birth - Foreign born (%) - Multirace
Place of birth - Foreign born (%) - Other Race
Residents speaking English at home (%)
Residents speaking English at home - Born in the United States (%)
Residents speaking English at home - Native, born elsewhere (%)
Residents speaking English at home - Foreign born (%)
Residents speaking Spanish at home (%)
Residents speaking Spanish at home - Born in the United States (%)
Residents speaking Spanish at home - Native, born elsewhere (%)
Residents speaking Spanish at home - Foreign born (%)
Residents speaking other language at home (%)
Residents speaking other language at home - Born in the United States (%)
Residents speaking other language at home - Native, born elsewhere (%)
Residents speaking other language at home - Foreign born (%)
Marital status - Never married (%)
Marital status - Now married (%)
Marital status - Separated (%)
Marital status - Widowed (%)
Marital status - Divorced (%)
Ancestries Reported - Arab (%)
Ancestries Reported - Czech (%)
Ancestries Reported - Danish (%)
Ancestries Reported - Dutch (%)
Ancestries Reported - English (%)
Ancestries Reported - French (%)
Ancestries Reported - French Canadian (%)
Ancestries Reported - German (%)
Ancestries Reported - Greek (%)
Ancestries Reported - Hungarian (%)
Ancestries Reported - Irish (%)
Ancestries Reported - Italian (%)
Ancestries Reported - Lithuanian (%)
Ancestries Reported - Norwegian (%)
Ancestries Reported - Polish (%)
Ancestries Reported - Portuguese (%)
Ancestries Reported - Russian (%)
Ancestries Reported - Scotch-Irish (%)
Ancestries Reported - Scottish (%)
Ancestries Reported - Slovak (%)
Ancestries Reported - Subsaharan African (%)
Ancestries Reported - Swedish (%)
Ancestries Reported - Swiss (%)
Ancestries Reported - Ukrainian (%)
Ancestries Reported - United States (%)
Ancestries Reported - Welsh (%)
Ancestries Reported - West Indian (%)
Ancestries Reported - Other (%)
Geographical mobility - Same house 1 year ago (%)
Geographical mobility - Same house 1 year ago (%) - White
Geographical mobility - Same house 1 year ago (%) - Black or African American
Geographical mobility - Same house 1 year ago (%) - Asian
Geographical mobility - Same house 1 year ago (%) - Hispanic or Latino
Geographical mobility - Same house 1 year ago (%) - American Indian and Alaska Native
Geographical mobility - Same house 1 year ago (%) - Multirace
Geographical mobility - Same house 1 year ago (%) - Other Race
Geographical mobility - Moved within same county (%)
Geographical mobility - Moved within same county (%) - White
Geographical mobility - Moved within same county (%) - Black or African American
Geographical mobility - Moved within same county (%) - Asian
Geographical mobility - Moved within same county (%) - Hispanic or Latino
Geographical mobility - Moved within same county (%) - American Indian and Alaska Native
Geographical mobility - Moved within same county (%) - Multirace
Geographical mobility - Moved within same county (%) - Other Race
Geographical mobility - Moved from different county within same state (%)
Geographical mobility - Moved from different county within same state (%) - White
Geographical mobility - Moved from different county within same state (%) - Black or African American
Geographical mobility - Moved from different county within same state (%) - Asian
Geographical mobility - Moved from different county within same state (%) - Hispanic or Latino
Geographical mobility - Moved from different county within same state (%) - American Indian and Alaska Native
Geographical mobility - Moved from different county within same state (%) - Multirace
Geographical mobility - Moved from different county within same state (%) - Other Race
Geographical mobility - Moved from different state (%)
Geographical mobility - Moved from different state (%) - White
Geographical mobility - Moved from different state (%) - Black or African American
Geographical mobility - Moved from different state (%) - Asian
Geographical mobility - Moved from different state (%) - Hispanic or Latino
Geographical mobility - Moved from different state (%) - American Indian and Alaska Native
Geographical mobility - Moved from different state (%) - Multirace
Geographical mobility - Moved from different state (%) - Other Race
Geographical mobility - Moved from abroad (%)
Geographical mobility - Moved from abroad (%) - White
Geographical mobility - Moved from abroad (%) - Black or African American
Geographical mobility - Moved from abroad (%) - Asian
Geographical mobility - Moved from abroad (%) - Hispanic or Latino
Geographical mobility - Moved from abroad (%) - American Indian and Alaska Native
Geographical mobility - Moved from abroad (%) - Multirace
Geographical mobility - Moved from abroad (%) - Other Race
Place of birth for the foreign-born population - Ireland (%)
Place of birth for the foreign-born population - Denmark (%)
Place of birth for the foreign-born population - Norway (%)
Place of birth for the foreign-born population - Sweden (%)
Place of birth for the foreign-born population - United Kingdom (%)
Place of birth for the foreign-born population - England (%)
Place of birth for the foreign-born population - Scotland (%)
Place of birth for the foreign-born population - Other Northern Europe (%)
Place of birth for the foreign-born population - Austria (%)
Place of birth for the foreign-born population - Belgium (%)
Place of birth for the foreign-born population - France (%)
Place of birth for the foreign-born population - Germany (%)
Place of birth for the foreign-born population - Netherlands (%)
Place of birth for the foreign-born population - Switzerland (%)
Place of birth for the foreign-born population - Other Western Europe (%)
Place of birth for the foreign-born population - Greece (%)
Place of birth for the foreign-born population - Italy (%)
Place of birth for the foreign-born population - Portugal (%)
Place of birth for the foreign-born population - Spain (%)
Place of birth for the foreign-born population - Other Southern Europe (%)
Place of birth for the foreign-born population - Albania (%)
Place of birth for the foreign-born population - Belarus (%)
Place of birth for the foreign-born population - Bosnia and Herzegovina (%)
Place of birth for the foreign-born population - Bulgaria (%)
Place of birth for the foreign-born population - Croatia (%)
Place of birth for the foreign-born population - Czechoslovakia (%)
Place of birth for the foreign-born population - Hungary (%)
Place of birth for the foreign-born population - Latvia (%)
Place of birth for the foreign-born population - Lithuania (%)
Place of birth for the foreign-born population - North Macedonia (Macedonia) (%)
Place of birth for the foreign-born population - Moldova (%)
Place of birth for the foreign-born population - Poland (%)
Place of birth for the foreign-born population - Romania (%)
Place of birth for the foreign-born population - Russia (%)
Place of birth for the foreign-born population - Serbia (%)
Place of birth for the foreign-born population - Ukraine (%)
Place of birth for the foreign-born population - Other Eastern Europe (%)
Place of birth for the foreign-born population - China (%)
Place of birth for the foreign-born population - Hong Kong (%)
Place of birth for the foreign-born population - Taiwan (%)
Place of birth for the foreign-born population - Japan (%)
Place of birth for the foreign-born population - Korea (%)
Place of birth for the foreign-born population - Other Eastern Asia (%)
Place of birth for the foreign-born population - Afghanistan (%)
Place of birth for the foreign-born population - Bangladesh (%)
Place of birth for the foreign-born population - India (%)
Place of birth for the foreign-born population - Iran (%)
Place of birth for the foreign-born population - Kazakhstan (%)
Place of birth for the foreign-born population - Nepal (%)
Place of birth for the foreign-born population - Pakistan (%)
Place of birth for the foreign-born population - Sri Lanka (%)
Place of birth for the foreign-born population - Uzbekistan (%)
Place of birth for the foreign-born population - Other South Central Asia (%)
Place of birth for the foreign-born population - Burma (%)
Place of birth for the foreign-born population - Cambodia (%)
Place of birth for the foreign-born population - Indonesia (%)
Place of birth for the foreign-born population - Laos (%)
Place of birth for the foreign-born population - Malaysia (%)
Place of birth for the foreign-born population - Philippines (%)
Place of birth for the foreign-born population - Singapore (%)
Place of birth for the foreign-born population - Thailand (%)
Place of birth for the foreign-born population - Vietnam (%)
Place of birth for the foreign-born population - Other South Eastern Asia (%)
Place of birth for the foreign-born population - Armenia (%)
Place of birth for the foreign-born population - Iraq (%)
Place of birth for the foreign-born population - Israel (%)
Place of birth for the foreign-born population - Jordan (%)
Place of birth for the foreign-born population - Kuwait (%)
Place of birth for the foreign-born population - Lebanon (%)
Place of birth for the foreign-born population - Saudi Arabia (%)
Place of birth for the foreign-born population - Syria (%)
Place of birth for the foreign-born population - Turkey (%)
Place of birth for the foreign-born population - Yemen (%)
Place of birth for the foreign-born population - Other Western Asia (%)
Place of birth for the foreign-born population - Eritrea (%)
Place of birth for the foreign-born population - Ethiopia (%)
Place of birth for the foreign-born population - Kenya (%)
Place of birth for the foreign-born population - Somalia (%)
Place of birth for the foreign-born population - Uganda (%)
Place of birth for the foreign-born population - Zimbabwe (%)
Place of birth for the foreign-born population - Other Eastern Africa (%)
Place of birth for the foreign-born population - Cameroon (%)
Place of birth for the foreign-born population - Congo (%)
Place of birth for the foreign-born population - Democratic Republic of Congo (Zaire) (%)
Place of birth for the foreign-born population - Other Middle Africa (%)
Place of birth for the foreign-born population - Egypt (%)
Place of birth for the foreign-born population - Morocco (%)
Place of birth for the foreign-born population - Sudan (%)
Place of birth for the foreign-born population - Other Northern Africa (%)
Place of birth for the foreign-born population - South Africa (%)
Place of birth for the foreign-born population - Other Southern Africa (%)
Place of birth for the foreign-born population - Cabo Verde (%)
Place of birth for the foreign-born population - Ghana (%)
Place of birth for the foreign-born population - Liberia (%)
Place of birth for the foreign-born population - Nigeria (%)
Place of birth for the foreign-born population - Senegal (%)
Place of birth for the foreign-born population - Sierra Leone (%)
Place of birth for the foreign-born population - Other Western Africa (%)
Place of birth for the foreign-born population - Australia (%)
Place of birth for the foreign-born population - New Zealand (%)
Place of birth for the foreign-born population - Fiji (%)
Place of birth for the foreign-born population - Micronesia (%)
Place of birth for the foreign-born population - Bahamas (%)
Place of birth for the foreign-born population - Barbados (%)
Place of birth for the foreign-born population - Cuba (%)
Place of birth for the foreign-born population - Dominica (%)
Place of birth for the foreign-born population - Dominican Republic (%)
Place of birth for the foreign-born population - Grenada (%)
Place of birth for the foreign-born population - Haiti (%)
Place of birth for the foreign-born population - Jamaica (%)
Place of birth for the foreign-born population - St. Vincent and the Grenadines (%)
Place of birth for the foreign-born population - Trinidad and Tobago (%)
Place of birth for the foreign-born population - West Indies (%)
Place of birth for the foreign-born population - Other Caribbean (%)
Place of birth for the foreign-born population - Belize (%)
Place of birth for the foreign-born population - Costa Rica (%)
Place of birth for the foreign-born population - El Salvador (%)
Place of birth for the foreign-born population - Guatemala (%)
Place of birth for the foreign-born population - Honduras (%)
Place of birth for the foreign-born population - Mexico (%)
Place of birth for the foreign-born population - Nicaragua (%)
Place of birth for the foreign-born population - Panama (%)
Place of birth for the foreign-born population - Other Central America (%)
Place of birth for the foreign-born population - Argentina (%)
Place of birth for the foreign-born population - Bolivia (%)
Place of birth for the foreign-born population - Brazil (%)
Place of birth for the foreign-born population - Chile (%)
Place of birth for the foreign-born population - Colombia (%)
Place of birth for the foreign-born population - Ecuador (%)
Place of birth for the foreign-born population - Guyana (%)
Place of birth for the foreign-born population - Peru (%)
Place of birth for the foreign-born population - Uruguay (%)
Place of birth for the foreign-born population - Venezuela (%)
Place of birth for the foreign-born population - Other South America (%)
Place of birth for the foreign-born population - Canada (%)
Place of birth for the foreign-born population - Other Northern America (%)
Place of birth for the foreign-born population - Other (%)
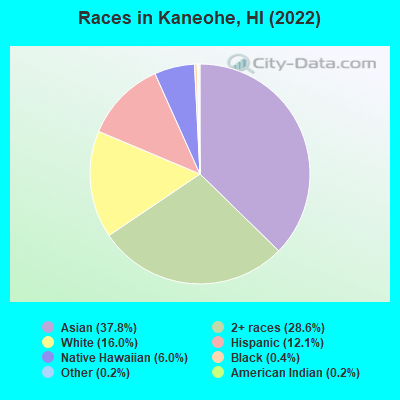
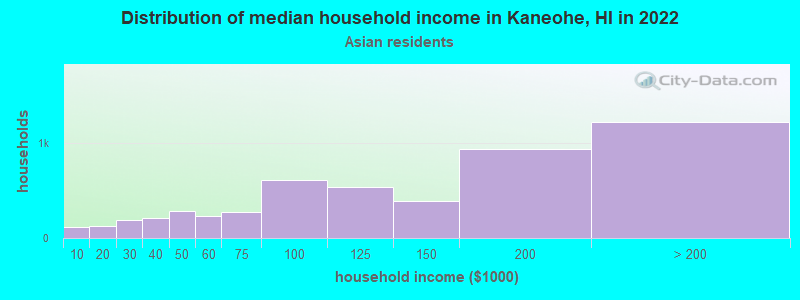
According to 2022 data, the most numerous races in Kaneohe, HI are Asian alone (13,215 residents), Two or more races (10,020 residents), and White alone (5,586 residents). 88.5% of Kaneohe residents speak English at home. 7.8% of Kaneohe, HI residents are foreign-born (5.4% born in Asia, 1.0% born in Europe), which is 129.8% less than the foreign-born rate of 18.0% across the entire state of Hawaii.
Race distribution in Kaneohe
2000 2022
13,243 37.9% Asian alone 8,312 23.8% Two or more races 6,756 19.3% White alone 3,802 10.9% Native Hawaiian and Other 2,523 7.2% Hispanic 263 0.8% Black alone 41 0.1% American Indian alone 30 0.09% Other race alone
13,215 37.8% Asian alone 10,020 28.6% Two or more races 5,586 16.0% White alone 4,220 12.1% Hispanic 2,107 6.0% Native Hawaiian and Other 156 0.4% Black alone 83 0.2% Other race alone 53 0.2% American Indian alone
2000 2022
494,149 40.8% Asian alone 277,091 22.9% White alone 218,700 18.1% Two or more races 108,441 9.0% Native Hawaiian and Other 87,699 7.2% Hispanic 20,829 1.7% Black alone 2,089 0.2% Other race alone 2,539 0.2% American Indian alone
498,125 34.6% Asian alone 318,574 22.1% Two or more races 297,937 20.7% White alone 160,103 11.1% Hispanic 134,567 9.3% Native Hawaiian and Other 23,682 1.6% Black alone 5,378 0.4% Other race alone 1,830 0.1% American Indian alone
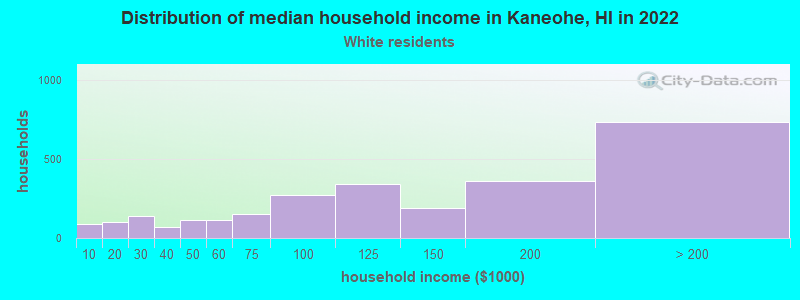
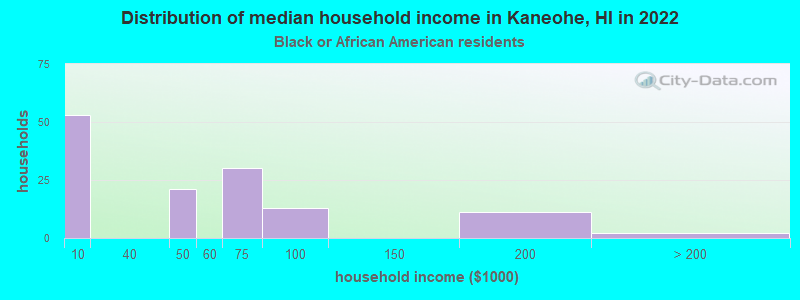
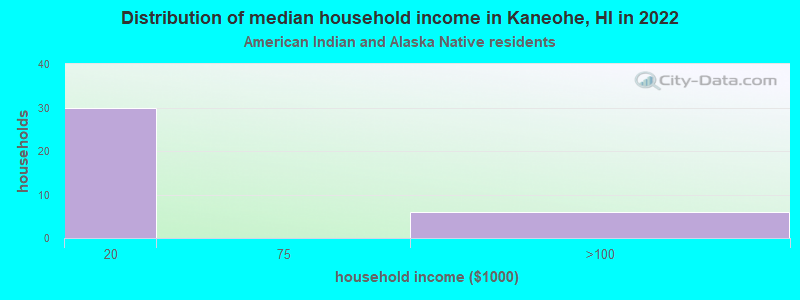
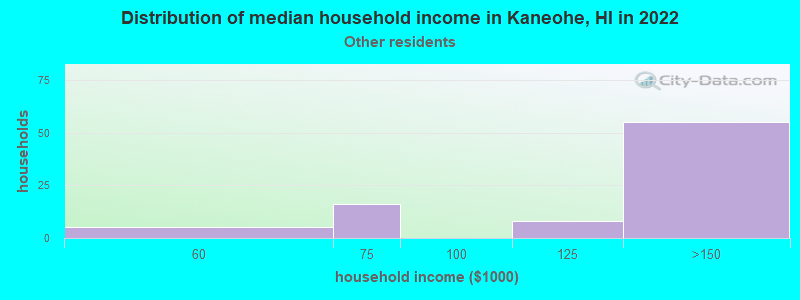
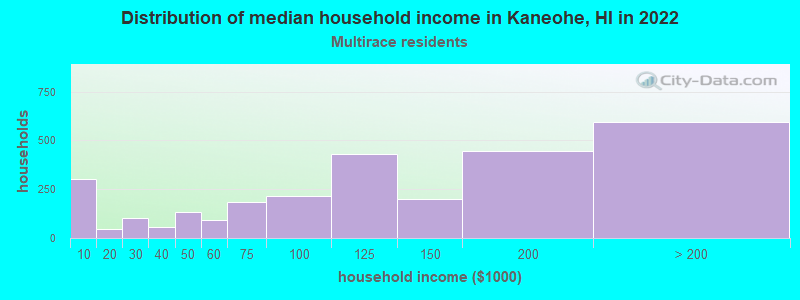
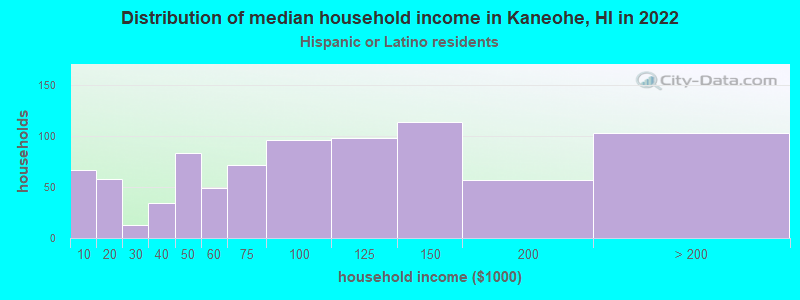
Income and house value in Kaneohe Median household income in 2022 $132,993 White non-Hispanic householders$46,113 Black householders$128,060 Asian householders$60,247 Native Hawaiian and other Pacific Islander householders$139,295 Some other race householders$109,912 Two or more races householders$81,118 Hispanic or Latino race householdersMedian 2022 house value over $1,000,000 White Non-Hispanic householders$993,155 Black or African American householders over $1,000,000 Asian householders$961,719 Native Hawaiian and other Pacific Islander householdersover $1,000,000 Some other race householdersover $1,000,000 Two or more races householders$995,919 Hispanic or Latino householders
Median age by race in Kaneohe
50.9 Median age for White residents50.0 52.5 46.6 Median age for Black or African American residents44.6 47.4 39.6 Median age for American Indian / Alaska Native residents41.5 21.4 60.0 Median age for Asian residents58.0 61.5 49.4 Median age for Native Hawaiian / Pacific Islander residents49.8 49.6 28.4 Median age for Other race residents25.3 29.4 31.8 Median age for Two or more races residents30.1 33.5 52.2 Median age for White alone residents51.2 55.1 25.3 Median age for Hispanic or Latino residents24.5 26.1
Owner/renter occupied households by race in Kaneohe
House owners and renters - White residents 1,737 64.3% Owner occupied963 35.7% Renter occupiedHouse owners and renters - Black or African American residents 51 53.9% Owner occupied43 46.1% Renter occupiedHouse owners and renters - American Indian / Alaska Native residents 5 17.6% Owner occupied23 82.4% Renter occupiedHouse owners and renters - Asian residents 4,626 88.5% Owner occupied600 11.5% Renter occupiedHouse owners and renters - Native Hawaiian / Pacific Islander residents 313 50.7% Owner occupied304 49.3% Renter occupiedHouse owners and renters - Other race residents 11 18.6% Owner occupied47 81.4% Renter occupiedHouse owners and renters - Two or more races residents 1,983 70.2% Owner occupied842 29.8% Renter occupiedHouse owners and renters - White alone residents 1,587 64.3% Owner occupied880 35.7% Renter occupiedHouse owners and renters - Hispanic or Latino residents 360 41.7% Owner occupied505 58.3% Renter occupied
Language usage in Kaneohe
English speakers - Total 88.5% of residents of Kaneohe speak English at home.
1.5% of residents speak Spanish at home 369 75.3% Speak English very well121 24.7% Speak English less than very well10.9% of residents speak other language at home 2,291 63.3% Speak English very well1,326 36.7% Speak English less than very well
English speakers - Born in the United States 89.8% of residents of Kaneohe speak English at home.
5.3% of residents speak Spanish at home 262 76.8% Speak English very well79 23.2% Speak English less than very well4.9% of residents speak other language at home 293 91.3% Speak English very well28 8.7% Speak English less than very well
English speakers - Native, born elsewhere 66.4% of residents of Kaneohe speak English at home.
4.3% of residents speak Spanish at home 24 64.9% Speak English very well13 35.1% Speak English less than very well29.3% of residents speak other language at home 134 53.6% Speak English very well116 46.4% Speak English less than very well
English speakers - Foreign-born 27.0% of residents of Kaneohe speak English at home.
2.7% of residents speak Spanish at home 41 58.6% Speak English very well29 41.4% Speak English less than very well70.4% of residents speak other language at home 869 47.9% Speak English very well944 52.1% Speak English less than very well
White (Caucasian) - Speak only English Native:
94.3% (5,095)Foreign-born:
50.9% (278)
White (Caucasian) - Speak another language Native:
5.6% (302)Foreign-born:
48.6% (266)
Black or African American - Speak only English Native:
100.0% (195)Foreign-born:
100.0% (5)
American Indian / Alaska Native - Speak only English Native:
32.5% (70)Foreign-born:
81.2% (9)
Asian - Speak only English Native:
93.4% (10,714)Foreign-born:
18.6% (319)
Asian - Speak another language Native:
7.1% (813)Foreign-born:
81.3% (1,391)
Native Hawaiian / Pacific Islander - Speak only English Native:
94.1% (2,143)Foreign-born:
33.0% (35)
Native Hawaiian / Pacific Islander - Speak another language Native:
7.4% (169)Foreign-born:
65.8% (71)
Other race - Speak another language Native:
6.5% (26)Foreign-born:
98.0% (22)
Two or more races - Speak only English Native:
92.8% (10,355)Foreign-born:
33.6% (71)
Two or more races - Speak another language Native:
7.1% (790)Foreign-born:
66.4% (141)
White alone - Speak only English Native:
96.1% (4,779)Foreign-born:
47.0% (225)
White alone - Speak another language Native:
3.9% (196)Foreign-born:
52.9% (253)
Hispanic or Latino - Speak only English Native:
90.6% (3,361)Foreign-born:
57.3% (67)
Hispanic or Latino - Speak another language Native:
9.8% (362)Foreign-born:
50.5% (59)
Foreign-born residents in Kaneohe 2,740 residents are foreign born (5.4% Asia , 1.0% Europe ).
This city:
7.8%Hawaii:
18.0%
Marital status for residents in Kaneohe Marital status - White (Caucasian) population 15 years and over
Males 31.1% Never married54.6% Now married2.0% Separated4.4% Widowed7.9% DivorcedFemales 22.8% Never married49.3% Now married2.3% Separated11.8% Widowed13.7% DivorcedWomen who gave birth in the past 12 months Now married:
100.0% (35)Unmarried:
0.0% (0)
Women who did not give birth in the past 12 months Now married:
49.6% (580)Unmarried:
50.4% (589)
Marital status - Black or African American population 15 years and over
Males 62.2% Never married37.8% Now married0.0% Separated0.0% Widowed0.0% DivorcedFemales 42.6% Never married22.1% Now married0.0% Separated27.9% Widowed7.4% DivorcedWomen who did not give birth in the past 12 months Now married:
27.5% (11)Unmarried:
72.5% (28)
Marital status - American Indian / Alaska Native population 15 years and over
Males 0.0% Never married87.0% Now married0.0% Separated0.0% Widowed13.0% DivorcedFemales 56.8% Never married33.1% Now married0.0% Separated0.0% Widowed10.1% DivorcedWomen who did not give birth in the past 12 months Now married:
26.3% (35)Unmarried:
73.7% (99)
Marital status - Asian population 15 years and over
Males 31.7% Never married53.9% Now married1.0% Separated6.2% Widowed7.2% DivorcedFemales 20.4% Never married52.2% Now married0.3% Separated19.0% Widowed8.1% DivorcedWomen who gave birth in the past 12 months Now married:
70.8% (87)Unmarried:
29.2% (36)
Women who did not give birth in the past 12 months Now married:
44.9% (899)Unmarried:
55.1% (1,104)
Marital status - Native Hawaiian / Pacific Islander population 15 years and over
Males 36.1% Never married54.4% Now married0.0% Separated1.9% Widowed7.5% DivorcedFemales 34.2% Never married43.9% Now married0.0% Separated14.4% Widowed7.5% DivorcedWomen who gave birth in the past 12 months Now married:
100.0% (32)Unmarried:
0.0% (0)
Women who did not give birth in the past 12 months Now married:
30.5% (121)Unmarried:
69.5% (275)
Marital status - Other race population 15 years and over
Males 51.1% Never married48.9% Now married0.0% Separated0.0% Widowed0.0% DivorcedFemales 13.9% Never married64.3% Now married0.0% Separated7.8% Widowed13.9% DivorcedWomen who did not give birth in the past 12 months Now married:
64.8% (74)Unmarried:
35.2% (40)
Marital status - Two or more races population 15 years and over
Males 52.8% Never married38.0% Now married0.6% Separated1.0% Widowed7.6% DivorcedFemales 42.5% Never married39.2% Now married0.7% Separated3.2% Widowed14.4% DivorcedWomen who gave birth in the past 12 months Now married:
44.9% (51)Unmarried:
55.1% (63)
Women who did not give birth in the past 12 months Now married:
30.1% (843)Unmarried:
69.9% (1,962)
Marital status - White alone, not Hispanic / Latino population 15 years and over
Males 31.8% Never married52.9% Now married2.3% Separated4.9% Widowed8.1% DivorcedFemales 21.3% Never married49.9% Now married2.6% Separated12.3% Widowed13.9% DivorcedWomen who gave birth in the past 12 months Now married:
100.0% (23)Unmarried:
0.0% (0)
Women who did not give birth in the past 12 months Now married:
50.3% (535)Unmarried:
49.7% (528)
Marital status - Hispanic or Latino population 15 years and over
Males 59.9% Never married37.8% Now married0.0% Separated0.0% Widowed2.2% DivorcedFemales 46.1% Never married38.7% Now married0.4% Separated1.9% Widowed12.9% DivorcedWomen who gave birth in the past 12 months Now married:
86.0% (49)Unmarried:
14.0% (8)
Women who did not give birth in the past 12 months Now married:
31.5% (334)Unmarried:
68.5% (726)
Ancestries in Kaneohe
312 1.9% English241 1.4% Portuguese235 1.4% German201 1.2% American194 1.2% Irish186 1.1% Italian137 0.8% Polish119 0.7% European70 0.4% Scottish48 0.3% Northern European47 0.3% Russian35 0.2% Norwegian28 0.2% Brazilian24 0.1% Yugoslavian23 0.1% Swedish21 0.1% Czech18 0.1% Scotch-Irish14 0.08% Canadian11 0.07% British11 0.07% Pennsylvania German8 0.05% Hungarian8 0.05% Haitian7 0.04% Eastern European6 0.04% Lithuanian6 0.04% New Zealander5 0.03% Dutch4 0.02% Danish
Geographical mobility in Kaneohe Same house 1 year ago 4,948 81.7% White (Caucasian)156 79.4% Black or African American83 44.5% American Indian / Alaska Native12,756 95.5% Asian2,296 92.7% Native Hawaiian / Pacific Islander449 98.0% Other race11,562 92.7% Two or more races4,524 81.4% White alone, not Hispanic / Latino3,631 88.8% Hispanic or LatinoMoved within same county 543 9.0% White / Caucasian5 2.7% American Indian / Alaska Native448 3.4% Asian139 5.6% Native Hawaiian / Pacific Islander7 1.6% Other race694 5.6% Two or more races512 9.2% White alone, not Hispanic / Latino239 5.8% Hispanic or LatinoMoved within same state 141 2.3% White / Caucasian37 0.3% Asian23 0.9% Native Hawaiian / Pacific Islander36 0.3% Two or more races140 2.5% White alone, not Hispanic / LatinoMoved from different state 439 7.2% White / Caucasian35 17.8% Black or African American82 0.6% Asian12 0.5% Native Hawaiian / Pacific Islander25 5.4% Other race94 0.8% Two or more races386 6.9% White alone, not Hispanic / Latino130 3.2% Hispanic or LatinoMoved from abroad 24 0.4% White118 63.5% American Indian / Alaska Native22 0.2% Asian83 0.7% Two or more races25 0.5% White alone, not Hispanic / Latino151 3.7% Hispanic or Latino
Children Nativity (place of birth) in Kaneohe
Children under 6 years - Living with two parents Both parents native 846 100.0% NativeBoth parents foreign-born 35 100.0% NativeOne native, one foreign-born parent 175 100.0% NativeChildren under 6 years - Living with one parent Native parent 932 100.0% NativeForeign-born parent 52 100.0% NativeChildren 6 to 17 years - Living with two parents Both parents native 1,861 99.3% Native13 0.7% Foreign-bornBoth parents foreign-born 220 100.0% NativeOne native, one foreign-born parent 192 84.1% Native36 15.9% Foreign-bornChildren 6 to 17 years - Living with one parent Native parent 1,106 100.0% NativeForeign-born parent 127 63.6% Native73 36.4% Foreign-born
Grandparents responsible for own grandchildren in Kaneohe
Grandparents (30 to 59 years) White / Caucasian 8 22.5% Responsible for grandchildren28 77.5% Not responsible for grandchildrenAsian 13 24.0% Responsible for grandchildren43 76.0% Not responsible for grandchildrenNative Hawaiian / Pacific Islander 17 19.0% Responsible for grandchildren73 81.0% Not responsible for grandchildrenTwo or more races 11 21.4% Responsible for grandchildren42 78.6% Not responsible for grandchildrenWhite alone, not Hispanic / Latino 31 100.0% Not responsible for grandchildrenHispanic or Latino 16 29.1% Responsible for grandchildren38 70.9% Not responsible for grandchildrenGrandparents (60 years and over) White / Caucasian 16 12.7% Responsible for grandchildren108 87.3% Not responsible for grandchildrenAsian 67 9.8% Responsible for grandchildren619 90.2% Not responsible for grandchildrenNative Hawaiian / Pacific Islander 33 44.5% Responsible for grandchildren41 55.5% Not responsible for grandchildrenTwo or more races 100 37.1% Responsible for grandchildren169 62.9% Not responsible for grandchildrenWhite alone, not Hispanic / Latino 8 7.8% Responsible for grandchildren90 92.2% Not responsible for grandchildrenHispanic or Latino 27 15.9% Responsible for grandchildren140 84.1% Not responsible for grandchildren