Races in Kahului, Hawaii (HI) Detailed Stats
Data:
Races - White alone (%)
Races - White alone (% change since 2000)
Races - Black alone (%)
Races - Black alone (% change since 2000)
Races - American Indian alone (%)
Races - American Indian alone (% change since 2000)
Races - Asian alone (%)
Races - Asian alone (% change since 2000)
Races - Hispanic (%)
Races - Hispanic (% change since 2000)
Races - Native Hawaiian and Other Pacific Islander alone (%)
Races - Native Hawaiian and Other Pacific Islander alone (% change since 2000)
Races - Two or more races(%)
Races - Two or more races(% change since 2000)
Races - Other race alone (%)
Races - Other race alone (% change since 2000)
Racial diversity
Place of birth - Born in state of residence (%)
Place of birth - Born in state of residence (%) - White
Place of birth - Born in state of residence (%) - Black or African American
Place of birth - Born in state of residence (%) - Asian
Place of birth - Born in state of residence (%) - Hispanic or Latino
Place of birth - Born in state of residence (%) - American Indian and Alaska Native
Place of birth - Born in state of residence (%) - Multirace
Place of birth - Born in state of residence (%) - Other Race
Place of birth - Born in other state (%)
Place of birth - Born in other state (%) - White
Place of birth - Born in other state (%) - Black or African American
Place of birth - Born in other state (%) - Asian
Place of birth - Born in other state (%) - Hispanic or Latino
Place of birth - Born in other state (%) - American Indian and Alaska Native
Place of birth - Born in other state (%) - Multirace
Place of birth - Born in other state (%) - Other Race
Place of birth - Native, outside of US (%)
Place of birth - Native, outside of US (%) - White
Place of birth - Native, outside of US (%) - Black or African American
Place of birth - Native, outside of US (%) - Asian
Place of birth - Native, outside of US (%) - Hispanic or Latino
Place of birth - Native, outside of US (%) - American Indian and Alaska Native
Place of birth - Native, outside of US (%) - Multirace
Place of birth - Native, outside of US (%) - Other Race
Place of birth - Foreign born (%)
Place of birth - Foreign born (%) - White
Place of birth - Foreign born (%) - Black or African American
Place of birth - Foreign born (%) - Asian
Place of birth - Foreign born (%) - Hispanic or Latino
Place of birth - Foreign born (%) - American Indian and Alaska Native
Place of birth - Foreign born (%) - Multirace
Place of birth - Foreign born (%) - Other Race
Residents speaking English at home (%)
Residents speaking English at home - Born in the United States (%)
Residents speaking English at home - Native, born elsewhere (%)
Residents speaking English at home - Foreign born (%)
Residents speaking Spanish at home (%)
Residents speaking Spanish at home - Born in the United States (%)
Residents speaking Spanish at home - Native, born elsewhere (%)
Residents speaking Spanish at home - Foreign born (%)
Residents speaking other language at home (%)
Residents speaking other language at home - Born in the United States (%)
Residents speaking other language at home - Native, born elsewhere (%)
Residents speaking other language at home - Foreign born (%)
Marital status - Never married (%)
Marital status - Now married (%)
Marital status - Separated (%)
Marital status - Widowed (%)
Marital status - Divorced (%)
Ancestries Reported - Arab (%)
Ancestries Reported - Czech (%)
Ancestries Reported - Danish (%)
Ancestries Reported - Dutch (%)
Ancestries Reported - English (%)
Ancestries Reported - French (%)
Ancestries Reported - French Canadian (%)
Ancestries Reported - German (%)
Ancestries Reported - Greek (%)
Ancestries Reported - Hungarian (%)
Ancestries Reported - Irish (%)
Ancestries Reported - Italian (%)
Ancestries Reported - Lithuanian (%)
Ancestries Reported - Norwegian (%)
Ancestries Reported - Polish (%)
Ancestries Reported - Portuguese (%)
Ancestries Reported - Russian (%)
Ancestries Reported - Scotch-Irish (%)
Ancestries Reported - Scottish (%)
Ancestries Reported - Slovak (%)
Ancestries Reported - Subsaharan African (%)
Ancestries Reported - Swedish (%)
Ancestries Reported - Swiss (%)
Ancestries Reported - Ukrainian (%)
Ancestries Reported - United States (%)
Ancestries Reported - Welsh (%)
Ancestries Reported - West Indian (%)
Ancestries Reported - Other (%)
Geographical mobility - Same house 1 year ago (%)
Geographical mobility - Same house 1 year ago (%) - White
Geographical mobility - Same house 1 year ago (%) - Black or African American
Geographical mobility - Same house 1 year ago (%) - Asian
Geographical mobility - Same house 1 year ago (%) - Hispanic or Latino
Geographical mobility - Same house 1 year ago (%) - American Indian and Alaska Native
Geographical mobility - Same house 1 year ago (%) - Multirace
Geographical mobility - Same house 1 year ago (%) - Other Race
Geographical mobility - Moved within same county (%)
Geographical mobility - Moved within same county (%) - White
Geographical mobility - Moved within same county (%) - Black or African American
Geographical mobility - Moved within same county (%) - Asian
Geographical mobility - Moved within same county (%) - Hispanic or Latino
Geographical mobility - Moved within same county (%) - American Indian and Alaska Native
Geographical mobility - Moved within same county (%) - Multirace
Geographical mobility - Moved within same county (%) - Other Race
Geographical mobility - Moved from different county within same state (%)
Geographical mobility - Moved from different county within same state (%) - White
Geographical mobility - Moved from different county within same state (%) - Black or African American
Geographical mobility - Moved from different county within same state (%) - Asian
Geographical mobility - Moved from different county within same state (%) - Hispanic or Latino
Geographical mobility - Moved from different county within same state (%) - American Indian and Alaska Native
Geographical mobility - Moved from different county within same state (%) - Multirace
Geographical mobility - Moved from different county within same state (%) - Other Race
Geographical mobility - Moved from different state (%)
Geographical mobility - Moved from different state (%) - White
Geographical mobility - Moved from different state (%) - Black or African American
Geographical mobility - Moved from different state (%) - Asian
Geographical mobility - Moved from different state (%) - Hispanic or Latino
Geographical mobility - Moved from different state (%) - American Indian and Alaska Native
Geographical mobility - Moved from different state (%) - Multirace
Geographical mobility - Moved from different state (%) - Other Race
Geographical mobility - Moved from abroad (%)
Geographical mobility - Moved from abroad (%) - White
Geographical mobility - Moved from abroad (%) - Black or African American
Geographical mobility - Moved from abroad (%) - Asian
Geographical mobility - Moved from abroad (%) - Hispanic or Latino
Geographical mobility - Moved from abroad (%) - American Indian and Alaska Native
Geographical mobility - Moved from abroad (%) - Multirace
Geographical mobility - Moved from abroad (%) - Other Race
Place of birth for the foreign-born population - Ireland (%)
Place of birth for the foreign-born population - Denmark (%)
Place of birth for the foreign-born population - Norway (%)
Place of birth for the foreign-born population - Sweden (%)
Place of birth for the foreign-born population - United Kingdom (%)
Place of birth for the foreign-born population - England (%)
Place of birth for the foreign-born population - Scotland (%)
Place of birth for the foreign-born population - Other Northern Europe (%)
Place of birth for the foreign-born population - Austria (%)
Place of birth for the foreign-born population - Belgium (%)
Place of birth for the foreign-born population - France (%)
Place of birth for the foreign-born population - Germany (%)
Place of birth for the foreign-born population - Netherlands (%)
Place of birth for the foreign-born population - Switzerland (%)
Place of birth for the foreign-born population - Other Western Europe (%)
Place of birth for the foreign-born population - Greece (%)
Place of birth for the foreign-born population - Italy (%)
Place of birth for the foreign-born population - Portugal (%)
Place of birth for the foreign-born population - Spain (%)
Place of birth for the foreign-born population - Other Southern Europe (%)
Place of birth for the foreign-born population - Albania (%)
Place of birth for the foreign-born population - Belarus (%)
Place of birth for the foreign-born population - Bosnia and Herzegovina (%)
Place of birth for the foreign-born population - Bulgaria (%)
Place of birth for the foreign-born population - Croatia (%)
Place of birth for the foreign-born population - Czechoslovakia (%)
Place of birth for the foreign-born population - Hungary (%)
Place of birth for the foreign-born population - Latvia (%)
Place of birth for the foreign-born population - Lithuania (%)
Place of birth for the foreign-born population - North Macedonia (Macedonia) (%)
Place of birth for the foreign-born population - Moldova (%)
Place of birth for the foreign-born population - Poland (%)
Place of birth for the foreign-born population - Romania (%)
Place of birth for the foreign-born population - Russia (%)
Place of birth for the foreign-born population - Serbia (%)
Place of birth for the foreign-born population - Ukraine (%)
Place of birth for the foreign-born population - Other Eastern Europe (%)
Place of birth for the foreign-born population - China (%)
Place of birth for the foreign-born population - Hong Kong (%)
Place of birth for the foreign-born population - Taiwan (%)
Place of birth for the foreign-born population - Japan (%)
Place of birth for the foreign-born population - Korea (%)
Place of birth for the foreign-born population - Other Eastern Asia (%)
Place of birth for the foreign-born population - Afghanistan (%)
Place of birth for the foreign-born population - Bangladesh (%)
Place of birth for the foreign-born population - India (%)
Place of birth for the foreign-born population - Iran (%)
Place of birth for the foreign-born population - Kazakhstan (%)
Place of birth for the foreign-born population - Nepal (%)
Place of birth for the foreign-born population - Pakistan (%)
Place of birth for the foreign-born population - Sri Lanka (%)
Place of birth for the foreign-born population - Uzbekistan (%)
Place of birth for the foreign-born population - Other South Central Asia (%)
Place of birth for the foreign-born population - Burma (%)
Place of birth for the foreign-born population - Cambodia (%)
Place of birth for the foreign-born population - Indonesia (%)
Place of birth for the foreign-born population - Laos (%)
Place of birth for the foreign-born population - Malaysia (%)
Place of birth for the foreign-born population - Philippines (%)
Place of birth for the foreign-born population - Singapore (%)
Place of birth for the foreign-born population - Thailand (%)
Place of birth for the foreign-born population - Vietnam (%)
Place of birth for the foreign-born population - Other South Eastern Asia (%)
Place of birth for the foreign-born population - Armenia (%)
Place of birth for the foreign-born population - Iraq (%)
Place of birth for the foreign-born population - Israel (%)
Place of birth for the foreign-born population - Jordan (%)
Place of birth for the foreign-born population - Kuwait (%)
Place of birth for the foreign-born population - Lebanon (%)
Place of birth for the foreign-born population - Saudi Arabia (%)
Place of birth for the foreign-born population - Syria (%)
Place of birth for the foreign-born population - Turkey (%)
Place of birth for the foreign-born population - Yemen (%)
Place of birth for the foreign-born population - Other Western Asia (%)
Place of birth for the foreign-born population - Eritrea (%)
Place of birth for the foreign-born population - Ethiopia (%)
Place of birth for the foreign-born population - Kenya (%)
Place of birth for the foreign-born population - Somalia (%)
Place of birth for the foreign-born population - Uganda (%)
Place of birth for the foreign-born population - Zimbabwe (%)
Place of birth for the foreign-born population - Other Eastern Africa (%)
Place of birth for the foreign-born population - Cameroon (%)
Place of birth for the foreign-born population - Congo (%)
Place of birth for the foreign-born population - Democratic Republic of Congo (Zaire) (%)
Place of birth for the foreign-born population - Other Middle Africa (%)
Place of birth for the foreign-born population - Egypt (%)
Place of birth for the foreign-born population - Morocco (%)
Place of birth for the foreign-born population - Sudan (%)
Place of birth for the foreign-born population - Other Northern Africa (%)
Place of birth for the foreign-born population - South Africa (%)
Place of birth for the foreign-born population - Other Southern Africa (%)
Place of birth for the foreign-born population - Cabo Verde (%)
Place of birth for the foreign-born population - Ghana (%)
Place of birth for the foreign-born population - Liberia (%)
Place of birth for the foreign-born population - Nigeria (%)
Place of birth for the foreign-born population - Senegal (%)
Place of birth for the foreign-born population - Sierra Leone (%)
Place of birth for the foreign-born population - Other Western Africa (%)
Place of birth for the foreign-born population - Australia (%)
Place of birth for the foreign-born population - New Zealand (%)
Place of birth for the foreign-born population - Fiji (%)
Place of birth for the foreign-born population - Micronesia (%)
Place of birth for the foreign-born population - Bahamas (%)
Place of birth for the foreign-born population - Barbados (%)
Place of birth for the foreign-born population - Cuba (%)
Place of birth for the foreign-born population - Dominica (%)
Place of birth for the foreign-born population - Dominican Republic (%)
Place of birth for the foreign-born population - Grenada (%)
Place of birth for the foreign-born population - Haiti (%)
Place of birth for the foreign-born population - Jamaica (%)
Place of birth for the foreign-born population - St. Vincent and the Grenadines (%)
Place of birth for the foreign-born population - Trinidad and Tobago (%)
Place of birth for the foreign-born population - West Indies (%)
Place of birth for the foreign-born population - Other Caribbean (%)
Place of birth for the foreign-born population - Belize (%)
Place of birth for the foreign-born population - Costa Rica (%)
Place of birth for the foreign-born population - El Salvador (%)
Place of birth for the foreign-born population - Guatemala (%)
Place of birth for the foreign-born population - Honduras (%)
Place of birth for the foreign-born population - Mexico (%)
Place of birth for the foreign-born population - Nicaragua (%)
Place of birth for the foreign-born population - Panama (%)
Place of birth for the foreign-born population - Other Central America (%)
Place of birth for the foreign-born population - Argentina (%)
Place of birth for the foreign-born population - Bolivia (%)
Place of birth for the foreign-born population - Brazil (%)
Place of birth for the foreign-born population - Chile (%)
Place of birth for the foreign-born population - Colombia (%)
Place of birth for the foreign-born population - Ecuador (%)
Place of birth for the foreign-born population - Guyana (%)
Place of birth for the foreign-born population - Peru (%)
Place of birth for the foreign-born population - Uruguay (%)
Place of birth for the foreign-born population - Venezuela (%)
Place of birth for the foreign-born population - Other South America (%)
Place of birth for the foreign-born population - Canada (%)
Place of birth for the foreign-born population - Other Northern America (%)
Place of birth for the foreign-born population - Other (%)
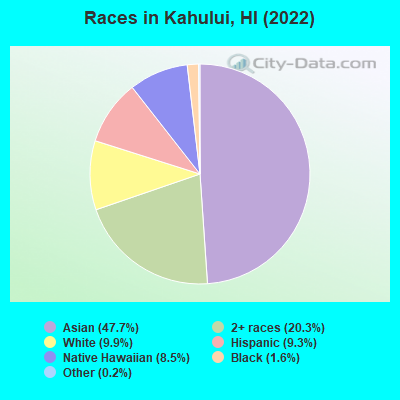
According to 2022 data, the most numerous races in Kahului, HI are Asian alone (12,946 residents), Two or more races (5,518 residents), and White alone (2,698 residents). 67.1% of Kahului residents speak English at home. 32.8% of Kahului, HI residents are foreign-born (26.0% born in Asia, 4.3% born in Oceania), which is 45.1% greater than the foreign-born rate of 18.0% across the entire state of Hawaii.
Race distribution in Kahului
2000 2022
10,594 52.6% Asian alone 4,047 20.1% Two or more races 1,911 9.5% Native Hawaiian and Other 1,763 8.8% Hispanic 1,733 8.6% White alone 42 0.2% Black alone 26 0.1% Other race alone 30 0.1% American Indian alone
12,946 47.7% Asian alone 5,518 20.3% Two or more races 2,698 9.9% White alone 2,517 9.3% Hispanic 2,321 8.5% Native Hawaiian and Other 425 1.6% Black alone 43 0.2% Other race alone 22 0.08% American Indian alone
2000 2022
494,149 40.8% Asian alone 277,091 22.9% White alone 218,700 18.1% Two or more races 108,441 9.0% Native Hawaiian and Other 87,699 7.2% Hispanic 20,829 1.7% Black alone 2,089 0.2% Other race alone 2,539 0.2% American Indian alone
498,125 34.6% Asian alone 318,574 22.1% Two or more races 297,937 20.7% White alone 160,103 11.1% Hispanic 134,567 9.3% Native Hawaiian and Other 23,682 1.6% Black alone 5,378 0.4% Other race alone 1,830 0.1% American Indian alone
Income and house value in Kahului Median household income in 2022 $82,850 White non-Hispanic householders$188,606 Black householders$110,723 Asian householders$52,556 Native Hawaiian and other Pacific Islander householders$82,356 Some other race householders$80,992 Two or more races householders$41,369 Hispanic or Latino race householdersMedian 2022 house value $863,738 White Non-Hispanic householders $902,197 Asian householders$821,673 Native Hawaiian and other Pacific Islander householders$600,931 Some other race householders$997,545 Two or more races householders$987,129 Hispanic or Latino householders
Median age by race in Kahului
55.9 Median age for White residents56.0 55.2 38.6 Median age for Black or African American residents41.0 39.7 40.2 Median age for American Indian / Alaska Native residents34.1 -904,439,427.2 48.2 Median age for Asian residents47.3 49.1 40.1 Median age for Native Hawaiian / Pacific Islander residents48.6 34.5 51.1 Median age for Other race residents58.4 27.2 31.7 Median age for Two or more races residents35.4 24.1 59.7 Median age for White alone residents58.0 64.7 35.2 Median age for Hispanic or Latino residents44.8 24.3
Owner/renter occupied households by race in Kahului
House owners and renters - White residents 765 61.4% Owner occupied481 38.6% Renter occupiedHouse owners and renters - Black or African American residents 103 86.1% Owner occupied17 13.9% Renter occupiedHouse owners and renters - American Indian / Alaska Native residents 29 100.0% Renter occupiedHouse owners and renters - Asian residents 3,415 78.4% Owner occupied942 21.6% Renter occupiedHouse owners and renters - Native Hawaiian / Pacific Islander residents 85 9.5% Owner occupied806 90.5% Renter occupiedHouse owners and renters - Other race residents 73 32.2% Owner occupied154 67.8% Renter occupiedHouse owners and renters - Two or more races residents 972 59.1% Owner occupied673 40.9% Renter occupiedHouse owners and renters - White alone residents 782 63.8% Owner occupied444 36.2% Renter occupiedHouse owners and renters - Hispanic or Latino residents 248 35.5% Owner occupied451 64.5% Renter occupied
Language usage in Kahului
English speakers - Total 67.1% of residents of Kahului speak English at home.
1.7% of residents speak Spanish at home 260 60.3% Speak English very well171 39.7% Speak English less than very well29.8% of residents speak other language at home 3,153 40.6% Speak English very well4,612 59.4% Speak English less than very well
English speakers - Born in the United States 95.6% of residents of Kahului speak English at home.
1.4% of residents speak Spanish at home 32 65.3% Speak English very well17 34.7% Speak English less than very well2.4% of residents speak other language at home 17 20.7% Speak English very well65 79.3% Speak English less than very well
English speakers - Native, born elsewhere 67.9% of residents of Kahului speak English at home.
36.4% of residents speak other language at home 65 28.4% Speak English very well164 71.6% Speak English less than very well
English speakers - Foreign-born 14.1% of residents of Kahului speak English at home.
2.4% of residents speak Spanish at home 71 43.6% Speak English very well92 56.4% Speak English less than very well83.6% of residents speak other language at home 1,972 34.2% Speak English very well3,792 65.8% Speak English less than very well
White (Caucasian) - Speak only English Native:
96.8% (2,658)Foreign-born:
59.3% (129)
White (Caucasian) - Speak another language Native:
3.4% (94)Foreign-born:
40.6% (89)
Black or African American - Speak only English Native:
100.0% (272)Foreign-born:
100.0% (52)
Asian - Speak only English Native:
90.2% (6,537)Foreign-born:
7.7% (424)
Asian - Speak another language Native:
10.3% (747)Foreign-born:
93.1% (5,154)
Native Hawaiian / Pacific Islander - Speak only English Native:
78.3% (1,155)Foreign-born:
24.6% (241)
Native Hawaiian / Pacific Islander - Speak another language Native:
15.6% (230)Foreign-born:
72.7% (712)
Other race - Speak another language Native:
38.4% (134)Foreign-born:
72.0% (233)
Two or more races - Speak only English Native:
92.8% (5,708)Foreign-born:
47.8% (84)
Two or more races - Speak another language Native:
6.6% (404)Foreign-born:
53.2% (94)
White alone - Speak only English Native:
96.6% (2,307)Foreign-born:
60.5% (128)
White alone - Speak another language Native:
3.4% (81)Foreign-born:
39.9% (84)
Hispanic or Latino - Speak only English Native:
86.2% (1,755)Foreign-born:
18.0% (56)
Hispanic or Latino - Speak another language Native:
12.9% (263)Foreign-born:
67.3% (210)
Foreign-born residents in Kahului 8,901 residents are foreign born (26.0% Asia , 4.3% Oceania ).
This city:
32.8%Hawaii:
18.0%
Marital status for residents in Kahului Marital status - White (Caucasian) population 15 years and over
Males 39.1% Never married40.9% Now married0.6% Separated0.5% Widowed18.9% DivorcedFemales 29.7% Never married44.5% Now married1.8% Separated11.0% Widowed13.0% DivorcedWomen who gave birth in the past 12 months Now married:
100.0% (30)Unmarried:
0.0% (0)
Women who did not give birth in the past 12 months Now married:
38.5% (196)Unmarried:
61.5% (313)
Marital status - Black or African American population 15 years and over
Males 35.4% Never married64.6% Now married0.0% Separated0.0% Widowed0.0% DivorcedFemales 0.0% Never married91.0% Now married0.0% Separated0.0% Widowed9.0% DivorcedWomen who did not give birth in the past 12 months Now married:
100.0% (33)Unmarried:
0.0% (0)
Marital status - American Indian / Alaska Native population 15 years and over
Males 0.0% Never married65.0% Now married0.0% Separated0.0% Widowed35.0% DivorcedFemales 33.3% Never married0.0% Now married0.0% Separated66.7% Widowed0.0% DivorcedWomen who did not give birth in the past 12 months Now married:
0.0% (0)Unmarried:
100.0% (7)
Marital status - Asian population 15 years and over
Males 32.2% Never married57.3% Now married1.2% Separated4.0% Widowed5.3% DivorcedFemales 21.5% Never married56.1% Now married1.2% Separated14.7% Widowed6.5% DivorcedWomen who gave birth in the past 12 months Now married:
88.7% (113)Unmarried:
11.3% (14)
Women who did not give birth in the past 12 months Now married:
52.0% (1,312)Unmarried:
48.0% (1,211)
Marital status - Native Hawaiian / Pacific Islander population 15 years and over
Males 47.3% Never married45.2% Now married3.1% Separated0.0% Widowed4.4% DivorcedFemales 33.6% Never married46.1% Now married4.9% Separated8.3% Widowed7.1% DivorcedWomen who gave birth in the past 12 months Now married:
32.0% (14)Unmarried:
68.0% (30)
Women who did not give birth in the past 12 months Now married:
42.8% (230)Unmarried:
57.2% (307)
Marital status - Other race population 15 years and over
Males 0.0% Never married40.5% Now married23.0% Separated0.0% Widowed36.5% DivorcedFemales 76.9% Never married9.5% Now married0.0% Separated0.0% Widowed13.5% DivorcedWomen who did not give birth in the past 12 months Now married:
0.0% (0)Unmarried:
100.0% (305)
Marital status - Two or more races population 15 years and over
Males 48.3% Never married36.0% Now married1.7% Separated1.2% Widowed12.8% DivorcedFemales 48.1% Never married31.8% Now married0.3% Separated5.9% Widowed13.9% DivorcedWomen who gave birth in the past 12 months Now married:
100.0% (62)Unmarried:
0.0% (0)
Women who did not give birth in the past 12 months Now married:
27.0% (416)Unmarried:
73.0% (1,127)
Marital status - White alone, not Hispanic / Latino population 15 years and over
Males 29.6% Never married47.2% Now married0.7% Separated0.6% Widowed21.8% DivorcedFemales 20.7% Never married50.7% Now married1.1% Separated12.6% Widowed14.9% DivorcedWomen who gave birth in the past 12 months Now married:
100.0% (31)Unmarried:
0.0% (0)
Women who did not give birth in the past 12 months Now married:
53.5% (195)Unmarried:
46.5% (169)
Marital status - Hispanic or Latino population 15 years and over
Males 55.8% Never married21.7% Now married6.1% Separated0.0% Widowed16.4% DivorcedFemales 57.4% Never married22.1% Now married1.8% Separated6.1% Widowed12.6% DivorcedWomen who did not give birth in the past 12 months Now married:
25.1% (177)Unmarried:
74.9% (527)
Ancestries in Kahului
269 1.6% Portuguese131 0.8% English130 0.8% German82 0.5% Italian74 0.4% European58 0.3% Australian44 0.3% Irish43 0.3% Greek37 0.2% Russian33 0.2% Norwegian33 0.2% Scottish19 0.1% Belgian17 0.1% Polish16 0.10% British14 0.08% Lebanese13 0.08% French Canadian13 0.08% Scotch-Irish9 0.05% Brazilian9 0.05% Northern European8 0.05% Dutch8 0.05% South African7 0.04% Ukrainian
Geographical mobility in Kahului Same house 1 year ago 2,728 86.3% White (Caucasian)264 80.7% Black or African American34 93.1% American Indian / Alaska Native12,572 95.2% Asian1,671 72.5% Native Hawaiian / Pacific Islander697 100.0% Other race5,510 84.9% Two or more races2,241 83.3% White alone, not Hispanic / Latino2,150 85.9% Hispanic or LatinoMoved within same county 374 11.8% White / Caucasian31 9.5% Black or African American695 5.3% Asian472 20.5% Native Hawaiian / Pacific Islander9 1.3% Other race443 6.8% Two or more races367 13.7% White alone, not Hispanic / Latino213 8.5% Hispanic or LatinoMoved within same state 83 2.6% White / Caucasian165 1.2% Asian130 5.6% Native Hawaiian / Pacific Islander11 1.6% Other race64 1.0% Two or more races84 3.1% White alone, not Hispanic / Latino23 0.9% Hispanic or LatinoMoved from different state 79 2.5% White / Caucasian25 7.6% Black or African American69 0.5% Asian12 0.5% Native Hawaiian / Pacific Islander434 6.7% Two or more races75 2.8% White alone, not Hispanic / Latino41 1.6% Hispanic or LatinoMoved from abroad 220 9.5% Native Hawaiian / Pacific Islander15 0.2% Two or more races
Children Nativity (place of birth) in Kahului
Children under 6 years - Living with two parents Both parents native 282 100.0% NativeBoth parents foreign-born 91 79.8% Native23 20.2% Foreign-bornOne native, one foreign-born parent 302 100.0% NativeChildren under 6 years - Living with one parent Native parent 255 100.0% NativeForeign-born parent 126 66.0% Native65 34.0% Foreign-bornChildren 6 to 17 years - Living with two parents Both parents native 1,369 100.0% NativeBoth parents foreign-born 564 68.7% Native257 31.3% Foreign-bornOne native, one foreign-born parent 231 79.9% Native58 20.1% Foreign-bornChildren 6 to 17 years - Living with one parent Native parent 789 100.0% NativeForeign-born parent 583 55.5% Native467 44.5% Foreign-born
Grandparents responsible for own grandchildren in Kahului
Grandparents (30 to 59 years) Asian 33 29.3% Responsible for grandchildren80 70.7% Not responsible for grandchildrenNative Hawaiian / Pacific Islander 20 100.0% Responsible for grandchildrenOther race 52 100.0% Responsible for grandchildrenHispanic or Latino 35 100.0% Responsible for grandchildrenGrandparents (60 years and over) Asian 57 6.3% Responsible for grandchildren854 93.7% Not responsible for grandchildrenNative Hawaiian / Pacific Islander 13 19.5% Responsible for grandchildren55 80.5% Not responsible for grandchildren